Pharmacology & Pharmacy
Vol.4 No.1(2013), Article ID:26508,6 pages DOI:10.4236/pp.2013.41001
Flavin-Containing Monooxygenase (FMO) Protein Expression and Its Activity in Rat Brain Microvascular Endothelial Cells
![]()
1Department of Pharmaceutics, Faculty of Pharmaceutical Sciences, Tokushima Bunri University, Tokushima, Japan; 2Faculty of Pharmacy, Iwaki Meisei University, Fukushima, Japan.
Email: *esakurai@ph.bunri-u.ac.jp
Received August 24th, 2012; revised October 27th, 2012; accepted November 17th, 2012
Keywords: Rat Microvascular Endothelial Cells; Flavin-Containing Monooxygenase (FMO); FMO Protein Expression; FMO Activity; BBB
ABSTRACT
The aim of this study was to examine whether flavin-containing monooxygenase (FMO) protein was expressed in cultured rat brain microvascular endothelial cells (BMECs), which constitute the blood-brain barrier (BBB), and whether N-oxide from the tertiary amine, d-chlorpheniramine, was formed by FMO in rat BMECs. BMECs were isolated and cultured from the brains of three-week-old male Wistar rats. The expression of FMO1, FMO2 and FMO5 proteins was confirmed in rat BMECs by western blotting analysis using polyclonal anti-FMO antibodies, but FMO3 and FMO4 proteins were not found in the rat BBB. Moreover, N-oxide of d-chlorpheniramine was formed in rat BMECs. The intrinsic clearance value for N-oxidation at pH 8.4 was higher than that at pH 7.4. Inhibition of N-oxide formation by methimazole was found to be the best model of competitive inhibition yielding an apparent Ki value of 0.53 μmol/L, suggesting that N-oxidation was catalyzed by FMOs in rat BMECs. Although FMO activity in rat BMECs was lower than that in SD rat normal hepatocytes (rtNHeps), we suggest that rat BMECs enzymes can convert substrates of exogenous origin for detoxification, indicating that BMECs are an important barrier for metabolic products besides hepatic cells.
1. Introduction
Brain microvascular endothelial cells (BMECs) are a major structural and functional component of the bloodbrain barrier (BBB) that maintains homeostasis of the central nervous system. BMECs have unique and efficient protective systems controlling the passage of materials from the blood into the brain. The first is a permeability barrier and the second seems to be a metabolic barrier, formed by enzymes in the endoplasmic reticulum of endothelial cells which metabolize some permeable molecules recognized as substrates. Previous data indicate that isolated brain capillaries contain activities of enzymes involved in drug metabolism such as cytochrome P450s (CYPs) [1], NADPH-cytochrome P450 reductase, 1-naphthol glucuronyltransferase, and epoxide hydrolase [2]. Therefore, they are able to protect the brain from chemical insult. The possible implication of CYP 2E1 in rat vascular metabolism of arachidonic acid to vasoactive compounds has been also suggested, resulting in a functional role for this isoform [3]. On the other hand, like CYP, flavin-containing monooxygenases (FMOs) are microsomal enzymes that require NADPH and O2, and catalyze the oxidation of nucleophilic tertiary amines to N-oxides and secondary amines to hydroxylamines and oximes. Moreover, humans and other mammals express five different FMOs (FMO1, FMO2, FMO3, FMO4, and FMO5) in a speciesand tissue-specific manner [4]. However, little is known about the presence of FMOs localized in the BBB.
In the present study, we examined whether cultured rat microvascular endothelial cells (BMECs) have the ability to form N-oxide from the tertiary amine, d-chlorpheniramine, and whether FMOs proteins are expressed in rat BMECs.
2. Experimental
2.1. Materials
d-Chlorpheniramine N-oxide was synthesized, as described by Craig and Purushothaman [5], and separated by HPLC as described below. d-chlorpheniramine maleate, glucose 6-phosphate dehydrogenase, NADP, glucose 6-phosphate were obtained from Wako Pure Chemicals (Osaka, Japan). Gentamicin sulfate and amphotericin B were purchased from Sigma-Aldrich (St. Louis, MO, USA). Dulbecco’s modified Eagle’s medium: nutrient mixture F-12 (D-MEM/F-12), heparin, piperazine-N’-(2-ethane-sulfonic acid) (HEPES), dispase, epidermal growth factor (EGF), fetal bovine serum (FBS), and donor horse serum (HS) were obtained from Gibco BRL, Life Technologies (Rockville, MD). Dextran T-70 and Percoll were obtained from Pharmacia (Uppsala, Sweden). Collagenase/- dispase was purchased from Boehringer Mannheim (Mannheim, Germany). Acetylated low density lipoprotein labeled with a fluorescent probe, 1,1’-dioctadecyl- 3,3,3’,3’tetramethyl-indocarbocyamine perchlorate (DiIAc-LDL), was obtained from Biomedical Technologies (Stoghton, MA, USA). SD rat normal hepatocytes (rtNHeps) were purchased from Takara Bio Products (Ootu, Japan). All other chemicals were of reagent grade and commercially available.
2.2. Isolation and Culture of Rat BMECs
Three-week-old male Wistar rats purchased from Japan SLC (Hamamatsu, Japan) were housed at a constant temperature (23˚C ± 1˚C) and constant humidity (55% ± 5%), with automatically controlled lighting (07:00-19:00). Rat BMECs were isolated using a technique described previously [6,7]. Twenty rats were killed by decapitation. After removal of the choroid plexuses and diencephalon, cerebral cortical tissues were cleaned of meninges and superficial blood vessels, minced into 1 to 2 mm cubes, and incubated in M199 containing 0.2% dispase at 37˚C for 120 min. The dispase suspension was spun at 1000 × g for 10 min and then the pellet was resuspended in M199 containing 13% dextran. After centrifugation at 5800 × g and 4˚C for 10 min, the fat pad and dextran solution were collected into a new tube and spun again. Two pellets were collected and resuspended in the new dextran solution and spun. The resulting tissue pellet was resuspended in M199 and filtered through a 300-μm mesh. The microvessel suspension was dissociated using 0.1% collagenase/dispase in M199 at 37˚C for 60 min. After enzyme treatment, microvessels were collected by centrifugation at 1000 × g for 10 min, and resuspended in M199. The suspension was layered on a Percoll gradient formed by centrifugation of 50% Percoll at 26,000 × g at 4˚C for 60 min and then centrifuged at 600 × g for 10 min. Three layers were observed after Percoll gradient centrifugation. Endothelial cell aggregates formed a band around the middle third of the gradient, and the entire middle layer was collected from gradients. Cells were resuspended in M199 and collected by centrifugation at 600 × g for 10 min. Cell suspensions were seeded onto collagen-coated 75 cm2 tissue culture flasks (Iwaki GlassFunabashi, Japan). Cells were allowed to attach and grow to monolayers at 37˚C in a humidified atmosphere of 5% CO2/95% air. The culture medium (D-MEM/F-12 containing 14 mmol/L of sodium bicarbonate, 20 μg/mL of EGF, 50 μg/mL of gentamycin-amphotericin B, 10 U/mL of heparin, 5% FBS, and 5% HS) was changed every 3 days. A subculture was performed when cells reached confluence, after approximately 10 - 12 days. Cells were trypsinized at a ratio of 1:3 after reaching confluence using 0.025% trypsin in HBSS containing 0.02% EDTA. Secondary subcultured cells (5 × 10⁵ cells∙cm−2) were grown on collagen-coated 225 cm2 tissue culture flasks. All metabolism experiments were performed on only second passaged BMECs after cells reached confluence, in approximately 10 - 12 days.
2.3. Western Blot Analysis
BMECs were washed with ice-cold phosphate buffered saline (PBS (-)). BMECs were then harvested and the pellet was lysed in RIPA buffer (Nacalai tesque, Kyoto, Japan). Lysates were incubated for 15 min on ice prior to sonication and then centrifuged at 10,000 × g for 20 min at 4˚C. Protein content was determined by a BCA protein kit (Thermo Scientific, Rockford, USA). Equivalent protein aliquots (5.0 μg) were separated by 10% SDS-PAGE and transferred electrophoretically to an Immobilon-P transfer membrane (Millipore Corporation, Billerica, MA, USA). The membrane was blocked with Blocking One (Nacalai tesque, Kyoto, Japan) and then incubated with primary antibodies against FMO1 (Rabbit polyclonal IgG at dilution of 1:1500, Santa Cruz), FMO2 (Rabbit polyclonal IgG at dilution of 1:1000, Protein Tech Group Inc., Chicago, USA), FMO3 (Goat polyclonal IgG at dilution of 1:1000, Santa Cruz, California, USA), FMO4 (Rabbit polyclonal IgG at dilution of 1:1000, Protein Tech Group Inc., Chicago, USA), or FMO5 (Rabbit polyclonal IgG at dilution of 1:1000, Protein Tech Group Inc., Chicago, USA). These primary antibodies used in this experiment have specificity reaction in human, rat and mouse, respectively. Blots were incubated with HRP-conjugated anti-rabbit antibody (GE Healthcare UK Ltd., Amersham Place, Little Chalfont, Buckinghamshire HP7 9NA, England) or anti-goat antibody (Santa Cruz, Chicago, USA), and detected with ECL Plus Western blotting detection reagents (GE Healthcare UK Ltd., Amersham Place, Little Chalfont, Buckinghamshire HP7 9NA, England). The antibody of each FMO used shows no cross-reactivity with the other FMO isoforms.
2.4. Enzyme Assay
For enzyme kinetic studies, cultured rat BMECs were homogenized in 0.1 mol/L phosphate buffer (pH 7.4 and 8.4, respectively). Incubation vessels contained rat BMECs (0.25 mg protein/mL), MgCl2 (25 mmol/L), glucose 6- phosphate (6.7 mmol/L), nicotine amide (2.5 mmol/L), and glucose 6-phosphate dehydrogenase (1 unit/mL) in a total volume of 100 μL. d-Chlorpheniramine-dissolved 0.1 mol/L phosphate buffer (pH 7.4 and 8.4, respectively) was the substrate at a final concentration in the range of 0.08 to 1.04 mmol/L. After addition of NADP (0.5 mmol/L in 0.1 mol/L phosphate buffer), the mixtures were incubated for 2 min at 37˚C in a shaking water bath. At the end of the incubation, 600 μL of acetonitrile was added as a reaction stopper. After vortex mixing, the deproteinized sample was centrifuged at 9000 × g for 15 min. The supernatant was evaporated for 5 min, and 50 μL of the residues was injected onto a HPLC column. Protein concentrations were assayed by the method of Markwell et al. [8].
Moreover, cultured rat BMECs and rtNHeps were homogenized in 0.1 mol/L phosphate buffer (pH 7.4), respectively. The enzyme was incubated with 0.16 mmol/L d-chlorpheniramine for 2 min at 37˚C in a shaking water bath.
2.5. Inhibition Study
Methimazole was used for the inhibition study of FMO. Metabolism of d-chlorpheniramine (0.16 mmol/L) was examined with or without methimazole (10−8 - 10−3 mol/L) by the method described above. Inhibition kinetics for methimazole were determined in BMECs homogenates using the standard assay procedure with eight to nine different d-chlorpheniramine concentrations and methimazole (1 μmol/L). Data were analyzed by nonlinear regression analysis to allow determination of the type of inhibition and inhibitory constants.
2.6. HPLC Condition
HPLC was performed with a Shimazu (Kyoto, Japan) LC-6A apparatus equipped with a UV detector (Shimazu SPD-10AVP, Kyoto, Japan) and LiChrospher Si60 column (250 × 4.6 mm i.d., 5 μm particle size, Kanto Chemical Co., INC, Tokyo, Japan). Material was eluted with 73:25:2, v/v, acetonitrile-methano l% - 28% ammonia water at a flow rate of 1 mL/min at 30˚C, and the absorption at 228 nm was measured. The peak of synthesized d-chlorpheniramine N-oxide was symmetrical and clearly separated from other peaks. The calibration curve for metabolites was linear over the concentration range 50 μg/mL and the lower limit for quantitation was 0.1 μg/mL.
2.7. Data Analysis
The formation of metabolites from d-chlorpheniramine was calculated as nmol formed/min/mg protein. Kinetic data were fit to the Michaelis-Menten equation for a oneenzyme or two-enzyme system using the non-linear leastsquares regression analysis program MULTI, and apparent Km and Vmax values were estimated. Values are presented as mean ± s.e.m. of means for n experiments. Comparisons of data among groups were carried out using an analysis of variance and Dunnett’s post hoc multiple-comparisons test. Differences were considered significant at P < 0.05 (two-tailed).
3. Results
3.1. The Formation Rate of d-Chlorpheniramine N-Oxide in Rat BMECs
Figure 1 shows respective Michaelis-Menten plots for the formation of d-chlorpheniramine N-oxide from dchlorpheniramine incubated with cultured rat BMECs and the concentration of d-chlorpheniramine (0.08 - 1.04 mmol/L). The apparent Km and Vmax values for N-oxidation at pH 7.4 and 8.4 are listed in Table 1. Consequently, the intrinsic clearance value (Vmax/Km) for N-oxidation at pH 8.4 was higher than that at pH 7.4. As shown in an Eadie-Hofstee plot, the formation of N-oxide was analyzed to be monophasic at pH 7.4 and 8.4, respectively.
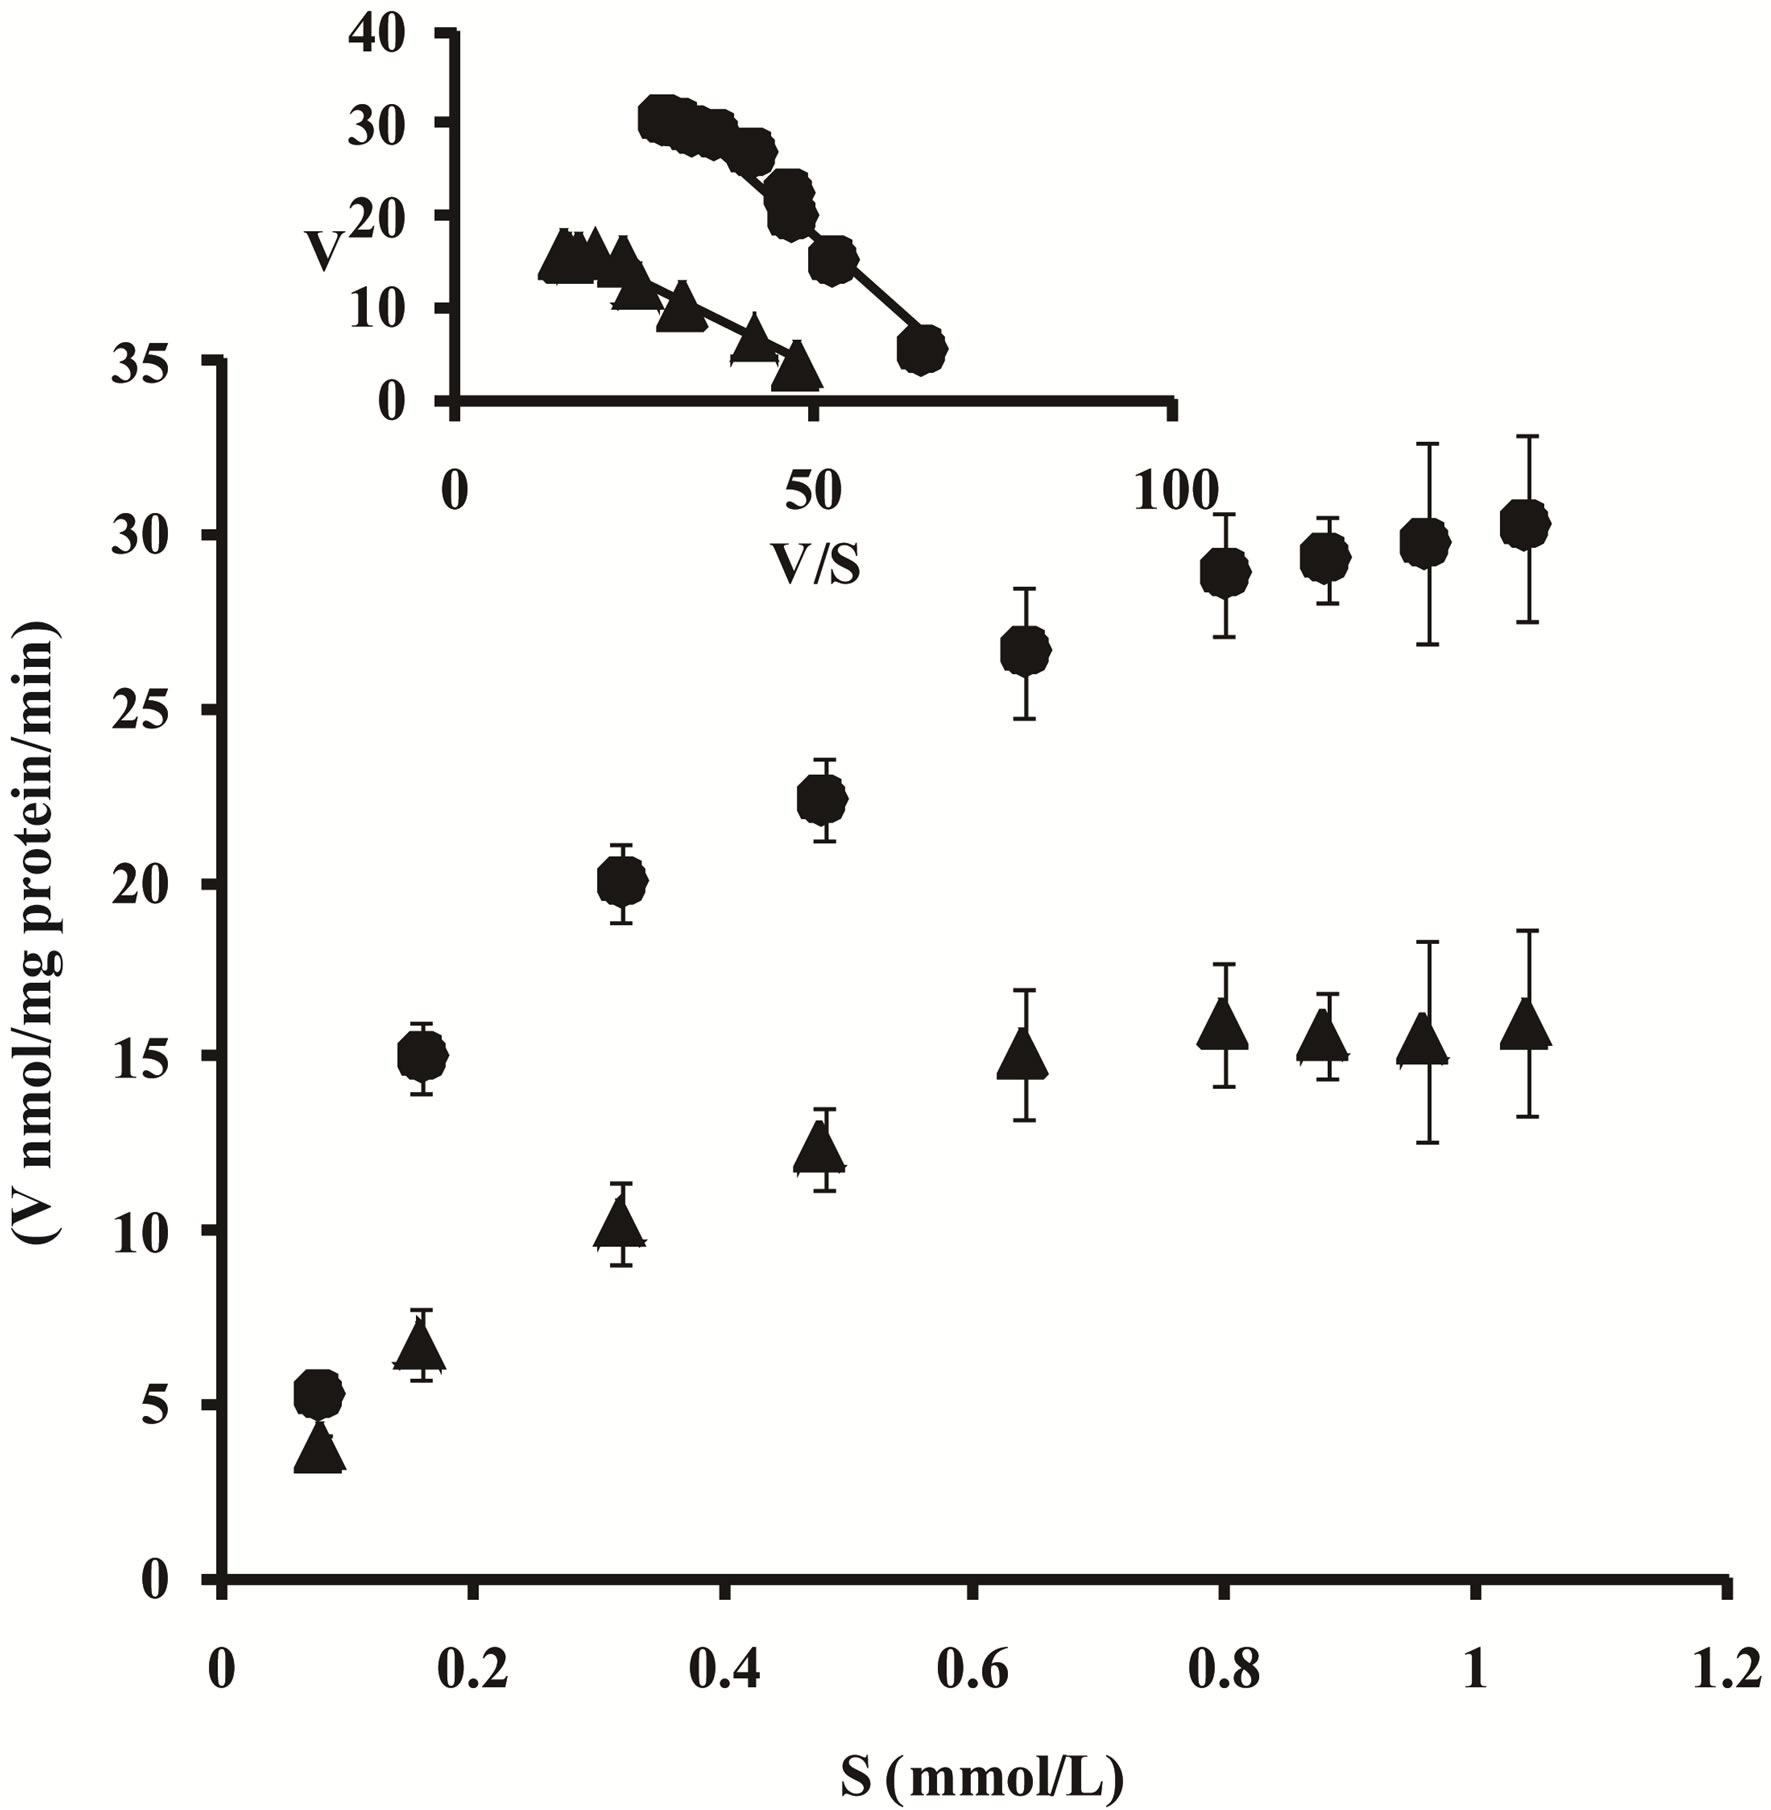
Figure 1. Michaelis-Menten plots for the formation of dchlorpheniramine N-oxide (▲, pH 7.4; ●, pH 8.4) from dchlorpheniramine incubated with homogenized rat BMECs. d-Chlorpheniramine metabolism was determined at 37˚C for 2 min at concentrations between 0.08 and 1.04 mmol/L. Inset: Eadie-Hofstee plots. Each point represents the mean ± S.E. of five experiments. V, metabolite formation rate (nmol/mg protein/min); S, d-chlorpheniramine concentration (mmol/L).
Table 1. Kinetic parameters for N-oxide formation from d-chlorpheniramine at pH 7.4 and 8.4 in rat BMECs.
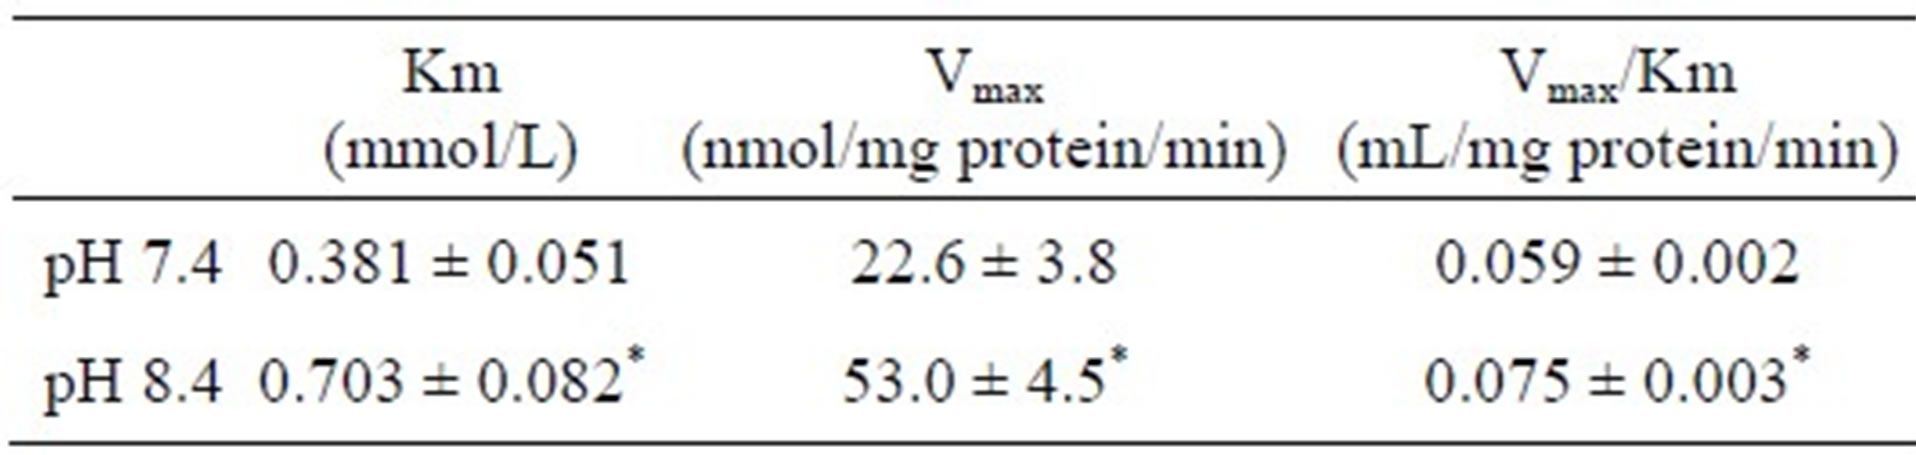
Each value is expressed as the mean ± S.E. of five experiments. *P < 0.05, significantly different between pH 7.4 and 8.4.
3.2. FMO Protein Expression in Rat BMECs
As shown in Figure 2, the FMO1 (A), FMO2 (B), and FMO5 (E) bands were 60, 50, and 60 kDa, respectively, in BMECs. However, FMO3 (C) and 4 (D) proteins were not found at the rat BBB.
3.3. The Inhibitory Effect of Methimazole on FMO Activity in Rat BMECs
The effect of enzyme inhibitors on FMO activity was examined to determine the contribution of FMO in rat BMECs (Figure 3). The formation of d-chlorpheniramine N-oxide was inhibited by methimazole in a dosedependent manner. Moreover, the inhibition kinetics of FMO in rat BMECs upon the addition of methimazole were investigated using Lineweaver-Burk plots (Figure 4). Methimazole competitively inhibited FMO activity, and the Ki value was estimated to be 0.53 μmol/L.
3.4. The N-Oxidation Activity for d-Chlorpheniramine in rtNHeps
The N-oxidation activity for d-chlorpheniramine in rat BMECs was compared with that in rtNHeps. When the enzyme in BMECs and rtNHeps was incubated with 0.16 mmol/L d-chlorpheniramine, the formation rates of dchlorpheniramine N-oxide in rat BMECs and rtNHeps were 6.73 and 12.06 nmol/mg protein/min, respectively (Table 2).
4. Discussion
The accumulation in the brain of drugs which act in the central nervous system has toxic effects; therefore, transfer of these drugs to the brain may be limited in microvascular endothelial cells that constitute the BBB in the brain. The importance of drug biotransformation in endothelial cells is now being recognized and several investigators report CYP-dependent drug oxidation activity in endothelial cells: induction of endothelial CYP monooxygenases can be achieved on treatment with various chemical agents [9-12]. On the other hand, FMOs oxidize the nucleophilic nitrogen, sulfur, and phosphorus heteroatom of a variety of xenobiotics.
In centrally acting drugs, there are many compounds
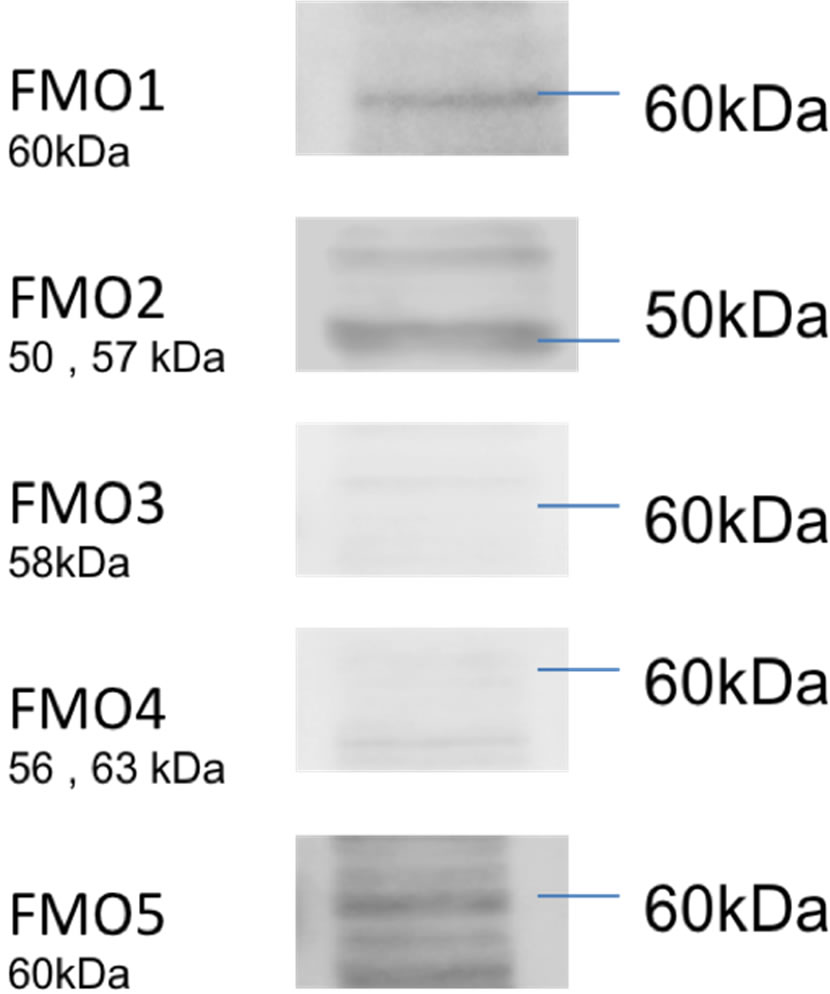
Figure 2. Western blots for FMOs in rat BMECs. The FMO1, FMO2, and FMO5 bands are 60, 50, and 60 kDa, respectively.
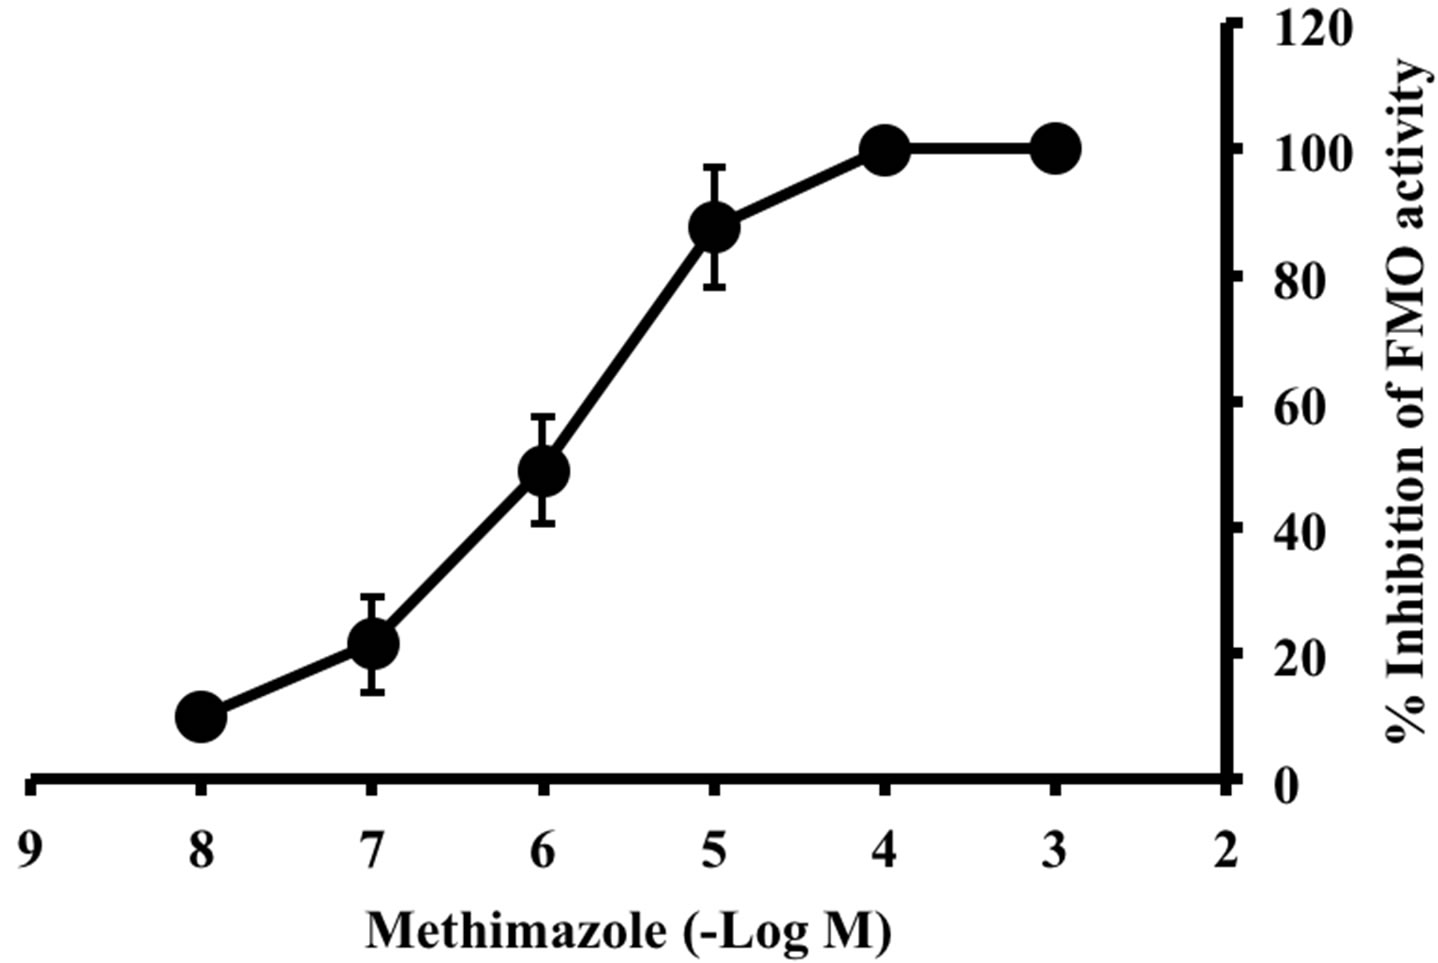
Figure 3. Effect of methimazole on formation of d-chlorpheniramine N-oxide in rat BMECs. The FMO activities were determined with d-chlorpheniramine (0.16 mmol/L) at 37˚C for 2 min. Enzyme activities in the presence of methimazole are expressed as the percent inhibited of the total activity in the absence of this compound. Values represent the mean ± S.E. of five experiments.
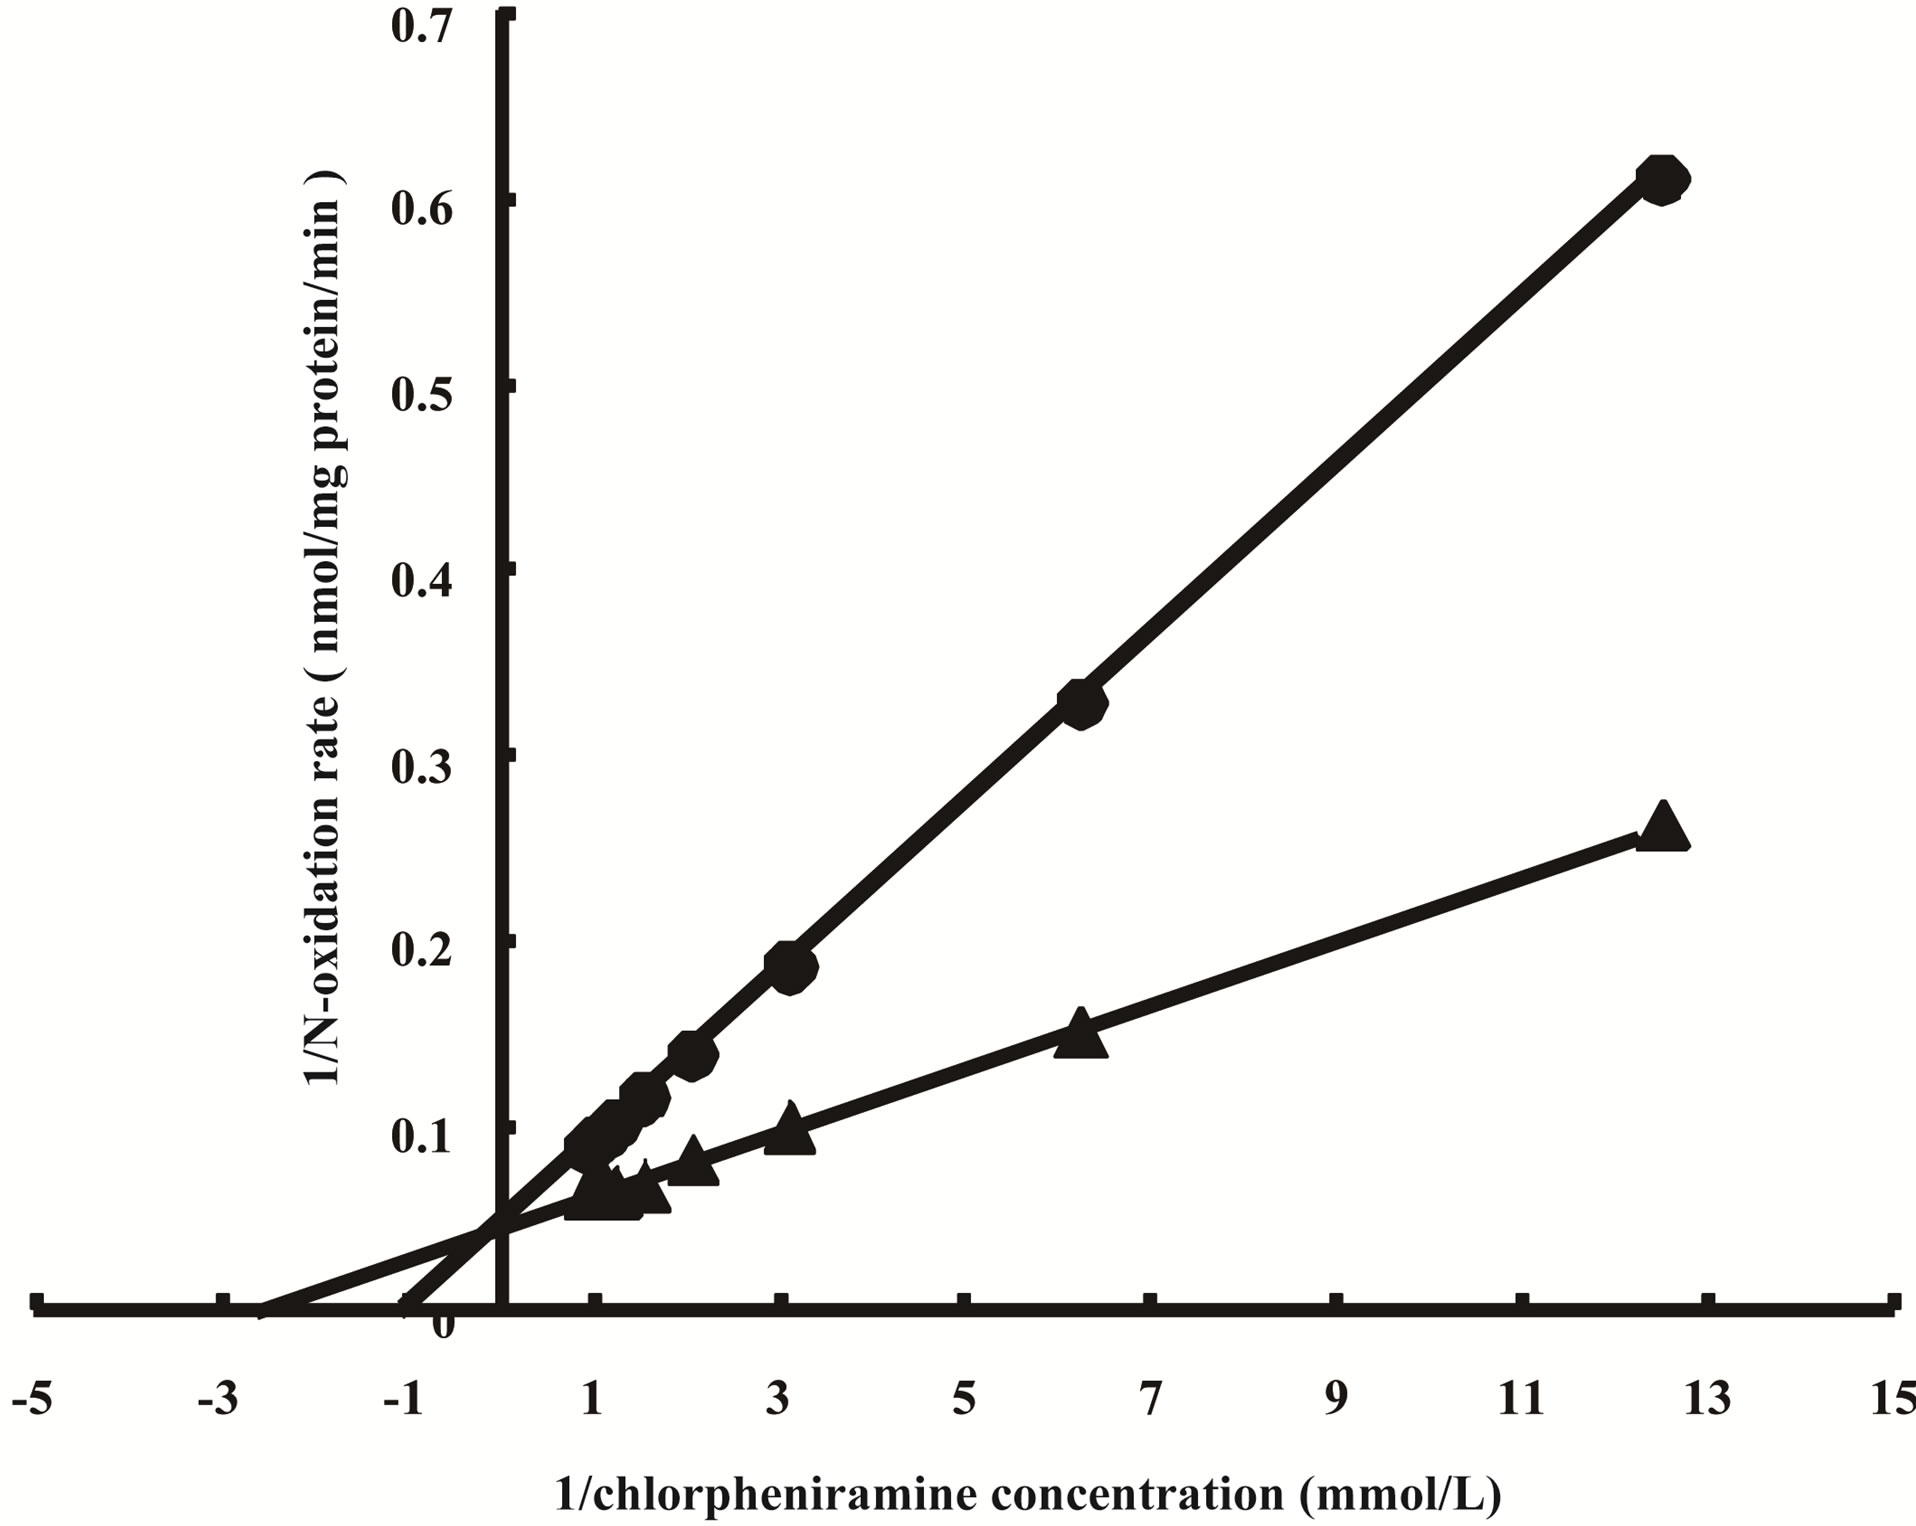
Figure 4. Inhibition of d-chlorpheniramine N-oxidation by methimazole in rat BMECs. Lineweaver-Burk plots of the reciprocal of the initial velocity of d-chlorpheniramine Noxidation against the reciprocal of the d-chlorpheniramine concentration in the presence of methimazole. Each line is the best fit through the means of FMO activities for three data. ▲, no drug added; ●, methimazole (1 μmol/mL).
Table 2. Formation of d-chlorpheniramine N-oxide from d-chlorpheniramine in rat BMECs and rtNHeps.
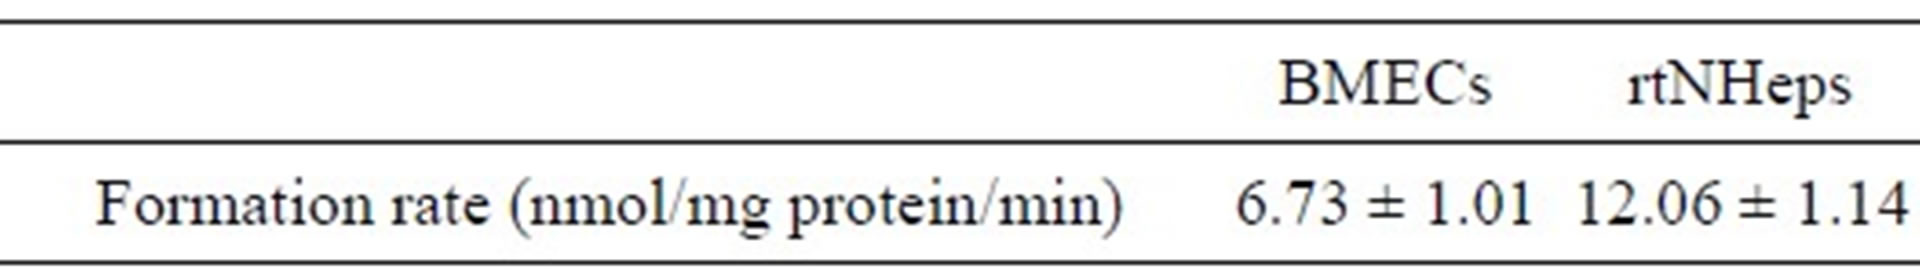
FMO enzyme in rat BMECs and rtNHeps was incubated with 0.16 mmol/L d-chlorpheniramine for 2 min at 37˚C in 0.1 mol/L phosphate buffer (pH 7.4). Each value is expressed as the mean ± S.E. of five experiments.
which have the chemical structure of a tertiary amine, with two methyl groups attached to the basic nitrogen atom. Some H1 receptor antagonists such as chlorpheniramine and diphenhydramine also have the structure of a tertiary amine, and have pronounced effects in the CNS. These are usually listed as “side effects”. Tertiary amines are metabolized in the liver by two main routes, namely N-demethylation by CYP, whereby tertiary amines are converted to secondary amines, and N-oxidation by FMO. This metabolism may occur in BMECs to protect the brain. In this study, we have quantified the activity of the d-chlorpheniramine metabolizing enzyme, FMO, and have also characterized FMO isoforms in cultured rat BMECs.
In general, FMO is relatively thermolabile and has a higher optimal pH in the reaction compared to reactions mediated by CYP [13]. Therefore, the condition of these enzymes to some reactions can be altered by the experimental conditions employed, such as pH. In this study, as shown in Eadie-Hofstee plots, the respective formations of d-chlorpheniramine N-oxide in rat BMECs were analyzed to be monophasic at pH 7.4 and 8.4. The intrinsic clearance value (Vmax/Km) for N-oxidation at pH 8.4 was also higher than that at pH 7.4, suggesting that FMO is the enzyme responsible for the formation of d-chlorpheniramine N-oxide. Moreover, to determine the contribution of the FMO enzyme to the formation of dchlorpheniramine N-oxide, we examined the effect of methimazole on this activity. Methimazole is a well known inhibitor of FMO [13]. As shown in Figures 2 and 3, the formation of d-chlorpheniramine N-oxide was competitively inhibited by methimazole in a dose-dependent manner, demonstrating the presence of the FMO enzyme in rat BMECs.
Five isoforms of FMO have been identified thus far (FMO1-FMO5) in humans [14,15]. Other mammals also express different FMOs in a speciesand tissue-specific manner [4,16]. FMO1 is the major FMO expressed in the rat liver and kidney, and low levels of FMO5 are expressed in the rat liver, kidney, and lung. However, a lack of functional FMO2 is demonstrated in the rat liver, kidney, and lung [17]. In our study, as shown in Figure 2, the presence of FMO1, 2, and 5 was confirmed in rat BMECs, but the expression of FMO3 and 4 was not observed. Moreover, various forms of FMO are distinct gene products with different physical properties and substrate specificities. Short-chain tertiary amines, such as chlorpromazine and imipramine, are substrates for FMO1, but not FMO2. Chlorpheniramine which has a shortchain tertiary amine was extensively N-oxygenated by highly purified FMO from the hog liver [1]. Chlorpheniramine N-oxide was also identified in rat and human urine [18]. Moreover, because cDNA-expressed rabbit FMO1 and FMO3 were shown to preferentially catalyze methionine in rat liver microsomes [19], our study suggested, in rat BMECs, that N-oxide of chlorpheniramine may be dominantly formed by FMO1. Further experimentation on the relationship between various forms of FMO and substrate specificities will therefore be necessary in rat brain microvascular endothelial cells.
In summary, although formation to d-chlorpheniramine N-oxide in rat BMECs was lower than that in rat hepatocytes, our results indicate that the metabolic profile of FMOs obtained in rat BMEC is similar to that obtained in rat hepatocytes. Therefore, it is suggested that BMECs which constitute the BBB in the brain are an important barrier for metabolic products as well as a permeability barrier to the passage of materials.
REFERENCES
- J. R. Cashman, J. R. Celestial and A. R. Leach, “Enantioselective N-Oxygenation of Chlorpheniramine by the Flavin-Containing Monooxygenase from Hog Liver,” Xenobiotica, Vol. 22, No. 4, 1992, pp. 459-469. doi:10.3109/00498259209046658
- J. F. Ghersi-Egea, A. Minn and G. Siest, “A New Aspect of the Protective Functions of the Blood-Brain Barrier: Activities of Four Drug-Metabolizing Enzymes in Isolated Brain Microvessels,” Life Sciences, Vol. 42, No. 24, 1988, pp. 2515-2523. doi:10.1016/0024-3205(88)90351-7
- T. Hannsson, N. Tindberg, M. Inglman-Sundberg and C. Kohler, “Regional Distribution of Ethanol-Inducible Cytochrome P-450 IIE1 in the Rat Central Nervous System,” Neuroscience, Vol. 34, No. 2, 1990, pp. 451-453. doi:10.1016/0306-4522(90)90154-V
- J. R. Cashman, “Structural and Catalytic Properties of the Mammalian Flavin-Containing Monooxygenase,” Chemical Research in Toxicology, Vol. 8, No. 2, 1995, pp. 165- 181. doi:10.1021/tx00044a001
- J. C. Craig and K. K. Purushothaman, “An Improved Preparation of Tertiary Amine N-Oxides,” Journal of Organic Chemistry, Vol. 35, No. 5, 1970, pp. 1721-1722. doi:10.1021/jo00830a121
- N. Ichikawa, K. Naora, H. Hirano, M. Hashimoto, S. Masumura and K. J. Iwamoto, “Isolation and Primary Culture of Rat Cerebral Microvascular Endothelial Cells for Studying Drug Transport in Vitro,” Journal of Pharmacological and Toxicological Methods, Vol. 36, No. 1, 1996, pp. 45-52. doi:10.1016/1056-8719(96)00072-X
- J. Yamakami, E. Sakurai, T. Sakurada, K. Maeda and N. Hikichi, “Stereoselective Blood-Brain Transport of Histidine in Rats,” Brain Research, Vol. 812, No. 1-2, 1998, pp. 105-112. doi:10.1016/S0006-8993(98)00958-5
- M. A. K. Markwell, S. M. Haas, L. L. Bieder and N. E. Tolberg, “A Modification of the Lowry Procedure to Simplify Protein Determination in Membrane and Lipoprotein Samples,” Analytical Biochemistry, Vol. 87, No. 1, 1978, pp. 206-210. doi:10.1016/0003-2697(78)90586-9
- F. M. Farin, T. H. Pohlman and C. J. Omiecinski, “Expression of Cytochromes P450s and Microsomal Epoxide Hydrolase in Primary Cultures of Human Umbilical Vein Endothelial Cells,” Toxicology Applied Pharmacology, Vol. 124, No. 1, 1994, pp. 1-9. doi:10.1006/taap.1994.1001
- W. F. Graier, S. Simecek and M. Sturek, “Cytochrome P450 Mono-Oxygenase-Regulated Signaling of Ca+ Entry in Human and Bovine Endothelial Cells,” Journal of Physiology, Vol. 482, No. 2, 1995, pp. 259-274.
- J. J. Stegemann, M. E. Hahn, R. Weisbrod, B. R. Woodin, J. S. Joy, S. Najibi and R. A. Cohen, “Induction of Cytochrome P450 1A1 by Aryl Hydrocarbon Receptor Agonists in Porcine Aorta Endothelial Cells in Culture and Cytochrome P450 1A1 Activity in Intact Cells,” Molecular Pharmacology, Vol. 47, No. 2, 1995, pp. 296-306.
- A. S. Adeagbo, “Endothelium-Derived Hyperprolarizing Factor: Characterization as a Cytochrome P450 1ALinked Metabolite of Arachidonic Acid in Perfused Rat Mesenteric Prearteriolar Bed,” American Journal of Hypertension, Vol. 10, No. 7, 1997, pp. 763-771. doi:10.1016/S0895-7061(97)00057-5
- D. M. Ziegler, “Flavin-Containing Monooxygenases: Catalytic Mechanism and Substrate Specificities,” Drug Metabolism Reviews, Vol. 19, No. 1, 1988, pp. 1-32. doi:10.3109/03602538809049617
- V. L. Burnett, M. P. Lawton and R. M. Philpot, “Cloning and Sequencing of Flavin-Containing Monooxygenases FMO3 and FMO4 from Rabbit and Characterization of FMO3,” Journal of Biological Chemistry, Vol. 269, No. 19, 1994, pp. 14314-14322.
- R. N. Hines, J. R. Cashman, R. M. Philpot, D. E. Williams and D. M. Ziegler, “The Mammalian Flavin-Containing Monooxygenases: Molecular Characterization and Regulation of Expression,” Toxicology Applied Pharmacology, Vol. 125, No. 1, 1994, pp. 1-6. doi:10.1006/taap.1994.1042
- D. M. Ziegler, “An Overview of the Mechanism, Substrate Specificities, and Structure of FMOs,” Drug Metabolism Reviews, Vol. 34, No. 3, 2002, pp. 503-511. doi:10.1081/DMR-120005650
- V. Lattard, C. Longin-Sauvageon, S. K. Krueger and D. E. Williams, “The FMO2 Gene of Laboratory Rats, as in Most Humans, Encodes a Truncated Protein,” Biochemical Biophysical Research Communications, Vol. 292, No. 2, 2002, pp. 558-563. doi:10.1006/bbrc.2002.6656
- F. Kasuya, K. Igarashi and M. Fukui, “Metabolism of Chlorpheniramine in Rat and Human by Use of Stable Isotopes,” Xenobiotica, Vol. 21, No. 1, 1991, pp. 97-109. doi:10.3109/00498259109039454
- R. J. Krause, S. L. Ripp, P. J. Sausen, L. H. Overby, R. M. Philpot and A. A. Elfarra, “Characterization of the Methionine S-Oxidase Activity of Rat Liver and Kidney Microsomes: Immunochemical and Kinetic Evidence for FMO3 Being the Major Catalyst,” Archives Biochemistry Biophysics, Vol. 333, No. 1, 1996, pp. 109-116. doi:10.1006/abbi.1996.0370
NOTES
*Corresponding author.