Open Journal of Air Pollution
Vol.2 No.1(2013), Article ID:29001,6 pages DOI:10.4236/ojap.2013.21001
Size Distributions of Atmospheric Aerosol Compositions in Saitama, Japan
1Air Quality & Noise Management Bureau, Bangkok, Thailand
2Kyoritsu Women’s University, Tokyo, Japan
Email: *yoshizumi@kyoritsu-wu.ac.jp
Received January 15, 2013; revised February 18, 2013; accepted February 26, 2013
Keywords: Size Distribution; Chemical Compositions; Particulate Matter; Sulfate; Nitrate; Saitama; Japan
ABSTRACT
A survey of atmospheric aerosols in a suburban area near Tokyo, Japan was conducted using an Andersen sampler. Significant amounts of Na+ and Cl− collected were considered to be derived from sea salt. The difference between the Na+/Cl−ratio in the area and that in sea salt indicated a considerable loss of Cl−. This is assumed to be caused by the formation of NaNO3, which is one of the main nitrate species present. Most of the sulfate in the sample was found to be (NH4)2SO4 in the form of fine particles, which is different from the sulfate derived from sea salt and soil. The size distributions of K and Mg are also discussed in relation to particular sources.
1. Introduction
Air pollutants emitted into the atmosphere from various sources can be classified as either gaseous or particulate matter (PM). These types of pollutants are closely related to each other through gas-to-particle conversion, called condensation, and particle-to-gas conversion, called evaporation [1]. An aerosol can be defined as a system of solid or liquid particles suspended in an ambient environment. Aerosols, which can be manmade or occur naturally, vary in size and composition [2].
From the viewpoint of aerosol science, a particle is described as primary when it is emitted directly from a source into the atmosphere. On the other hand, a particle that is initially emitted as gaseous matter and then converted to PM through ambient chemical and physical processes is described as a secondary particle [3].
Understanding the behaviors of PM and the complex influences it has on human beings, animals, and plants requires analysis of size distribution, mass concentration, and chemical composition [4,5]. Size distribution and chemical composition analysis detail basic characteristics of atmospheric PM. These characteristics are closely related to the effects PM has on human health [6-8].
This study investigates the size distribution of anion species ( ,
,  , and Cl-) and cation species (
 , Ca2+, Mg2+, Na+, and K+) of PM in the atmosphere. The sources of the anion and cation species with respect to their contribution to ambient aerosol are discussed.
2. Experimental
2.1. Sampling Location
Aerosols in ambient air were collected at the Center for Environmental Science at Saitama (CESS), Kazo, Saitama Prefecture, Japan. CESS is located in a suburban area surrounded by paddy fields, vegetable gardens, and roads, as illustrated by Figure 1. An Andersen sampler was placed on the roof of the CESS air-monitoring station with an intake located approximately 4 m above ground level.
2.2. Sampling Method
Ambient aerosols were collected continuously for one
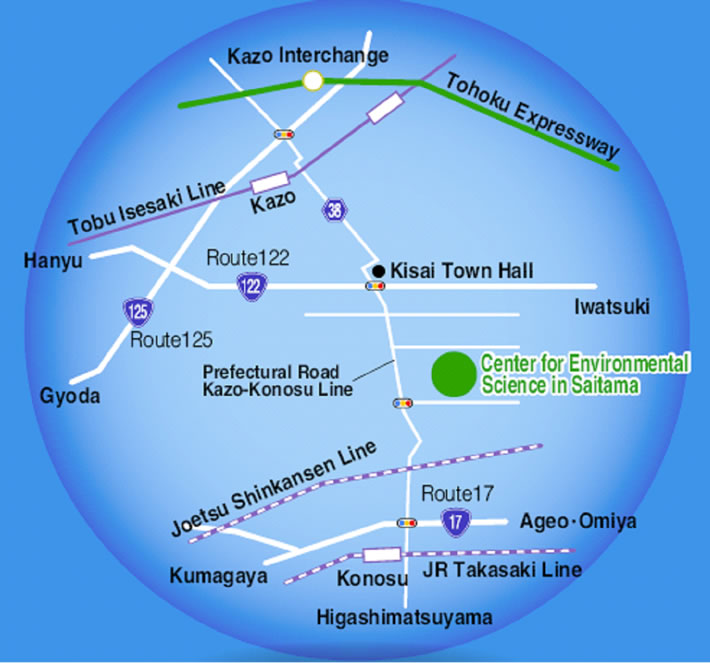
Figure 1. Location map of the study area.
week from October 23 to 30, 2009 using a 47 mm quartz filter and an eight-stage Andersen impactor (Model AN- 200) with a backup filter at an air flow rate of 28.3 L min−1. This system was used to obtain information on size-segregated particles and to classify particles into nine size ranges (0.08 to 30 μm). The Andersen sampler can selectively trap different sized particles according to their momentum.
2.3. Ion Composition Analysis
After ambient air was collected, the backup filter and the quartz filters from the eight stages were removed from the Andersen sampler and soaked in a controlled environment at 35˚C and 50% relative humidity for 24 h. After soaking, the PM mass concentrations of each stage were determined gravimetrically using an electronic microbalance in a temperature and humidity controlled room. An experiment was conducted to evaluate ion composition. The quartz filter from each stage was cut into a piece of a quarter (9 pieces in total). Cations and anions were extracted from the pieces of quartz filter using ultrapure water in an ultrasonic bath for 20 min. The cations ( , Na+, K+, Ca2+, and Mg2+) and anions (
 ,
,  , and Cl−) were analyzed by ion chromatography (DionexIC-20) using the following materials and conditions. Anion chromatography was performed with an AS12A column using 2.7 mM Na2CO3 and 0.3 mM NaHCO3 as eluents at 35˚C, a flow rate of 1.2 mL/min, and an injection volume of 25 µL. Cation chromatography was performed with a CS12A column using 20 mM methane sulfuric acid as the eluent at 35˚C, a flow rate of 1.0 mL/min, and an injection volume of 50 µL. The detection limits in millimolar were 0.003 for Na+, 0.004 for
 , 0.004 for K+, 0.004 for Mg2+, 0.015 for Ca2+, 0.021 for Cl−, 0.028 for
 , and 0.019 for
 . The calibration curves of the anions and cations were determined using standard solutions. The blank filters were also extracted and analyzed for operation blanks.
3. Results and Discussion
3.1. Ambient PM Mass Concentration
The size distribution of PM relative to mass is shown in Figure 2. The distribution is bimodal; the fine particles peak at approximately 1 μm and the coarse particles peak at approximately 4 μm. The mass concentrations of the fine and coarse particles were 20.7 and 18.8 μg/m3, respectively. The total concentration was 39.5 μg/m3, which is considered moderately polluted compared with monitoring data compiled by the Ministry of the Environment (Japan).
Typically, aerosols in the coarse particle range (>2μm) originate from natural sources, while those in the fine
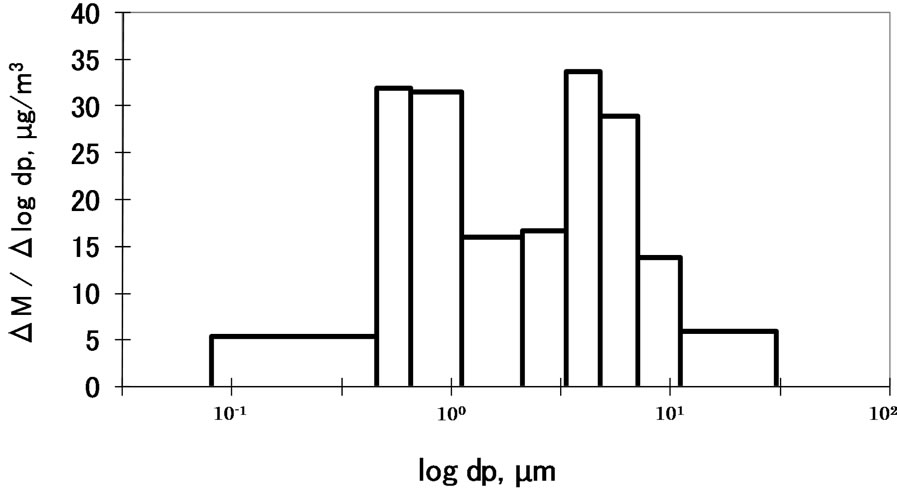
Figure 2. Size distribution of PM in the ambient air at CESS, saitama.
particle range (<2 μm) are derived from anthropogenic sources [1-5]. The size distribution shown in Figure 2 was influenced by both natural and anthropogenic sources in the study area.
3.2. Characteristics of Nitrate, Sodium and Chlorine
Figure 3 shows the size distributions of Na+, Cl−, and  at the sampling site. Cl− and
  were distributed bimodally with one peak in the fine particle range and another in the coarse particle range. However, Na+ appears to be distributed in a monomodal form with a peak in the coarse particle range. Sea salt contains Na+ and Cl− at a mole ratio of approximately 0.89 [9,10] because it is composed of species other than Na+ and Cl−. Although Saitama City is located inland, sea spray was a fairly large contributor of coarse particles. It is commonly known that coarse Na+ and Cl− particles originate from sea salt. However, the mole ratio of Na+ to Cl− in the sample does not coincide with that of sea salt, showing a lower than expected level of Cl−. The level of Cl− observed in this study gave a mole ratio of 3.60. This is thought to be due to sea salt particles reacting with ambient HNO3 and/or NO2 to form NaNO3 and releasing HCl (NaCl + HNO3 = NaNO3 + HCl) [11,12]. Accordingly, in the coarse range, it is necessary to examine the mole ratio of Na+/(Cl− and
 ) rather than that of Na+/Cl−. The recalculated value was 0.72, which is relatively close to the expected value of 0.89. This indicates that a moderately rich Cl condition was observed. However, this appears consistent with experimental and expected values.
Moreover, a small peak of Cl− was observed in the fine particle range. This peak is assumed to be derived from HCl emitted from the incineration of garbage that included polychlorinated hydrocarbons. Prior to the implementation and enforcement of strict controls, HCl emissions in Japan were significant. This study confirms that HCl remains at a noticeable level. The counter ion of Cl− is considered to be  after the neutralization of HCl with ammonia gas in ambient air.
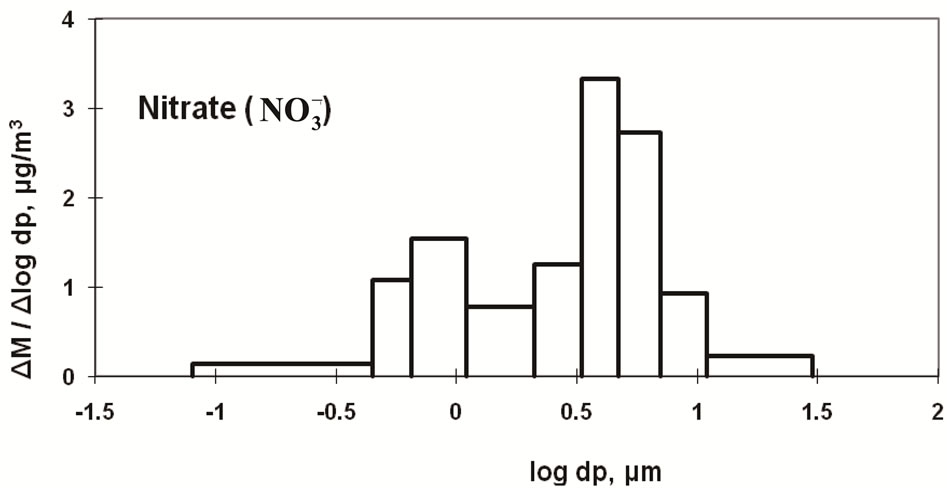
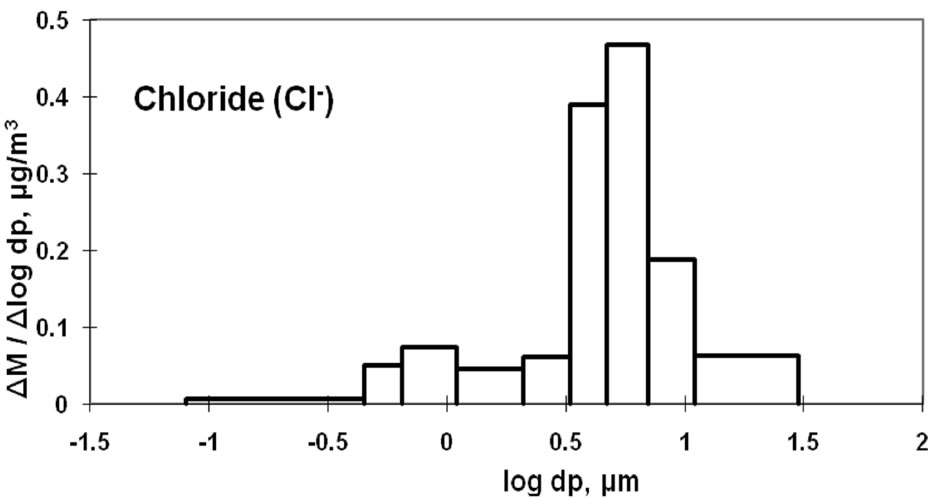

Figure 3. Size distribution of ambient Na+, Cl- and  at CESS, Saitama.
Nitrate can be formed as a secondary pollutant through photochemical reactions in the atmosphere [13-16]. Nitric acid may react with ammonia gas to form fine particles and may also react with NaCl to form coarse particles. In this study, nitrate is predominantly classified in the coarse particle range. Therefore, it can be concluded that NaNO3 was the major species in the sample, and NH4NO3 was present in lower amounts. Moreover, NH4NO3 and NH4Cl are known to be volatile under ambient temperature [10,14].
The dominance of NaNO3 could be caused by the evaporation of NH4NO3 due to the moderate temperature (20˚C - 25˚C during the day) at the time of sample collection.
3.3. Characteristics of Sulfate, Ammonium, and Calcium
Figure 4 shows the size distribution of atmospheric  and
and .
.  shows a monomodal distribution with
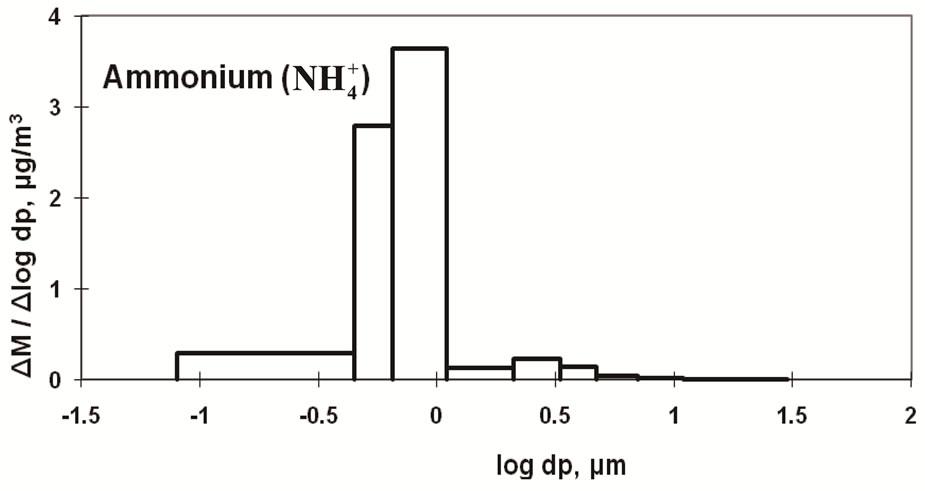
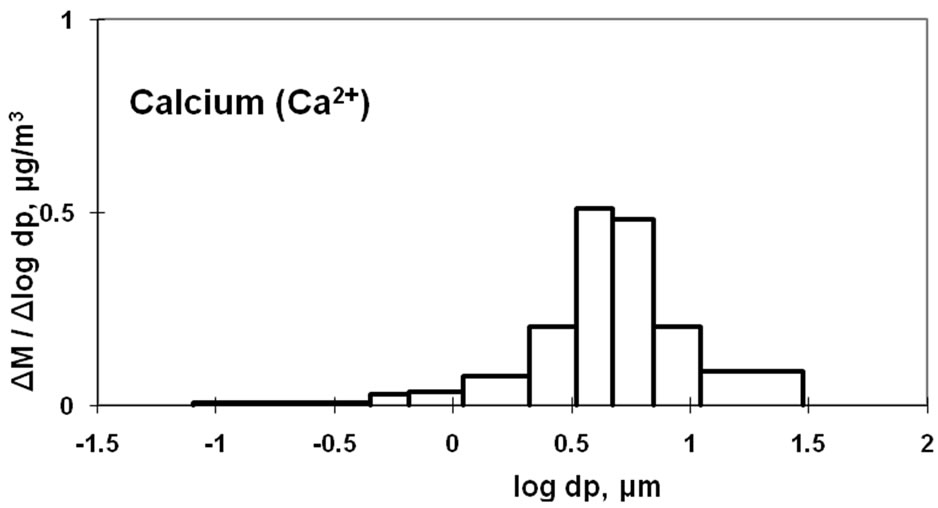
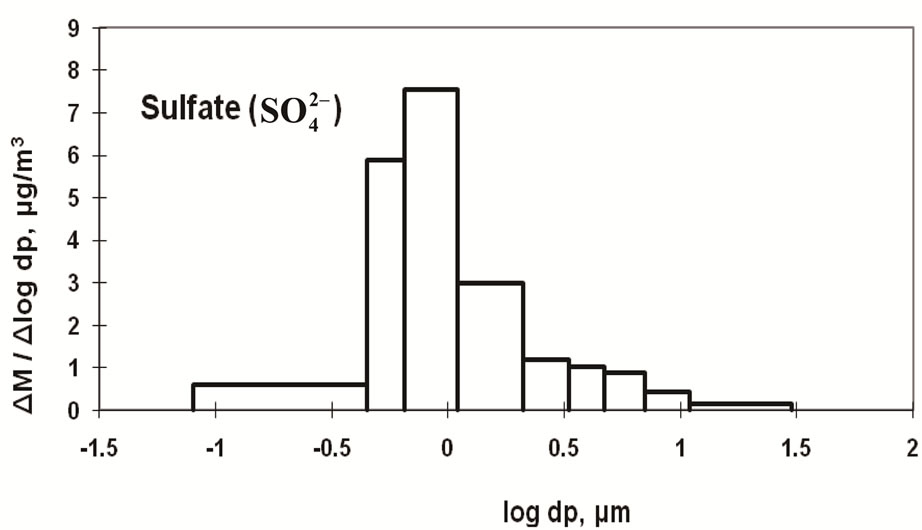
Figure 4. Size distribution of ambient , Ca2+ and
  at CESS, Saitama.
a strong peak in the fine particle range accompanied by a slight shoulder in the coarse particle range. Sulfate is commonly formed by a slight shoulder in the coarse particle range. Sulfate is commonly formed by the gas-toparticle conversion of SO2 through photochemical reactions [17,18]. Thus, the main peak falls in the fine particle range. The slight shoulder in the coarse particle range could be explained if some sulfate is derived from sea salt and soil [19].
The monomodal size distribution of  shown in Figure 4 has a sharp peak at approximately 0.5 μm, similar to that of
  in the fine particle range. This could imply that
  exists as a counter ion to
 . Ammonia and sulfuric acid will form ammonium sulfate or ammonium bisulfate, which are stable in ambient air and have a long life [15,20].
Figure 4 also shows the size distribution of Ca2+, which has a strong peak in the coarse particle range. Ca2+ concentration was found to be at a relatively high level, next to Na+, in the coarse particle range. This may be attributed to the counter ion of sulfate in the coarse particle range because CaSO4 would be derived from sea salt and soil. Calcium carbonate derived from soil could be a source of Ca2+ in the coarse particle range. Previous studies have shown that Ca2+ is more abundant in coarse particles during dust storms [21].
3.4. Characteristics of Magnesium and Potassium
Mg2+ and K+ distributions are shown in Figure 5. The magnesium particulates are mainly derived from sea salt [9,10]. The monomodal distribution with a peak in the coarse particle range is similar to the Na+ distribution shown in Figure 3.
Some K+ may be produced by the incineration of plant derivatives, such as paper, wood, and vegetable garbage, which would cause fine particle aerosols. Some studies have shown that K+ in aerosols can result from biomass burning [22,23]. Potassium can also originate from sea salt and soil and would fall into the coarse particle range. These two sources result in two size distribution peaks for atmospheric potassium, as shown in Figure 5.
3.5. Summarizing Characteristics of Chemical Components
Figure 6 shows the ionic balances between the aerosol components from the Andersen sampler stages. The average ratios of total cation equivalence to total anion equivalence were calculated as 1.08 and 1.16 for coarse and fine particles, respectively. That is, a small cation
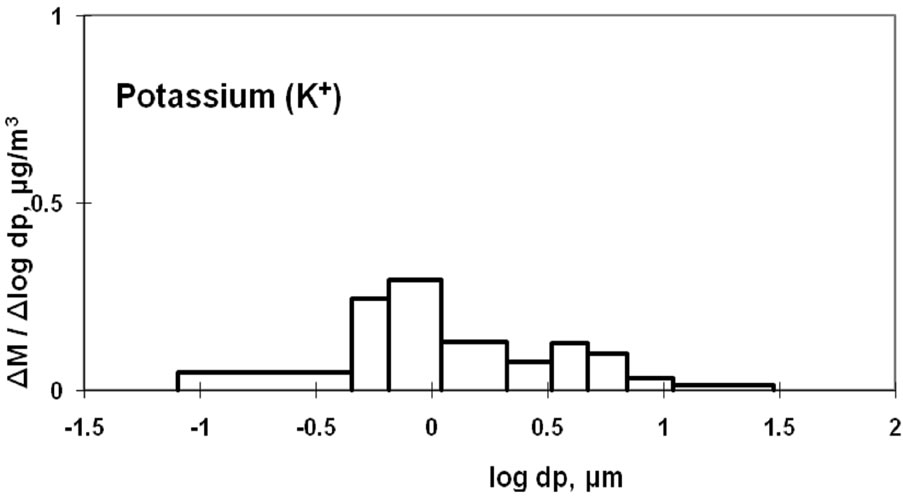
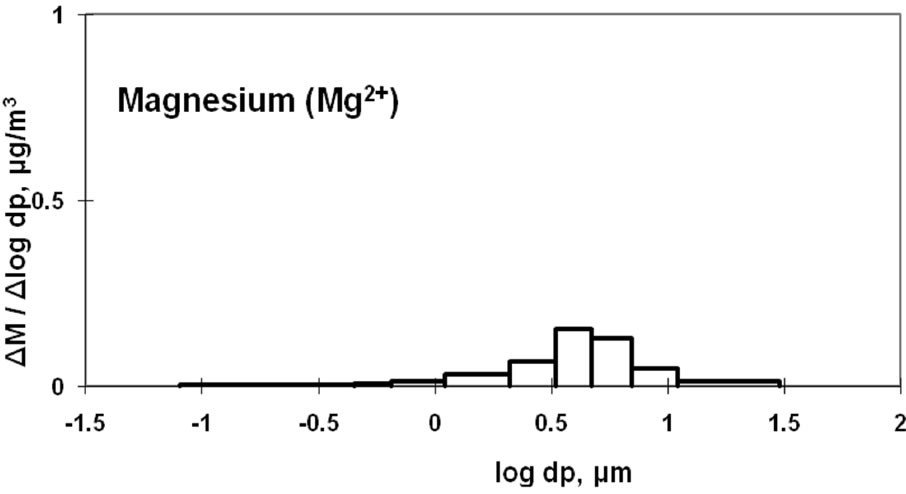
Figure 5. Size distribution of ambient K+ and Mg2+ at CESS, saitama.
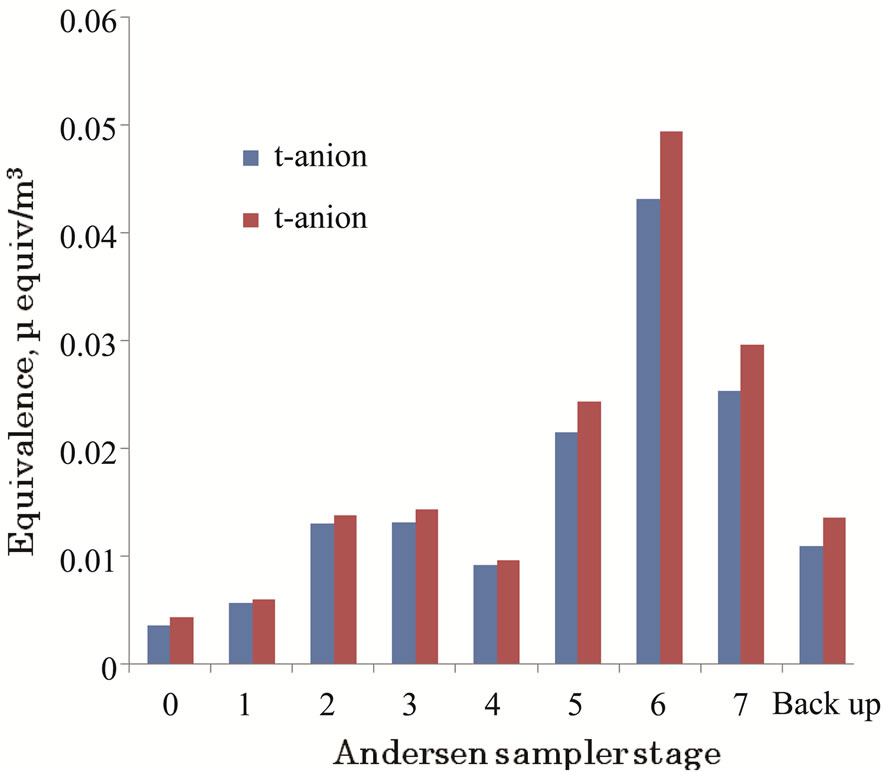
Figure 6. Comparison of total anion and cation equivalences in the particulates by andersen sampler stage.
rich trend was observed; however, this is considered an acceptable coincidence between ion balances in both particle ranges. In the coarse particle range, the contribution of unevaluated carbonate ions may be a factor in the cation rich calculation. Ionic balances would be improved by evaluating organic hydrocarbon acids, which were not analyzed in the fine particle range.
The orders of the ionic compounds were  >
>  >
>  in the fine particle range and
  >
>  > Na+ in the coarse particle range. Sulfate was the predominant ion and occupied approximately 45% of the total mass concentration of the eight ionic compounds, followed by nitrate (22%) and ammonium (19%).
Overall, the results of this study are acceptable in comparison with those of previous research [18-23].
4. Conclusions
Size distributions of atmospheric aerosol components in a suburban area of Tokyo, Japan were investigated using an Andersen sampler.
Significant amounts of Na+ and Cl− were considered to be derived from sea salt. The difference between the Na+/Cl− ratio in the coarse particles and that in sea salt indicated a considerable loss of Cl−. We concluded that this was caused by the formation of NaNO3, which is the main nitrate species present. Moreover, NH4NO3 was estimated to be in the fine particle range.
The size distribution of  had a sharp monomodal peak in the fine particle range, which is similar to that of sulfate. Most of the sulfate is considered to be ammonium sulfate or ammonium bisulfate. The size distribution of Ca was found to have a strong peak in the coarse particle range. Ca is considered to be a main counter ion of
  in the coarse particle range.
Mg is considered to be derived primarily from sea salt and soil and has a peak in the coarse particle range. Some K will originate from sea salt and will also be produced by the incineration of plant derivatives. These two sources most likely caused the two peaks in the size distribution of K.
5. Acknowledgements
We greatly appreciate the research members of the Center for Environmental Science at Saitama for their enthusiastic supporting our research activities with respect to the collection, the analysis and the interpretation of ambient aerosols in Saitama, Japan.
This report is an outcome of the program supported by 2005 World Exposition, Aichi, Japan and implemented by International Center for Environmental Technology Transfer (ICETT). We are also thankful to their foundations.
REFERENCES
- C. A. Belis, F. Karagulian, B. R. Larsen and P. K. Hopke, “Critical Review and Meta-Analysis of Ambient Particulate Matter Source Apportionment Using Receptor Models in Europe,” Atmospheric Environment, Vol. 69, 2013, pp. 94-108. doi:10.1016/j.atmosenv.2012.11.009
- E. Cuccia, D. Massabò and V. Ariola, “Size-Resolved Comprehensive Characterization of Airborne Particulate Matter,” Atmospheric Environment, Vol. 67, 2013, pp. 14-26. doi:10.1016/j.atmosenv.2012.10.045
- A. Pietrodangelo, R. Salzano, E. Rantica and C. Perrino, “Characterisation of the Local Topsoil Contribution to Airborne Particulate Matter in the Area of Rome (Italy),” Source Profiles,” Atmospheric Environment, Vol. 69, 2013, pp. 1-14. doi:10.1016/j.atmosenv.2012.11.059
- G. Xiu, D. Zhang, J. Chen and X. Huang, “Characterization of Major Water-Soluble Inorganic Ions in Size-Fractionated Particulate Matters in Shanghai Campus Ambient Air,” Atmospheric Environment, Vol. 38, No. 2, 2004, pp. 227-236. doi:10.1016/j.atmosenv.2003.09.053
- G. Sarwar, K. Fahey, R. Kwok and R. C. Gilliam, “Potential Impacts of two SO2 Oxidation Pathways on Regional Sulfate Concentrations-Aqueous-phase Oxidation by NO2 and Gas-phase Oxidation by Stabilized Criegee Intermediates,” Atmospheric Environment, Vol. 68, 2013, pp. 186-197. doi:10.1016/j.atmosenv.2012.11.036
- A. C. Rohr and R. E. Wyzga, “Attributing Health Effects to Individual Particulate Matter Constituents,” Atmospheric Environment, Vol. 62, 2012, pp. 130-152. doi:10.1016/j.atmosenv.2012.07.036
- B. Brunekreef and B. Forsberg, “Epidemiological Evidence of Effects of Coarse Airborne Particles on Health,” European Respiratory Journal, Vol. 26, No. 2, 2005, pp. 309-318. doi:10.1183/09031936.05.00001805
- R. J. Delfino, C. Sioutas and S. Malik, “Potential Role of Ultrafine Particles in Associations between Airborne Particle Mass and Cardiovascular Health,” Environmental Health Perspectives, Vol. 113, No. 8, 2005, pp. 934-946. doi:10.1289/ehp.7938
- K. Yoshizumi, Y. Ishibashi, H. Garivait and M. S. Tabucanon, “Size Distributions and Chemical Composition of Atmospheric Aerosols in a Suburb of Bangkok, Thailand,” Environmental Technology, Vol. 17, No. 7, 1996, pp. 777-782. doi:10.1080/09593331708616445
- K. Yoshizumi and K. Asakuno, “Characterization of Atmospheric Aerosols in Chichi of the Ogasawara (Bonin) Islands,” Atmospheric Environment, Vol. 20, No. 1, 1986, pp. 151-155. doi:10.1016/0004-6981(86)90216-7
- R. C. Robbins, R. D. Cadle and D. L. Eckhardt, “The Conversion of Sodium Chloride to Hydrogen Chloride in the Atmosphere,” Journal of Meteorology, Vol. 16, No. 1, 1959, pp. 53-56. doi:10.1175/1520-0469(1959)016<0053:TCOSCT>2.0.CO;2
- R. A. Kotchenruther, “A Regional Assessment of Marine Vessel PM2.5Impacts in the U.S. Pacific Northwest Using a Receptor-based Source Apportionment Method,” Atmospheric Environment, Vol. 68, 2013, pp. 103-111. doi:10.1016/j.atmosenv.2012.11.067
- M.-C. Cheng, C.-F. You, J. Cao and Z. Jin, “Spatial and Seasonal Variability of Water-soluble Ions in PM2.5 Aerosols in 14 Major Cities in China,” Atmospheric Environment, Vol. 60, 2012, pp. 182-192. doi:10.1016/j.atmosenv.2012.06.037
- M. A. Revuelta, R. M. Harrison, L. Núñez, F. J. GomezMoreno, M. Pujadas and B. Artíñano, “Comparison of Temporal Features of Sulphate and Nitrate at Urban and Rural Sites in Spain and the UK,” Atmospheric Environment, Vol. 60, 2012, pp. 383-391. doi:10.1016/j.atmosenv.2012.07.004
- M. F. D. Gianini, R. Gehrig, A. Fischer, A. Ulrich, A. Wichser and C. Hueglin, “Chemical Composition of PM10 in Switzerland—An Analysis for 2008/2009 and Changes since 1998/1999,” Atmospheric Environment, Vol. 54, 2012, pp. 97-106. doi:10.1016/j.atmosenv.2012.02.037
- D. E. Millstein, R. A. Harley and S. V. Hering, “Weekly Cycles in Fine Particulate Nitrate,” Atmospheric Environment, Vol. 42, No. 4, 2008, pp. 632-641. doi:10.1016/j.atmosenv.2007.10.010
- K. Anlauf, S.-M. Li, R. Leaitch and J. Brook, “Ionic Composition and Size Characteristics of Particles in the Lower Fraser ValleyPacific 2001 Field Study,” Atmospheric Environment, Vol. 40, 2006, pp. 2662-2675. doi:10.1016/j.atmosenv.2005.12.027
- M. I. Khoder and S. K. Hassan, “Weekday/Weekend Differences in Ambient Aerosol Level and Chemical Characteristics of Water-soluble Components in the City Centre,” Atmospheric Environment, Vol. 42, No. 32, 2008, pp. 7483-7493. doi:10.1016/j.atmosenv.2008.05.068
- T. A. Pakkanen, K. Loukkola, C. H. Korhonen and M. Aurela, “Sources and Chemical Composition of Atmospheric Fine and Coarse Particles in the Helsinki Area,” Atmospheric Environment, Vol. 35, No. 32, 2001, pp. 5381-5391. doi:10.1016/S1352-2310(01)00307-7
- S. K. Pandey, B. D. Tripathi, V. K. Mishra and S. K. Prajapati, “Size Fractionated Speciation of Nitrate and Sulfate Aerosols in a Sub-tropical Industrial Environment,” Chemosphere, Vol. 63, No. 1, 2006, pp. 49-57. doi:10.1016/j.chemosphere.2005.07.035
- Z. Shen, J. Cao, R. Arimoto, Z. Han, R. Zhang, Y. Han, S. Liu, T. Okuda, S. Nakaoand S. Tanaka, “Ionic Composition of TSP and PM2.5 during Dust Storms and Air Pollution Episodes at Xi’an, China,” Atmospheric Environment, Vol. 43, No. 18, 2009, pp. 2911-2918. doi:10.1016/j.atmosenv.2009.03.005
- F. Reisen, C. P. Meyer and M. D. Keywood, “Impact of Biomass Burning Sources on Seasonal Aerosol Air Quality,” Atmospheric Environment, Vol. 67, 2013, pp. 437- 447. doi:10.1016/j.atmosenv.2012.11.004
- S. Pateraki, T. Maggos, J. Michopoulos, H. A. Flocas, D. N. Asimakopoulos and C. Vasilakos, “Ions Species Size Distribution in Particulate Matter Associated with VOCs and Meteorological Conditions over an Urban Region,” Chemosphere, Vol. 72, No. 3, 2008, pp. 496-503. doi:10.1016/j.chemosphere.2008.02.061
NOTES
*Corresponding author.