Open Journal of Air Pollution
Vol.1 No.2(2012), Article ID:22746,9 pages DOI:10.4236/ojap.2012.12002
Light-Absorbing Products Form during the Aqueous Phase Reaction of Phenolic Compounds in the Presence of Nitrate and Nitrite with UV Illumination
Department of Chemistry & Biochemistry, Texas Tech University, Lubbock, USA
Email: jon.thompson@ttu.edu
Received June 1, 2012; revised July 5, 2012; accepted July 31, 2012
Keywords: Air Pollution; Biomass Burning; Nitration; Aerosol; Airborne Particulate Matter; Secondary Organic Aerosol
ABSTRACT
Phenolic compounds are emitted into earth’s atmosphere through industry and biomass burning events. These compounds may react in the gas or particle phase to form additional airborne pollutants. In this work, the aqueous phase chemical reactions of syringol, guaiacol, and catechol were studied in the presence of nitrate ( ) or nitrite (
 ) with and without UV illumination. The reactions were found to yield light absorbing products and electrospray ionization mass spectrometry (ESI-MS) experiments indicate some of the compounds formed may be the nitrated analogues of the starting organic compounds. However, infrared absorption data suggests the reaction products are composed of a complicated mixture. This suggests additional reactions occur simultaneously in solution. Treatment of the isolated reaction products with ozone (O3) suggest they are unstable and will eventually chemically decompose if/when formed in the atmosphere.
1. Introduction
Recent studies of secondary organic aerosols (SOA) estimate that the global budget of SOA is approx. 50 - 380 Tg·a–1[1]. A fraction of this aerosol is believed to be generated in aqueous phase reactions that occur in cloud water or fogs. These reactions may be another important route to the formation of SOA besides gas phase mechanisms. Consequently, this chemistry has drawn increased interest in recent years [2-8]. A very small fraction of the SOA consists of nitrated aromatic compounds. Some nitrated aromatics are mutagens and suspected carcinogens, and therefore these materials can impact human health if inhaled [9-12]. In addition, nitrated aromatics often appear yellow/brown color in solution, indicating these materials have the potential to affect transport of solar radiation in the atmosphere. Nitrated aromatic compounds present in atmospheric aerosols are believed to be partly responsible for an observed reduction of solar UV radiation in the Los Angeles area [13]. Consistent with this, more recent results have found the concentration of several nitrated phenols and benzoic acids (2-hydroxy-4- nitrophenol and 2-hydroxy-4-benzoic acid) show good correlation with observations of light absorption by water soluble organics in the LA basin aerosol [14]. Peaks corresponding to benzoic acid, nitrobenzoic acids, and hydroxynitrobenzoic acids have also been observed in Fresno, CA fog water by high resolution mass spectrometry measurements [15] providing some evidence the aqueous phase nitration of aromatic compounds may occur in earth’satmosphere.
Nitrate ( ) is sometimes present in atmospheric waters at a concentration >10–4 M [16]. When combined with other reactants and/or sunlight, nitrate might participate in a complex sequence of aromatic photooxdiation reactions and produce nitroaromatic compounds. In addition, nitrate is believed to be an important source of hydroxyl radical in the atmosphere through UV photolysis [17]:
 (1)
(1)
Nitrite ( ) is present in atmospheric water at an average concentration between 0.01 - 100 mM [18]. In some areas, such as the fog water from California’s Central Valley, the nitrite concentration can routinely reach 10–4 M [19]. Nitrite is also a source for hydroxyl radical in the atmosphere through photolysis [17]:
 (2)
(2)
In this work, the reaction of several aromatic compounds in the presence of nitrate and nitrite were studied under varying reaction conditions. For ease of chemical analysis, the concentration of nitrate, nitrite, and aromatic compounds used in this laboratory study were at substantially higher concentration than observed in earth’s atmosphere. We experiment here with syringol, guaiacol, and catechol, which are volatile organic products of biomass burning [20,21]. These compounds are potential precursors for the formation of nitrated organic aerosol in the atmosphere. These experiments aim to determine whether these materials react in aqueous solution when combined with nitrate or nitrite, better understand what products may form, and whether the products formed are chemically stable.
2. Experimental Methods
2.1. Reagents and Preparation of Reaction Solutions
Sryingol (Acros Organics, 99+%), catechol (Acros Organics, 99+%), guaiacol (Acros Organics, 99+%), 4-nitrophenol (Acros Organics, 98%), ammonium nitrate (Mallinckrodt, AR), sodium nitrite (Mallinckrodt, AR), H2O2 (CVS, 3% wt) were purchased from vendors and used without further purification. The reactions studied occurred in beakers using dilute sulfuric acid solution as solvent (pH = 4.5). This choice of pH was to mimic the pH of cloud water, which is often acidic because of dissolution of CO2 and oxides of sulfur and nitrogen. A total volume of 50 mL was used. Most reactions used 10 mM concentration for the organic test compound, 10 mM for , 100 mM for
 . Some reactions occurred under UV illumination with a mercury pen lamp (90-0004- 01 UVP). The lamp emitted the mercury spectrum. The lamp was placed directly on top of the reaction beaker with no surfaces between the lamp and the solution. This is significant since previous experiments housed the lamp within a Pyrex condenser in that attenuated the light— particularly below a wavelength of 300 nm.
2.2. UV-VIS Spectroscopy
The UV-VIS absorption measurements were taken by an Agilent 853 diode array spectrometer. A 1 cm quartz cuvette was used for measuring absorbance and the dilute sulfuric acid solution was used as the spectroscopic blank. The entire spectrum between 200 - 1100 nm was obtained at regular time intervals after a reaction started. Absorbance at 400 nm was recorded and used as metric of visible light absorption. For studying the chemical stability of the reaction products, we the isolated products and reacted them with ozone. The three test aromatic compounds were separately dissolved in presence of nitrite under UV radiation, and the resulting solution was dried after a 4-hour reaction time. Then the products were redissolved in pH = 4.5 sulfuric acid solution and air containing ozone was bubbled into the mixture. The spectrum in both the UV and visible region was recorded at several time intervals to assess whether any reaction occurred during addition of ozone.
2.3. Solid Phase Extraction (SPE) and Mass Spectrometry (MS) Measurements
Solid phase extraction was applied to reaction mixtures for mass spectrometry measurements. Reversed phase (C-8) sorbent cartridges (PrepSep 11-131-20, Fisher Scientific) were used for the process. The cartridge packing was first rinsed with 5 mL methanol and followed by a 5 mL rinse of deionized water. Then 5 mL of the reaction mixture was applied to the cartridge and 5 mL water was then used to wash ions or unbound substances. After the wash process, the organic components were eluted with 5 mL methanol into a microcentrifuge tube. The solution was then heated to dryness at 65˚C. A blank sample was prepared by using methanol instead of the reaction mixture from the extraction process. The MS measurement of the sample was conducted by electrospray ionization mass spectrometry (ESI-MS) through cooperation with the University of Illinois MS facility. Samples were dissolved in acetone and mixed with the ESI support solution which was 50% MeOH/50% H2O. Data was recorded on a Waters ZMD Quadrupole Instrument with unit mass resolution. Samples were measured in both positive and negative ion mode; however, the positive ion scan yielded low signal to noise ratios for our samples. The exact reason for this is unclear, and positive ion mode was not pursued further. For the negative ion mode measurement, cone voltage of 35 V was employed. It should be noted that intensity of the peaks observed in the ESI mass spectra are suitable for qualitative analysis and should not be used as a quantitative indicator of reactant and product concentrations.
2.4. Infrared (IR) Spectroscopy Measurements
A purged Nicolet Magna IR 550 spectrometer equipped with a KBr beam splitter and DTGS detector was applied for measuring the infrared spectra. The instrument was operated in autogain mode with 2 cm–1 resolution and the acquired data was between 4000 - 400 cm–1. To prepare samples, the three compounds were combined with nitrite under UV radiation. After 4 h of reaction, the mixtures were extracted using the SPE method described previously and eluted into acetone. The acetone extract was then deposited on an attenuated total reflectance (ATR) crystal. When the acetone evaporated, a thin film of the reaction material remained on the crystal to perform the IR measurement. Data was not corrected for differences in penetration depth. Ozone was generated from zero air applying a photolytic ozone generator and then added to a small chamber. The ATR crystal was placed in the chamber for treatment with ozone. The gasphase ozone concentration was continually monitored using a 2B Technologies ozone sensor.
3. Results and Discussion
3.1. Light Absorption by Reaction Products
Three organic test compounds (syringol, catechol and guaiacol) at 10 mM were reacted in 10 mM nitrite with ambient light, or 100 mM nitrate with UV illumination. After starting the reaction by adding the nitrite or nitrate + UV, most solutions turned a yellow-brown color several minutes after mixing. The color became darker with time.
Reaction mixtures were characterized by UV-VIS spectroscopy. Figure 1 confirms the visual observations as it demonstrates the visible absorption increases in time. In addition, the reactants and products have much stronger absorbance in UV range than visible range and present off scale signals when the full spectrum is considered. Only visible absorption (400 - 800 nm) is considered here. Enhanced absorption at blue wavelengths is observed. This is consistent with the yellow-brown color of the mixture. The insets are plots of absorbance at 400 nm over time from the start of the reaction for several compounds and different reaction conditions. The results suggest absorbance increases over the first four hours of the reaction for all experimental trials. It is clear that visible light absorbing products form during the reactions.
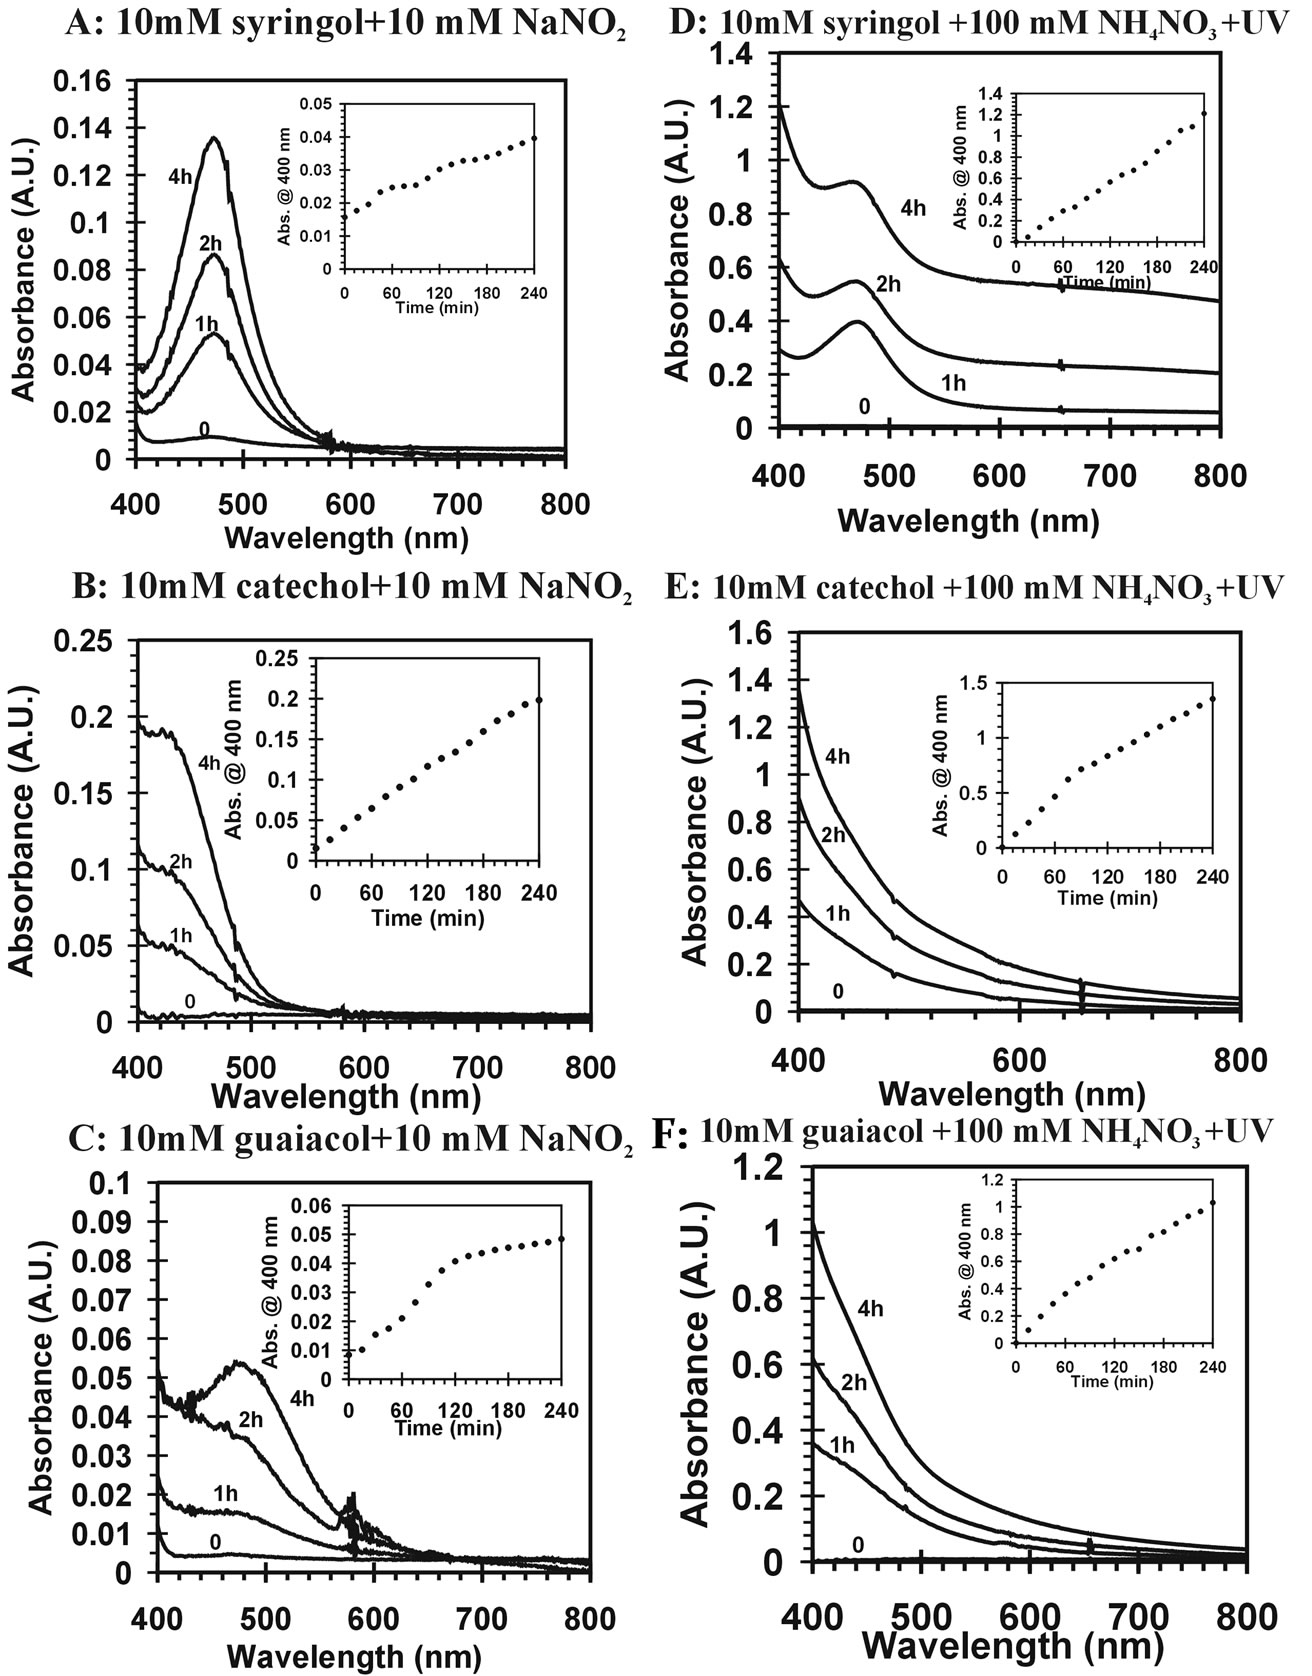
Figure 1. Visible absorption spectrum of yellow-brown products from different reaction mixtures in time. All the reactions used pH = 4.5 dilute, aqueous sulfuric acid as solvent. The insets are plots of the measured absorbance at 400 nm over time during the reactions. (A) 10 mM sryingol + 10 mM NaNO2; (B) catechol + 10 mM NaNO2; (C) 10 mM guaiacol + 10 mM NaNO2; (D) 10 mM sryingol + 100 mM NH4NO3 + UV; (E) 10 mM catechol + 100 mM NH4NO3 + UV; (F) 10 mM guaiacol + 100 mM NH4NO3 + UV.
It appears that nitrite ( ) can induce reactions at ambient light conditions as shown in plot A, B and C. The reactions between nitrate (
 ) and the aromatic test compounds at ambient lighting were also studied, but there was no color change observed for the reaction mixtures. We interpret this result as no visually detectable chemical reaction occurring for nitrate with test compounds under ambient lighting. However, reaction mixtures containing nitrate and the organic compounds that are exposed to UV radiation do exhibit rapid color changes, consistent with reactions occurring. Plots 1D, 1E, 1F illustrate this point. This could indicate production of NO2 or OH via nitrate photolysis (Rxn. 1), or alternatively, exposure to UV radiation is an important step for reactions to occur. When comparing visible absorption intensity of reaction mixtures, the nitrate + UV mixtures have 5 - 20 times higher absorbance than corresponding ambient light + nitrite trials. Careful examination of the VIS absorption spectra of Figure 1 also indicates the reaction products formed in the nitrite vs. nitrate trials may not be identical since the shapes of the spectra vary considerably. We can often observe a peak in the 450 - 480 nm range in the spectra for the nitrite trials, but the nitrate + UV trials often feature an exponentially decreasing absorption with increasing wavelength. The syringol + nitrate + UV trace seems to maintain an absorption peak near 480 nm superimposed on the gently sloping background. The clear differences in spectra indicate that reaction products/chemical composition of both reaction systems (nitrite vs. nitrate) are not identical. This could be the result of different chemical components being present or different concentrations of multiple light absorbing compounds. This appears to possibly be linked to use of nitrite vs. nitrate since a direct comparison of the nitrite reaction mixture with and without UV radiation (spectra shown in Figure 2) yields little difference in the spectral shape. However, Figure 2 shows that when UV radiation is present, optical absorption is 5 - 10 times larger and increases much more rapidly when compared to the ambient lighting case, so UV illumination is also important. Catechol was used as the test compound for the experiment shown in Figure 2. The reaction of these compounds with OH radical was studied previously (no nitrite or nitrate present), and colored products also formed [7]. A comparison of the spectra from this experiment and the previously published report yields some similarities. For instance, the reaction of syringol with OH radical in absence of nitrate/nitrite yielded reaction products with a peak in the 450 - 480 nm range. This peak also appears in these experiments for syringol. The previously reported spectrum is most similar to the case we report for nitrate here. The visible spectrum previously reported for guaiacol [7] exhibits a rapidly decaying trace with increasing wavelength. This is very similar to what was observed for the reaction car ried out in the presence of nitrate for these results. The net result of these experiments are: 1) Presence of UV light increases both the optical absorption of reaction mixtures and observed rate of color change; and 2) the chemical composition of the reaction mixtures appear to be different when nitrite vs. nitrate is present. Absorption peaks seem to be considerably sharper in the presence of nitrite. Additional chemical characterization of the reaction mixtures are needed to gain additional insight into the chemistry occurring.
3.2. Chemical Insights through Mass Spectrometry (MS) & Infrared Absorption (IR) Measurements
The UV-VIS spectra presented in the previous section establish light absorbing compounds form during the protocol, however, the identity of the reaction products are not known. In order to further characterize the reactions, mass spectrometry and infrared absorption was applied to gain insights to the composition of reaction mixtures. ESI-MS measurements were taken on the reaction mixtures after solid phase extraction in both positive and negative ion mode, however, only negative ion mode showed meaningful peaks under the conditions used. The ESI is a soft ionization approach and often employs deproto nated molecular ions for the negative ion mode. In our
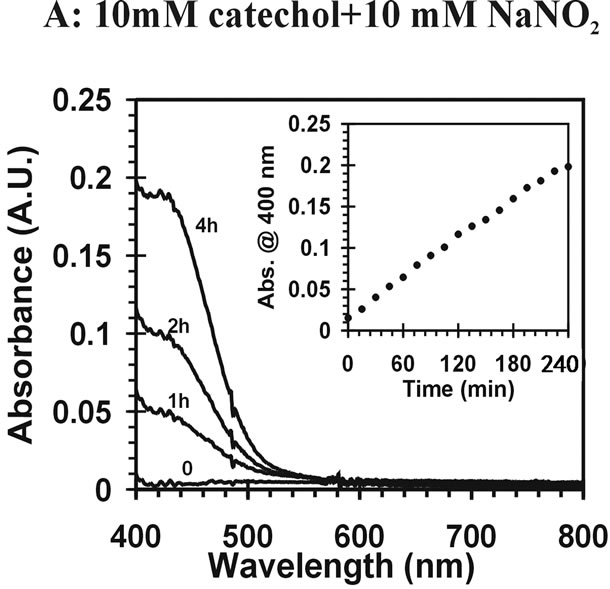
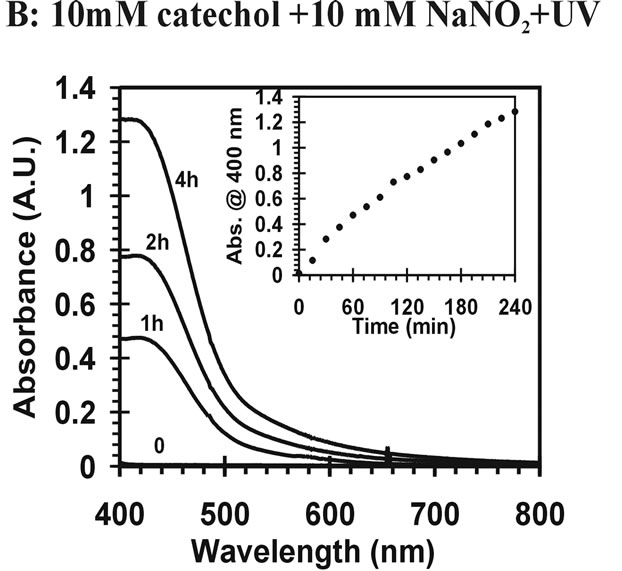
Figure 2 Visible absorption spectra for catechol reaction mixtures. (A) 10 mM catechol + 10 mM NaNO2; (B) 10 mM catechol + 10 mM NaNO2 +UV.
experiments, we are assuming singly charged ions were formed and the peaks correspond to deprotonated (M-1) ions. Mass spectra were taken for blanks, and no significant interference peaks were found. Figure 3 demonstrates low mass resolution (≈1 Da) ESI-MS scans of the reaction products for the three different aromatic test compounds and reaction conditions. Table 1 lists the m/z values for the largest peaks observed in the spectra. All the reactions used pH = 4.5 sulfuric acid as solvent and reaction time was 4 h.
Plots A and B shows the MS results of syringol reaction mixtures. The molecular weight of syringol is 154.1. The peaks at m/z = 198 in plot A and B would be consistent with an [M-H]− ion for nitrated syringol. In plot C and D for guaiacol (M.W. = 124 g/mol), there is no observation of a peak at m/z = 123. This may suggest no unreacted guaiacol remains. A peak at m/z = 168 may suggest the presence of nitroguaiacol in the reaction mixture. Plots D, E and F are results of catechol (M.W. = 110 g/mol) reactions under different conditions. Peaks at m/z = 109 may indicate the presence of catechol in the reaction mixture, but we note this peak was frequently observed in a variety of reaction mixtures. The peak at m/z = 154 would be consistent with nitrated catechol and the peak at m/z = 138 could correspond to a nitrated catechol minus one oxygen atom. One limitation to this analysis is that definitive molecular formula cannot be determined with low resolution mass analysis. While peaks we observe are consistent with the suggested products, the peaks could arise from a significant number of other possible combinations of C, H, O, and N atoms. Nonetheless, the minor peaks in the mass spectra and small peaks listed in Table 1 support the idea the chemistry occurring when nitrate and nitrite are present may not be exactly identical, but the formation of nitrated versions of the parent organic compound seems likely based on the data.
Figure 3. Negative ion mode mass spectra for reaction products. Conditions: (a) 10 mM syringol + 10 mM NaNO2; (b) 10 mM syringol + 100 mM NH4NO3 + UV; (c) 10 mM guaiacol + 10 mM NaNO2; (d) 10 mM guaiacol + 00 mM NH4NO3 + UV; (e) catechol + 10 mM NaNO2; (f) 10 mM catechol + 100 mM NH4NO3 + UV; (g) 10 mM catechol + 10 mM NaNO2 + UV.
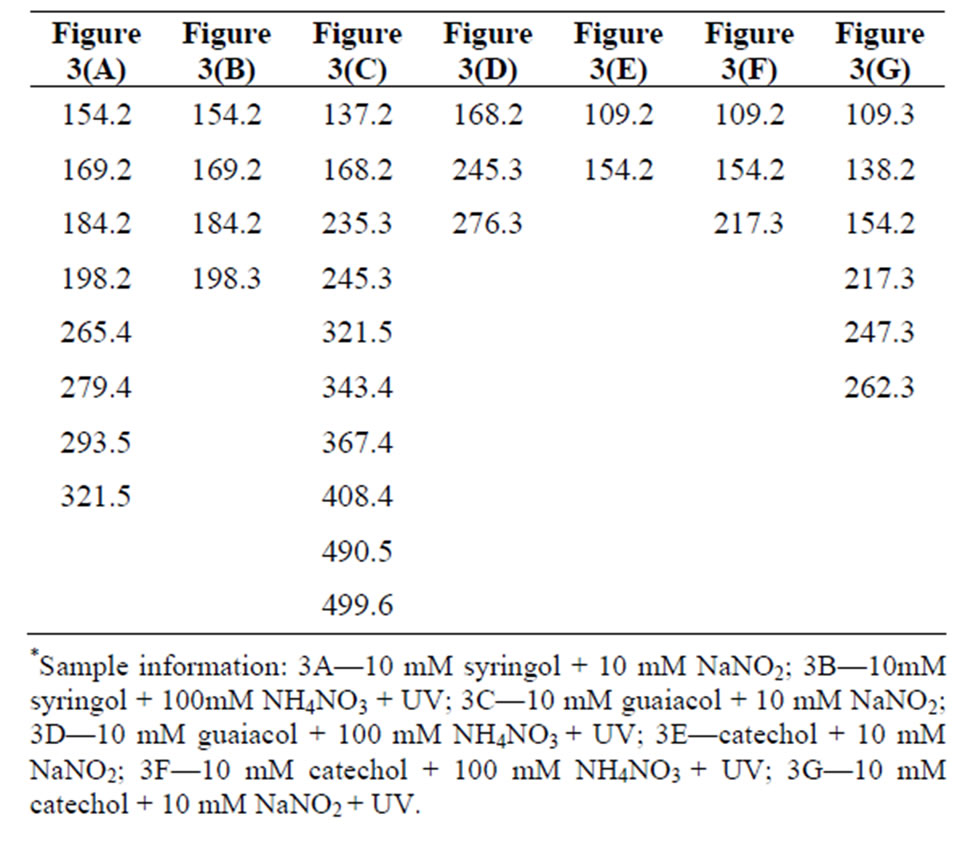
Table 1. Mass-to-charge ratios (m/z) of the most significant peaks for the reaction products. Data presented in Figure 3.
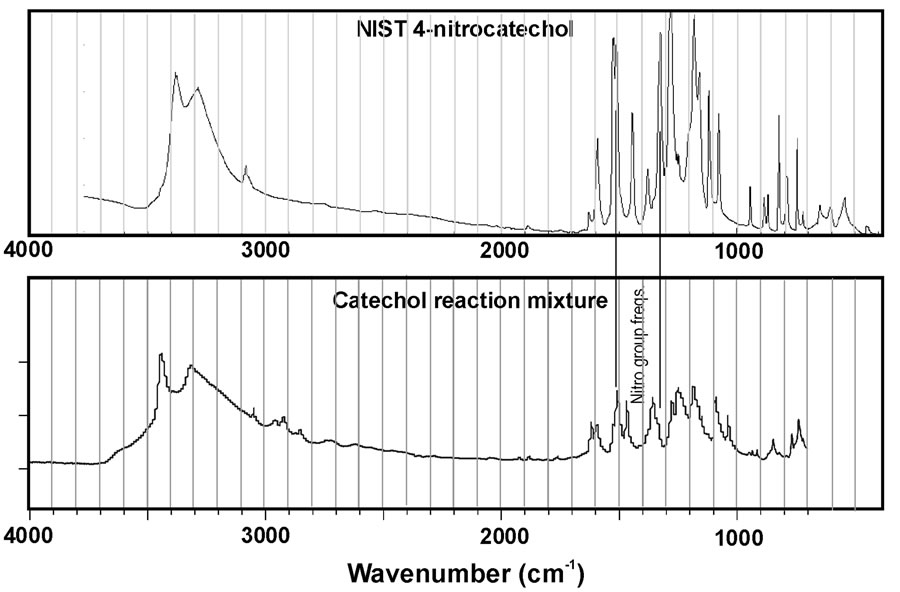
This limitation is particularly important given the results of Figure 4. This figure represents IR spectra collected for the reaction mixtures for catechol and guaiacol after evaporation of the sample onto an ATR plate. In addition, reference spectra for nitrocatechol and nitroguaiacol (obtained from NIST WebBook) are plotted for comparison. At first glance, it is obvious an exact match between the spectra for reaction mixtures and reference compounds was not observed. This suggests the reaction products are likely a mixture rather than a pure substance. Nitro group peaks near 1300 and 1530 cm–1 are noted in the reference spectra, but peaks at the corresponding wavenumbers do not always clearly appear in the spectra for reaction mixtures. However, the peaks may be obscured by neighboring peaks. Previous work in our group demonstrated phenolic compounds react with H2O2 under UV light to form a complicated mixture of products, some of which are higher molecular weight oligomers [7]. So it is not surprising that we observe a mixture in these experiments. The mass spectra presented in Figure 3 suggest high molecular weight products do not form in appreciable amounts for catechol, but we can observe small peaks in the 300 - 400 a.m.u. m/z windows for syringol and guaiacol reaction mixtures. This may suggest these compounds are particularly susceptible to these reactions that can double or triple the original molecular weight. However, the mass spectra observed in this work demonstrate different peaks from Ref. 7 suggesting the products are not identical.
The net result of this analysis is that it appears the reactions produce a mixture of products. Addition of –OH groups with associated shifts in mass spectra of 16 a.m.u. seem to occur relatively frequently. Nitration of aromatic rings may also occur since peaks shifted by 45 a.m.u.
 (a)
(a)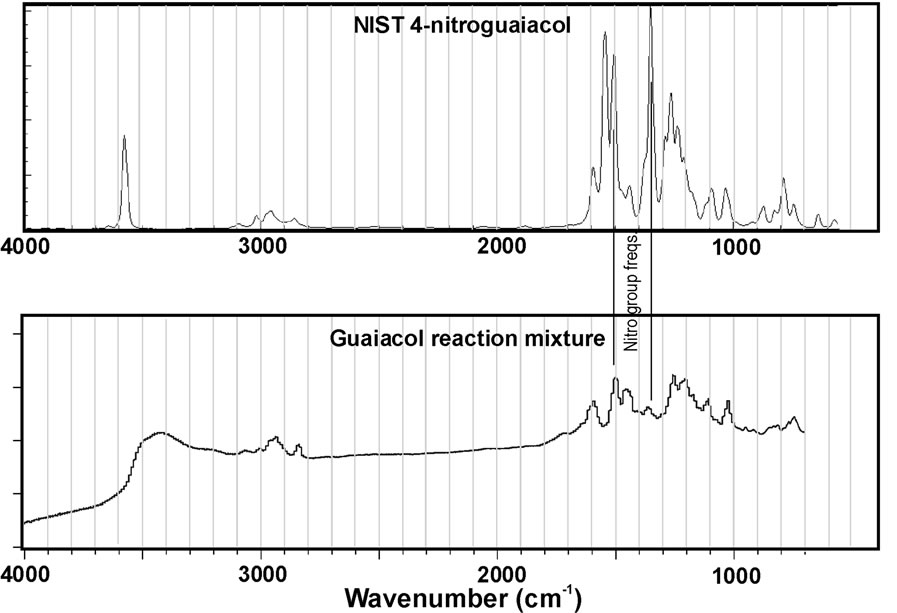 (b)
(b)
Figure 4. IR spectra of reaction mixtures compared to authentic standards for (a) nitrocatechol and (b) nitroguaiacol. Data for the standards is from the NIST WebBook.
were commonly observed, but the IR results were not definitive. However, this could result from other compounds in the mixture obscuring the nitro group peaks in the IR spectra. The largest product peaks in the MS data are consistent with the nitro group addition. The apparent contradiction between the IR and MS data may be resolved by considering addition of the nitro group makes the phenolic substance more acidic (easier to lose H+), and easier to deprotonate and form the [M-H]− ion. Perhaps this is why we see a relatively large peak in the negative ESI-MS data for the nitrated compound, but few other product peaks.
3.3. Ozone Treatment for the Reaction Products
An additional interest is to determine how reactive the reaction products are to atmospheric chemical processing. In other words, if these compounds form in the atmosphere, are they chemically stable? Ozone is a powerful and ubiquitous oxidant in the atmosphere and may react with different kinds of organic compounds. To study the reactivity of the products we ran reactions for the three test aromatic compounds with nitrite under UV radiation. We studied the reaction of O3 with the isolates both in a thin-film (solid phase, IR measurements) and in aqueous phase (UV-VIS measurements).
For the IR measurements, the acetone solution was deposited onto an ATR crystal and the reaction products remained after acetone evaporated. IR spectroscopy was used to monitor the progress of any reactions during treatment by gas-phase ozone. Figure 5 is the IR absorbance of reaction products with ozone treatment for different time intervals and different ozone concentrations. The low ozone concentration is the range of 50 - 100 ppbv and high concentration was roughly 200 - 250 ppbv. Careful considerations of the IR spectra illustrate small changes during the first two hours of ozone treatment at low concentrations. As observed, the spectra of low concentration ozone treatments are overlapped with the one without ozone treatment. However, large changes in the spectra are noted within 30 min. reaction time at high ozone concentrations. This indicates the material produced in the aromatic compound + nitrite + UV reactions is not stable and will likely degrade in the atmosphere.
For the aqueous phase measurements, the ozone gas was diffused into the reaction products solution at a moderate flow rate, and small bubbles could be observed. Both high and low concentrations of ozone were used. The estimated low concentration was of 50 - 100 ppbv and high concentration was about 200 - 250 ppm in the gasphase. Figure 6 is the UV-VIS absorption spectrum of the reaction mixtures with ozone treatment for different time intervals and different ozone concentrations. When
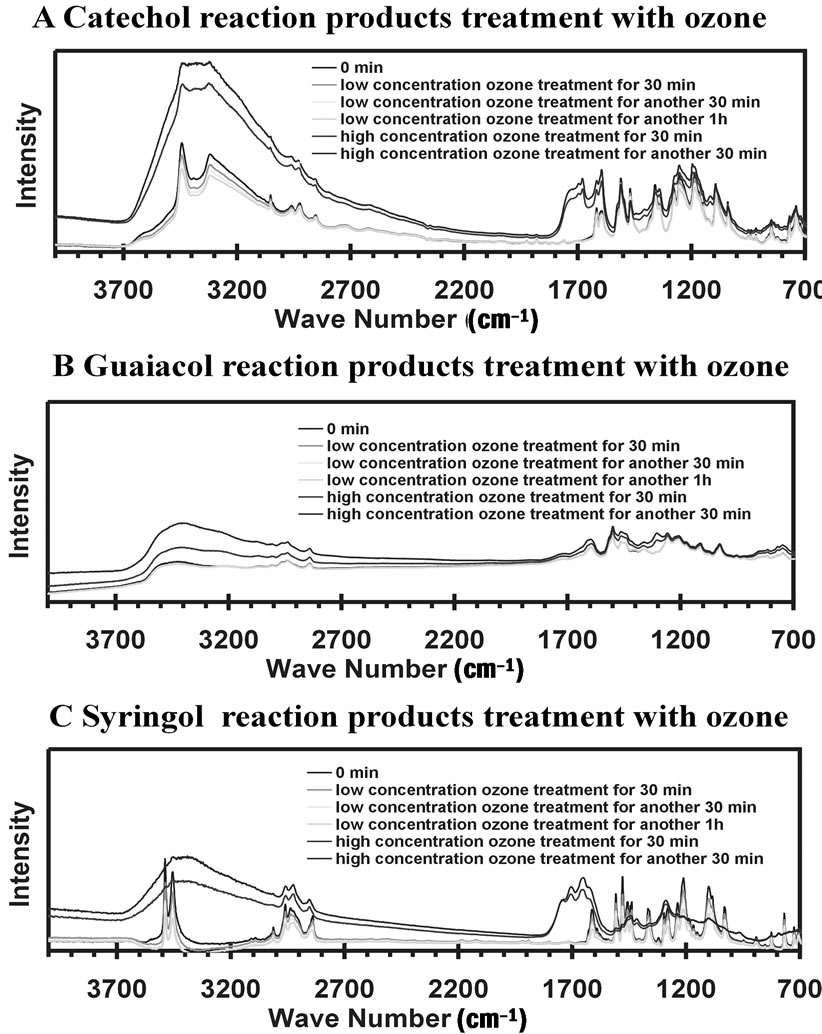
Figure 5. IR absorbance of reaction products when treated with ozone for different time intervals. The low concentration is the range of 50 - 100 ppbv and high concentration is about 200 - 250 ppbv.
treated with low concentration of ozone, the spectra generally did not change much and an obvious color change did not occur. It is shown that the spectra with low concentration ozone treatment were overlapped with each other. However, when the ozone concentration increased the spectra rapidly changed indicating a chemical reaction occurred. Interestingly, the spectral data suggests the color faded for the catechol and guaiacol reaction solutions, but the syringol solution optical depth increased during ozone treatment. The color fading might be expected since degradation of aromatics, such as cresols have been observed through ozone treatment [22]. Destruction of the aromatic ring would shift light absorption to deeper UV wavelengths and a reduction of visually perceived color would occur. The fact syringol exhibits the opposite trend is noteworthy and this system warrants additional investigation.
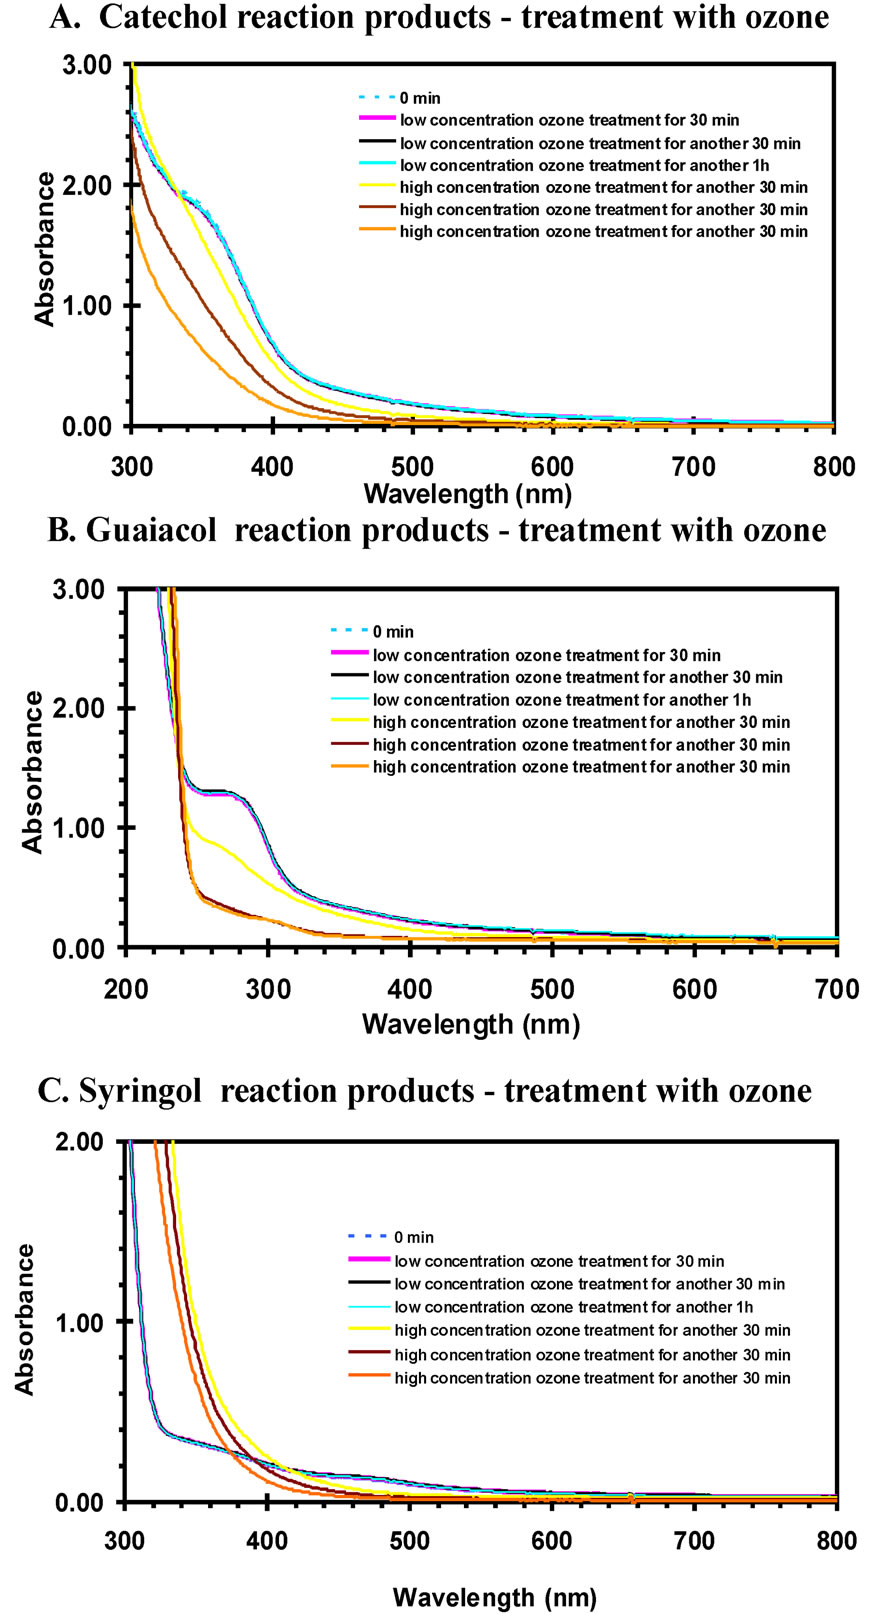
Figure 6. UV-VIS spectra of reaction products when treated with ozone for different time intervals. The low concentration is the range of 50 - 100 ppbv and high concentration is about 200 - 250 ppbv.
4. Conclusion
The test phenolic compounds in this study were found to form yellow-brown colored products when reacting in the presence of nitrate or nitrite and UV radiation in the aqueous phase. If present in cloud water, these compounds may enhance the absorption of solar radiation in the atmosphere. The ESI-MS experiments strongly suggest nitrated products may form during the reactions, although this is not definitive at low mass resolution. UV-VIS spectra suggest the composition of the reaction mixtures may differ when nitrite is present compared to nitrate. Collected UV-VIS spectra for reaction mixtures in the presence of nitrate appear similar to results previously published in the absence of nitrate. However, MS data suggest different products are present. Both IR and UVVIS experiments suggest the products of these reactions are reactive towards ozone, suggesting they may eventually chemically degrade in the atmosphere if not removed by other processes first.
5. Acknowledgements
The authors would like to thank the State of Texas/Texas Tech University for financially supporting this work. Also, the University of Illinois MS facility provided rapid results and helpful discussions.
REFERENCES
- D. V. Spracklen, J. L. Jimenez, K. S. Carslaw, D. R. Worsnop, M. J. Evans, G. Mann, Q. Zhang, M. R. Canagaratna, J. Allan, H. Coe, G. McFiggans, A. Rap and P. Forster, “Aerosol Mass Spectrometer Constraint on the Global Secondary Organic Aerosol Budget,” Atmospheric Chemistry and Physics, Vol. 11, 2011, pp. 12109-12136. doi:10.5194/acp-11-12109-2011
- B. Graham, O. L. Mayol-Bracero, P. Guyon, G. C. Roberts, S. Decesari, M. C. Facchini, P. Artaxo, W. Maenhaut, P. Köll and M. O. Andreae, “Water-Soluble Organic Compounds in Biomass Burning Aerosols over Amazonia 1. Characterization by NMR and GC-MS,” Journal of Geophysical Research, Vol. 107, No. 8047, 2002, 16 p. doi:10.1029/2001JD000336
- A. Gelencser, A. Hoffer, G. Kiss, E. Tombacz, R. Kurdi and L. Bencze, “In-Situ Formation of Light Absorbing Organic Matter in Cloud Water,” Journal of Atmospheric Chemistry, Vol. 45, No. 1, 2003, pp. 25-33. doi:10.1023/A:1024060428172
- A. Hoffer, G. Kiss, M. Blazsó and A. Gelencsér, “Chemical Characterization of Humic-Like Substances (HULIS) Formed from a Lignin-Type Precursor in Model Cloud Water,” Geophysical Research Letters, Vol. 31, 2004, Article ID: L06115. doi:10.1029/2003GL018962
- D. O. De Haan, A. L. Corrigan, K. W. Smith, D. R. Stroik, J. T. Turley, F. E. Lee, M. A. Tolbert, J. L. Jimenez, K. E. Cordova and G. R. Ferrell, “Secondary Organic AerosolForming Reactions of Glyoxal with Amino Acids,” Environmental Science & Technology, Vol. 43, No. 8, 2009, pp. 2818-2824. doi:10.1021/es803534f
- D. L. Bones, D. K. Henricksen, S. A. Mang, M. Gonsior, A. P. Bateman, T. B. Nguyen, W. J. Cooper and S. A. Nizkorodov, “Appearance of Strong Absorbers and Fluorophores in Limonene-O3 Secondary Organic Aerosol due to NH4+ Mediated Chemical Aging over Long Time Scales,” Journal of Geophysical Research, Vol. 115, 2010, Article ID: D05203. doi:10.1029/2009JD012864
- J. L. Chang and J. E. Thompson, “Characterization of Colored Oligomeric Products Formed during Irradiation of Aqueous Solutions Containing H2O2 and Phenolic Compounds,” Atmospheric Environment, Vol. 44, No. 4, 2010, pp. 541-551. doi:10.1016/j.atmosenv.2009.10.042
- Y. Liu, T. Tritscher, A. P. Praplan, P. F. DeCarlo, B. Temime-Roussel, E. Quivet, N. Marchand, J. Dommen, U. Baltensperger and A. Monod, “Aqueous Phase Processing of Secondary Organic Aerosols,” Atmospheric Environment, Vol. 11, 2011, pp. 21489-21532. doi:10.5194/acpd-11-21489-2011
- H. Tokiwa and Y. Ohnishi, “Mutagenicity and Carcinogenicity of Nitroarenes and Their Sources in the Environment,” CRC Critical Reviews in Toxicology, Vol. 17, No. 1, 1986, pp. 23-60. doi:10.3109/10408448609037070
- WHO, “World Health Statistics Annual,” World Health Organization, Geneva, 1995.
- T. Enya and H. Suzuki, “3-Nitrobenzanthrone, a Powerful Bacterial Mutagen and Suspected Human Carcinogen Found in Diesel Exhaust and Airborne Particulates,” Environmental Science & Technology, Vol. 31, No. 10, 1997, pp. 2772-2776. doi:10.1021/es961067i
- K. Bekki, H. Takigami, G. Suzuki, N. Tang and K. Hayakawa, “Evaluation of Toxic Activities of Polycyclic Aromatic Hydrocarbon Derivatives Using in Vitro Bioassays,” Journal of Health Science, Vol. 55, No. 4, 2009, pp. 601- 610. doi:10.1248/jhs.55.601
- M. Z. Jacobson, “Isolating Nitrated and Aromatic Aerosols and Nitrated Aromatic Gases as Sources of Ultraviolet Light Absorption,” Journal of Geophysical Research, Vol. 104, No. D3, 1999, pp. 3527-3542. doi:10.1029/1998JD100054
- X. Zhang, Y. H. Lin, J. D. Surratt, P. Zotter, A. S. H. Prevot and R. J. Weber, “Light-Absorbing Soluble Organic Aerosol in Los Angeles and Atlanta: A Contrast in Secondary Organic Aerosol,” Geophysical Research Letters, Vol. 38, 2011, Article ID: L21810. doi:10.1029/2011GL049385
- L. R. Mazzoleni, B. M. Ehrmann, X. Shen, A. G. Marshall and J. L. Collett, “Water-Soluble Atmospheric Organic Matter in Fog: Exact Masses and Chemical Formula Identification by Ultrahigh-Resolution Fourier Transform Ion Cyclotron Resonance Mass Spectrometry,” Environmental Science & Technology, Vol. 44, No. 10, 2010, pp. 3690-3697. doi:10.1021/es903409k
- K. L. Hayden, A. M. Macdonald, W. Gong, D. Toom-Sauntry, K. G. Anlauf, A. Leithead, S.-M. Li, W. R. Leaitch and K. Noone, “Cloud Processing of Nitrate,” Journal of Geophysical Research, Vol. 113, 2003, Article ID: D18201. doi:10.1029/2007JD009732
- D. Vione, V. Maurino, C. Minero, E. Pelizzetti, M. A. J. Harrison, R. I. Olariuc and C. Arsene, “Photochemical Reactions in the Tropospheric Aqueous Phase and on Particulate Matter,” Chemical Society Reviews, Vol. 35, No. 5, 2006, pp. 441-453.
- G. Lammel and J. N. Cape, “Nitrous Acid and Nitrite in the Atmosphere,” Chemical Society Reviews, Vol. 25, No. 5, 1996, pp. 361-369. doi:10.1039/cs9962500361
- C. Anastasio and K. G. McGregor, “Chemistry of Fog Waters in California’s Central Valley: 1. In Situ Photoformation of Hydroxyl Radical and Singlet Molecular Oxygen,” Atmospheric Environment, Vol. 35, No. 6, 2001, pp. 1079-1089. doi:10.1016/S1352-2310(00)00281-8
- W. F. Rogge, L. M. Hildemann, M. A. Mazurek, G. R. Cass and B. R. T. Simoneit, “Sources of Fine Organic Aerosol: 9. Pine, Oak, and Synthetic Log Combustion in Residential Fireplaces,” Environmental Science & Technology, Vol. 32, No. 1, 1998, pp. 13-22. doi:10.1021/es960930b
- T. B. Jordan, A. J. Seen and G. E. Jacobsen, “Levoglucosan as an Atmospheric Tracer for Woodsmoke,” Atmospheric Environment, Vol. 40, No. 27, 2006, pp. 5316- 5321. doi:10.1016/j.atmosenv.2006.03.023
- M. C. Valsania, F. Fasano, S. D. Richardson and M. Vincenti, “Investigation of the Degradation of Cresols in the Treatments with Ozone,” Water Research, Vol. 46, No. 8, 2012, pp. 2795-2804. doi:10.1016/j.watres.2012.02.040
NOTES
*Statement of Author Contributions. Hao Tang performed all experiments and reported results. Jon Thompson assisted in authoring the manuscript, preparing graphs from data, and offering advice.