Open Journal of Air Pollution
Vol.1 No.1(2012), Article ID:20263,11 pages DOI:10.4236/ojap.2012.11001
Extreme Temperature Variability over High Topography
Center for Engineering Research, Research Institute, King Fahd University of Petroleum and Minerals, Dhahran, Saudi Arabia
Email: {srehman, luaimalh, mohandes}@kfupm.edu.sa
Received April 5, 2012; revised May 13, 2012; accepted June 2, 2012
Keywords: Global Warming; Extreme Temperatures; Man-Kendall Rank Statistics; Trends
ABSTRACT
The temperature variability was studied using linear regression models, Man-Kendall (M-K) rank statistics, mean monthly and annual temperature anomalies, number of hot and cold days and nights per annum. The temperature time series (mean, minimum and maximum) has shown a warming trend of the local air during last two decades. The maximum and minimum of the monthly mean temperatures of 23.35˚C and 13.25˚C were observed in June and January, respectively. Similarly, the maximum and minimum temperature ranges of 13.4˚C and 8.2˚C were found in December and June. The ratios between the hottest and coldest month’s monthly mean maximum and monthly mean minimum temperatures were 1.039 and 1.033, respectively. The best fit linear line showed an increase of 0.048˚C per annum in the annual mean temperature with a coefficient of determination of 52%. An overall increase of 1.01˚C was found between 1985. The Mann-Kendall rank statistics test confirmed the warming trends of the local atmospheric environment of Abha city.
1. Introduction
Temperature variations influence agriculture, architecture, power generation and use, including electrical power for heating and cooling; melting of snow and the effects of freezing and icing on transportation systems; flowering and harvesting dates. The temperature plays a key role in the development and growth of plants as a source of heat energy. Temperature changes over the years have been studied for almost each nation, developed or developing as it is evident from the literature. Global warming is caused by the build up of greenhouse gases in the atmosphere such as carbon dioxide and methane, which form a sort of blanket over the Earth, trapping in heat that would normally escape the atmosphere. The leading greenhouse gas is carbon dioxide, a pollutant emitted from the burning of fossil fuels, such as coal, oil, and natural gas. While it is true that there has always been some natural climate variability, record levels of carbon dioxide are having a far reaching change over our weather, sea levels, and climate. In its recent report, the Intergovernmental Panel on Climate Change found that 2005 carbon dioxide levels significantly exceed average concentration levels over the past 650,000 years.
Human activities on this planet are the major cause of adverse changes in local and global climatic conditions over the last half century. The exponentially growing populations and increasingly materialistic life patterns have further added to the problem. With increasing general awareness due to internet, television, radio and print media the climate change has become matter of great concern to individuals, engineers, meteorologists, nongovernmental organizations, scientists, and researchers and to certain extent to politicians too. Furthermore, the long-term climate variability is of great importance for the estimation of its impact on human activities and for predicting the future climate. Over the past century or so the global mean surface temperature has warmed up by approximately 0.6˚C ± 0.2˚C, as quoted by Nicholls and Collins [1] and Folland et al. [2]. According to IPCC report [3], there is strong evidence that most of the global warming over the past 50 years is likely to have been due to increase in greenhouse gas concentrations.
Nicholls and Collins [1] studied the temperature trends in Australia during twentieth century and found an increase in temperature due to addition of green house gases into the atmosphere. Vicente [4] analyzed the timeseries of eight climatic variables to ascertain the existence of climate variability in Northeast of Brazil. Their results indicated generally increasing trends in most of the variables studied by Mann-Kendall test. However, relative humidity and rainfall presented decreasing behavior. The study also indicated that most of the stations studied were going through a process of environmental dryness, Vicente [4]. A study was conducted by Tonkaz and Cetin [5] to determine the effects of regional parameters such as population change (∆P), number of motordriven vehicles (NMDV), area covered by industrial crops (A), number of buildings (NB), and monthly extreme temperature trends in a developing semi-arid southeast region of Turkey, known as GAP area. Tonkaz and Cetin [5] concluded that ∆P and A were the most important parameters to detect trends in Tmin and Tmax. Series Serra et al. [6] analyzed daily maximum and minimum temperatures recorded without interruption at Fabra Observatory (Barcelona) from 1917 to 1998. The study resulted in sharp increment in minimum, and particularly, maximum temperatures close to 1980 based on the hypothesis of randomness against trends, the Mann-Kendall sequential test, simple inspection of annual-averaged temperature plots, and time evolution of the von Neumann ratio on an annual scale.
Over the Indian Continent Nizamuddin [7] discussed the spatial and temporal variability of precipitation during the northeast and southwest monsoons. He observed that the monthly and seasonal analyses indicate some areas of great variability and extreme rainfall occurrences, which lead to flood disasters. Hasanean [8] investigated the trends and periodicity of surface air temperature series from eight meteorological stations in the east Mediterranean using different correlation tests. He found a significant positive trend at 99% confidence in Malta and Tripoli, and negative trend at 95% confidence level in Amman. Climatic trends in Israel were studied by Kafle and Bruins [9] in detail on the basis of three parameters: average annual temperature, annual precipitation and the annual aridity (humidity) index during the period 1970- 2002. Significant warming was evident in all 12 evaluated meteorological stations, situated in different parts of country.
Three trend models (linear, piecewise and sloped steps) were applied by Toreti and Desiato [10] to study the trends of mean temperature and average minimum and maximum temperature over Italy, together with their confidence intervals. Rebetez and Reinhard [11] analyzed long-term temperature trends based on 12 series of monthly data in Switzerland for the 20th century (1901- 2000). Their results showed mean decadal trends of +0.135˚C during the 20th century and +0.57˚C based on the last decade only. The climate change studies have been performed in different parts of the world and by a number of researchers for example Turkes et al. [12], Kadıoglu [13], Elagib and Mansell [14], Domonkos [15], and Kadıoglu and Saylan [16].
The incidence of heat waves, hot days, very hot days and extremely hot days in Kuwait during the warm seasons (May-August) from 1958 to 2000 was investigated by Nasrallah et al. [17]. Their results showed that the extremely high temperatures in the warm season were due to the changes in the regional circulation pattern. Mean, maximum and minimum surface air temperatures recorded at 70 climatic stations in Turkey during the period from 1929 to 1999 were analyzed by Turkes et al. [18] to reveal spatial and temporal patterns of long-term trends, change points, significant warming and cooling periods and linear trend rates per decade. Elagib and Addin Abdu [19] studied the climate of Bahrain during the past six decades, particularly through the temperature and rainfall trends. They further evaluated the consequent degree of aridity on the Islands. Their study demonstrated climate variability represented by alternate hot-dry and cool-wet events.
Alkolibi [20] assessed the possible impact of climatic change on Saudi Arabia’s agriculture and water supplies using climatic change scenarios using General Circulation Models and related research. His assessment indicated that an increase in temperature and decrease in precipitation could have a major negative impact on agriculture and water supplies in Saudi Arabia. Freiwan and Kadioglu [21] studied the climate variability of Jordan by examining the annual, seasonal and monthly precipitation and extreme temperature time series of 14 meteorological stations. Signals of climate trends such as warming in maximum temperature, more statistically significant warming in minimum temperature, decreasing trends in daily temperature range and statistically insignificant decreasing precipitation trends were detected, Freiwan and Kadioglu [21].
The study presents long-term temperature variability analysis by utilizing daily time series data during 1985 to 2006 for Abha, Saudi Arabia. The analysis include monthly and annual temperature and range variation, warming or cooling rate estimation using regression least square fit modeling, Mann-Kendall rank statistical test, estimation of hot and cold days and nights frequencies, and temperature anomalies on annual basis.
2. Data and Site Description
Abha, a hill station, is located in the southern part of Saudi Arabia and comprises of an airbase, the university, the police office, hotels, hospitals, shopping malls and of course other essential facilities to facilitate the inhabitant of the region. Abha city has seen a rather fast growth and development during the last 15 years with large number of new buildings and very big shopping malls and other support facilities. Abha is a hill station and attracts large number of visitors during summer season and other official holidays. The meteorological data of Abha, used in this study, covers a period of 22 years between 1985 and 2006. The study incorporates daily mean, maximum and minimum values of temperature in the present analysis. The data was checked for completeness and erroneous values. Figure 1 shows the geographical location of Abha city.
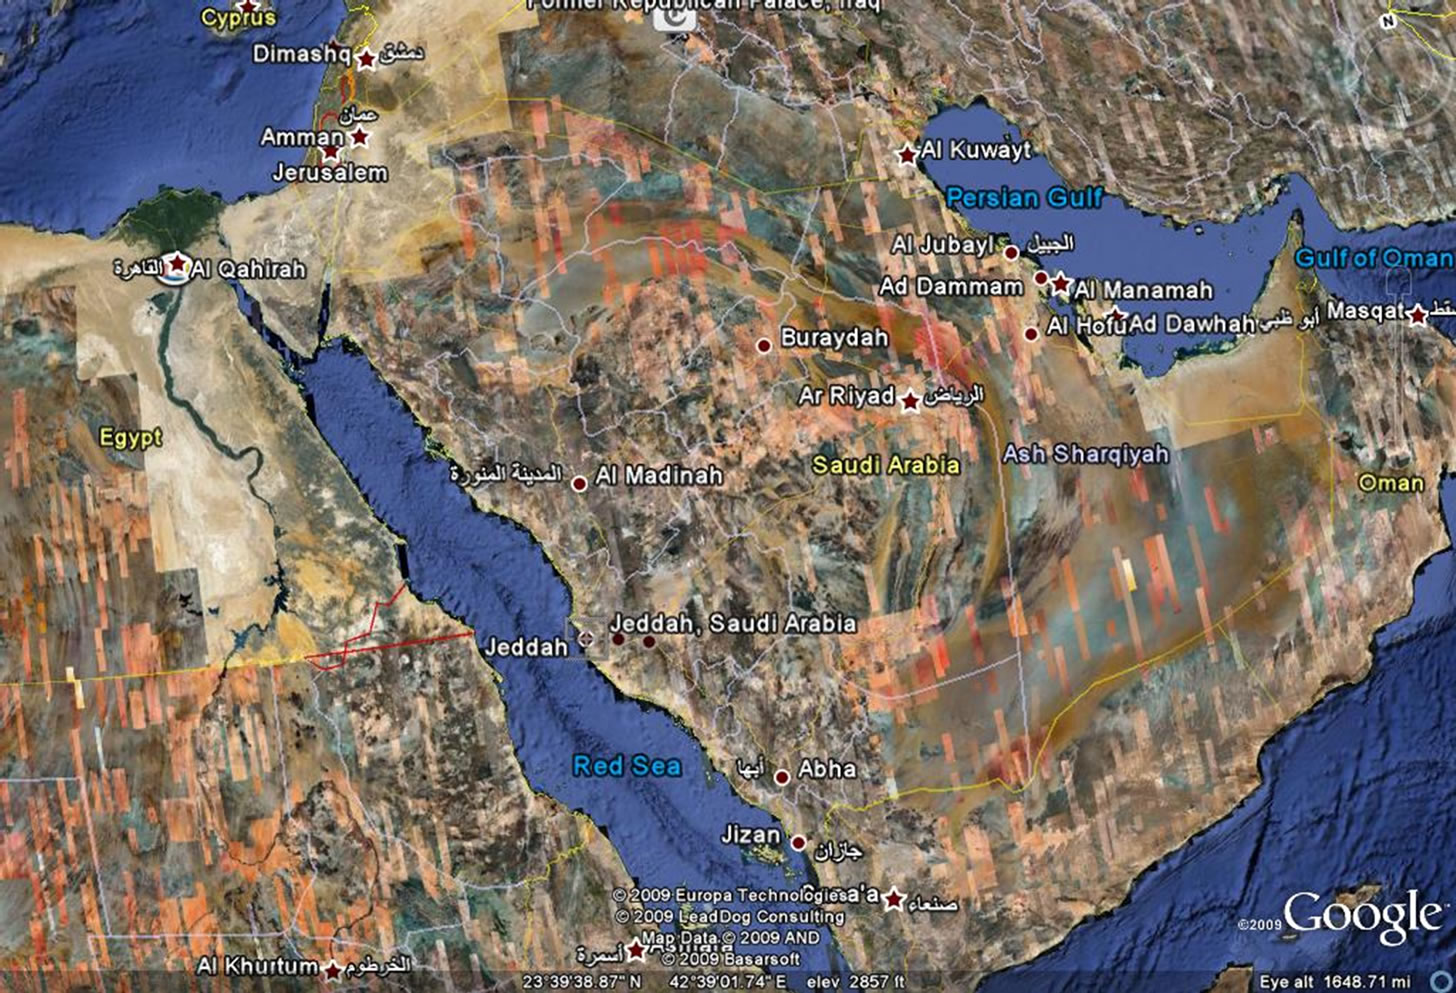
Figure 1. Location of Abha in Saudi Arabia.
3. Methodology Used
The monthly and annual means and standard deviations were calculated by simple and known statistical methods. The magnitudes of the trends of increasing or decreasing temperatures were derived from the slope of the regression line using the least squares method and Man-Kendall (Mann [22]; Kendall [23]) rank statistics test. The Mann-Kendall rank statistical trend test is a nonparametric method for monotonic trend. It is widely used for trend analysis, particularly in case when many time series need to be evaluated at the same time. This method is advantageous over others to the fact that 1) it is free from normal distribution assumptions; 2) it is resistant to effects of outliers and gross data errors; 3) it allows missing data; and last but not the least 4) it also gives the point in time of the beginning of a developed trend. These characteristics are big advantages when analyzing for trends in many time series such as climatological data at multiple stations because it is not necessary to screen and transform the data for normality. The Mann-Kendall test is, therefore, directly applicable to climatological data for a given month or season.
The temperature range was obtained by taking the difference between the monthly maximum and minimum temperatures of the daily mean values. The number of hot and cold days and nights were estimated using daily maximum and minimum temperatures recorded during different years. The hot days are classified as hot if daily maximum temperature Tmax becomes ≥35˚C, the hot nights are defined when daily mean temperature Tmin becomes >0˚C, the cold days are defined as cold when Tmax becomes ≤20˚C and finally the cold nights are said to be cold when Tmin becomes ≤15˚C.
4. Results and Discussion
The daily mean, maximum and minimum values of temperature are analyzed and presented in the forthcoming paragraphs. The discussion is divided into monthly and annual mean temperature variability, monthly and annual minimum temperature variability, monthly and annual maximum temperature variability, long-term seasonal trends and finally the analysis of annual frequencies of hot and cold days and nights.
4.1. Variability of Annual Mean Temperature of Daily Mean
The long-term monthly mean temperatures were calculated using the daily average values during the years 1985 to 2006 and are shown in Figure 2. The high and low values of monthly mean temperature reached during the data collection period are also depicted in this figure. The monthly mean minimum temperature of 13.25˚C was found in January while a maximum of 23.35˚C in June. This means that the ratio between the temperatures of hottest and coldest months was 1.035. Higher values of mean temperatures were observed from May to September, as seen from Figure 2. At Abha, Saudi Arabia, a wide range of temperature exists in the daily average monthly maximum and minimum values, as shown in Figure 2. On average scale, the maximum range of 13.5˚C was obtained in December and the minimum range of about 8.1˚C in June. Higher temperature ranges
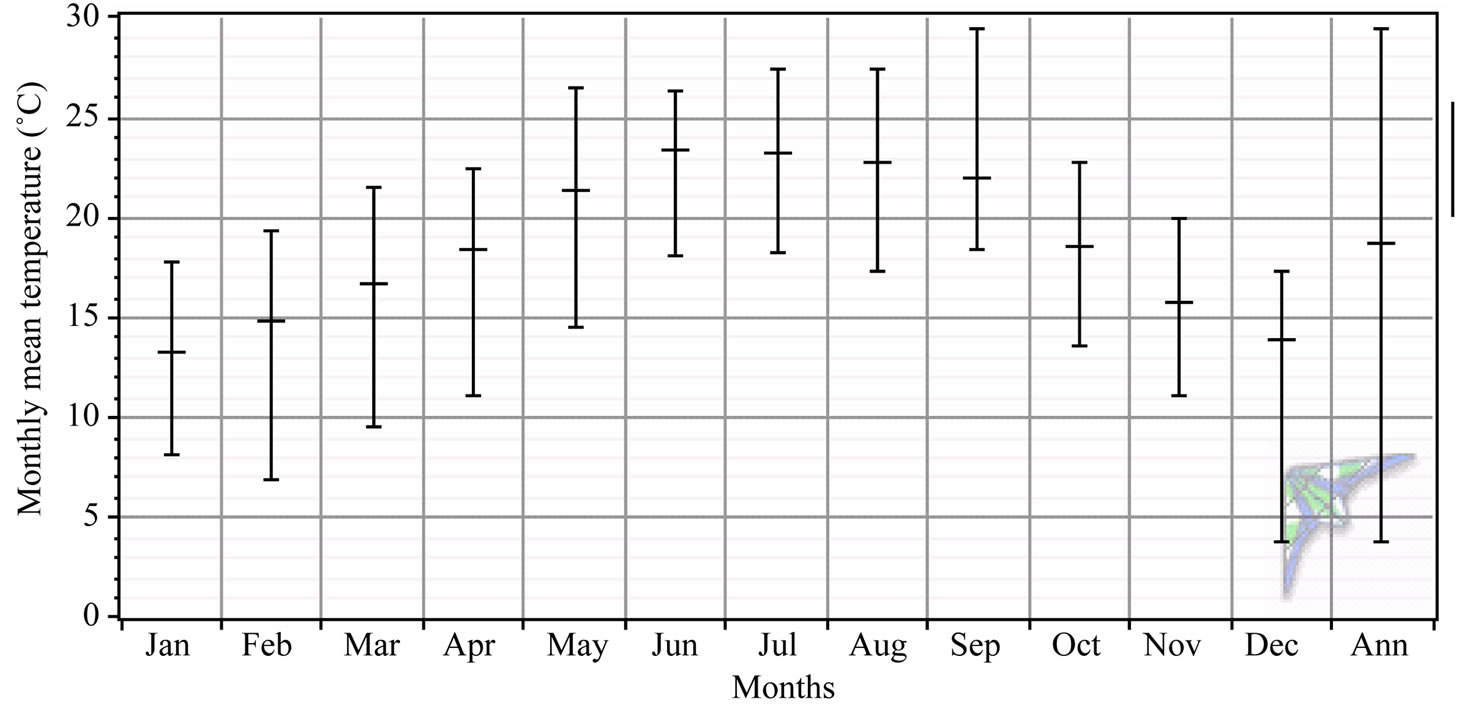
Figure 2. Seasonal variation of mean, maximum and minimum of daily mean temperature at Abha during 1985-2006.
were observed during February to May and then in September and December, as it is evident from Figure 2.
The annual mean temperatures along with the linear regression line are shown in Figure 3. The trend line shows an increase in the temperature of approximately 0.05˚C per year with coefficient of determination of 52%. Significant decrease in annual mean temperature was noticed in the year 1992, as can be seen from Figure 3. An overall increase of 1.01˚C was found between 1985 and 2006 that is from 18.054˚C to 19.064˚C as estimated by the least square regression line shown in Figure 3. This analysis confirms a warming trend of the local air during the data reporting period. Furthermore, it is in line with the analysis of data sets of the earth’s surface temperature which reported an increase of about 0.5˚C in the global temperature since the start of 20th century (Koutsikopoulos et. al. [24]). The temperature anomalies of individual annual mean temperatures from the mean of the entire period 1985-2006 are presented in Figure 4. It is evident from this plot that frequent cold spells have been experienced at Abha during 1985 till 1997 with few exceptions from 1991 to 1992 when hot spells were observed. Continuous hot spells were observed during 1998 till 2006, as seen from Figure 4. The ratio between the frequencies of hot to cold spells have been calculated as 1:1 for 1985-2006 time periods, indicating warming trend during the latter period.
4.2. Variability of Annual Mean Maximum Temperature of Daily Maximum
The long-term monthly mean maximum temperatures were calculated using the daily maximum values during the years 1985 to 2006 and are shown in Figure 5. This figure also displays the monthly high and low values of the monthly mean maximum temperatures over the data reporting period. The minimum of monthly mean maximum temperature of 19.51˚C was found in January while a maximum of 30.83˚C in June. This means that the ratio between the temperatures of hottest and coldest months was 1.039, bit higher than the corresponding ratio of monthly mean daily temperature, as discussed in the previous section. Higher values of mean temperatures were observed from April to October, as seen from Figure 5. Higher ranges were observed during January to May and then lower in rest of the months, as it is evident from Figure 5.
The annual mean temperatures along with the linear regression line are shown in Figure 6. The trend line shows an increase in the temperature of approximately 0.07˚C per year with coefficient of determination of 40%. Significant decrease in annual mean temperature was noticed in the year 1992. An overall increase of 1.441˚C was found between 1985 and 2006 that is from 24.872˚C to 26.313˚C as estimated by the least square regression line shown in Figure 6.
4.3. Variability of Annual Mean Minimum Temperature of Daily Minimum
The long-term monthly mean minimum temperatures were calculated using the daily minimum values during the years 1985 to 2006 and are shown in Figure 7. This figure also displays the monthly high and low values of the monthly mean minimum temperatures over the data reporting period. The minimum of monthly mean minimum temperature of 7.65˚C was found in January while a maximum of 16.99˚C in July. This means that the ratio between the temperatures of hottest and coldest months was 1.033, bit lower than the corresponding ratios of monthly mean temperature, as discussed in the previous section. Higher ranges were observed during whole year except in April, May and September, as it is evident from Figure 7. The annual mean minimum temperatures along with the linear regression line are shown in Figure 8. The trend line shows an increase in the annual mean
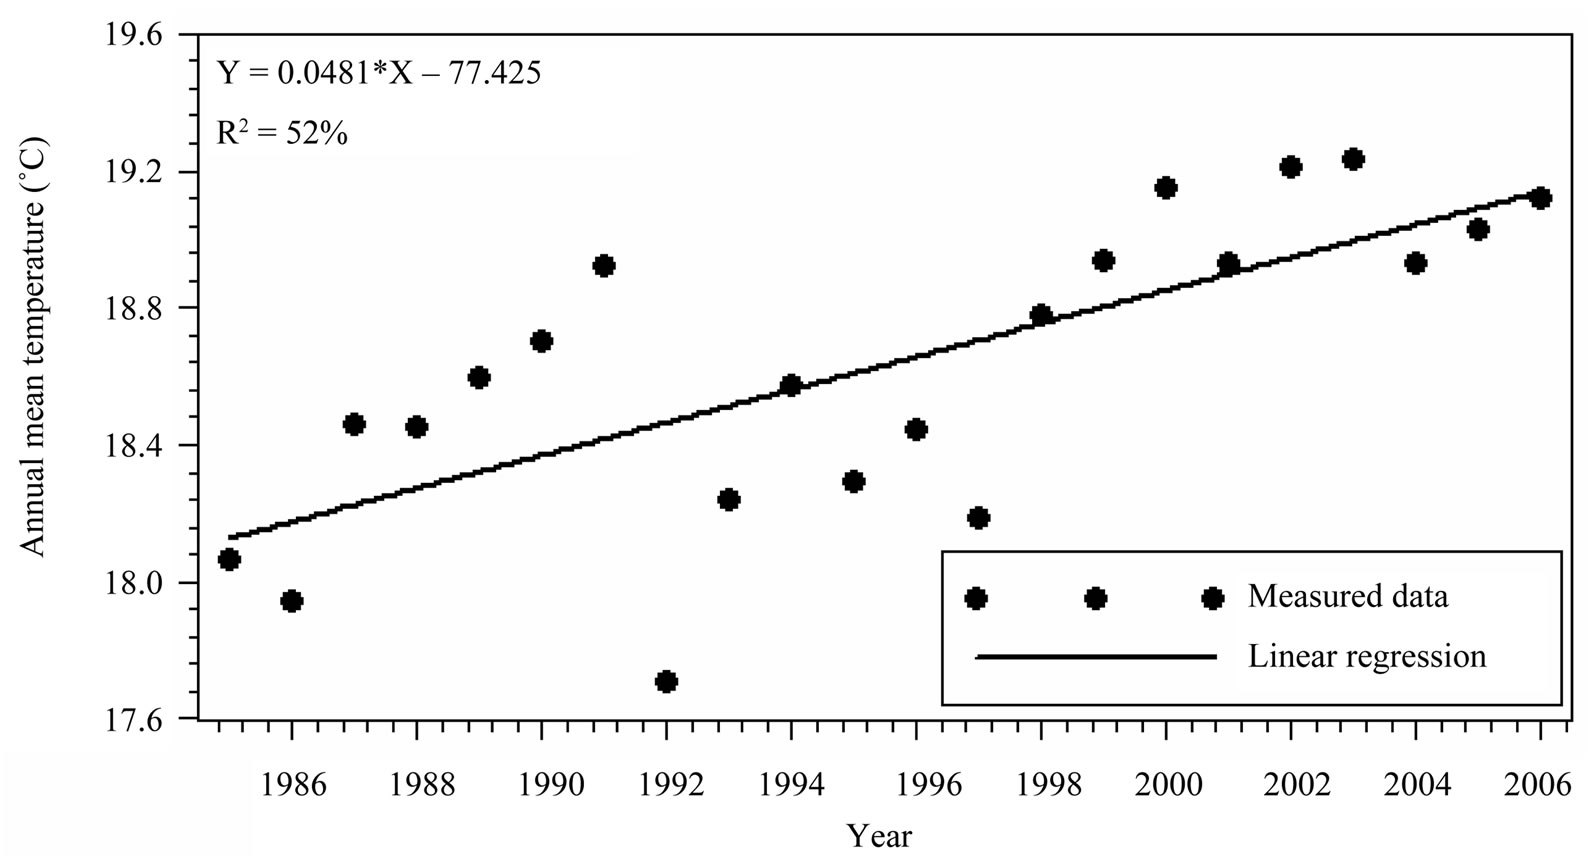
Figure 3. Annual mean temperature and linear regression model at Abha during 1985-2006.
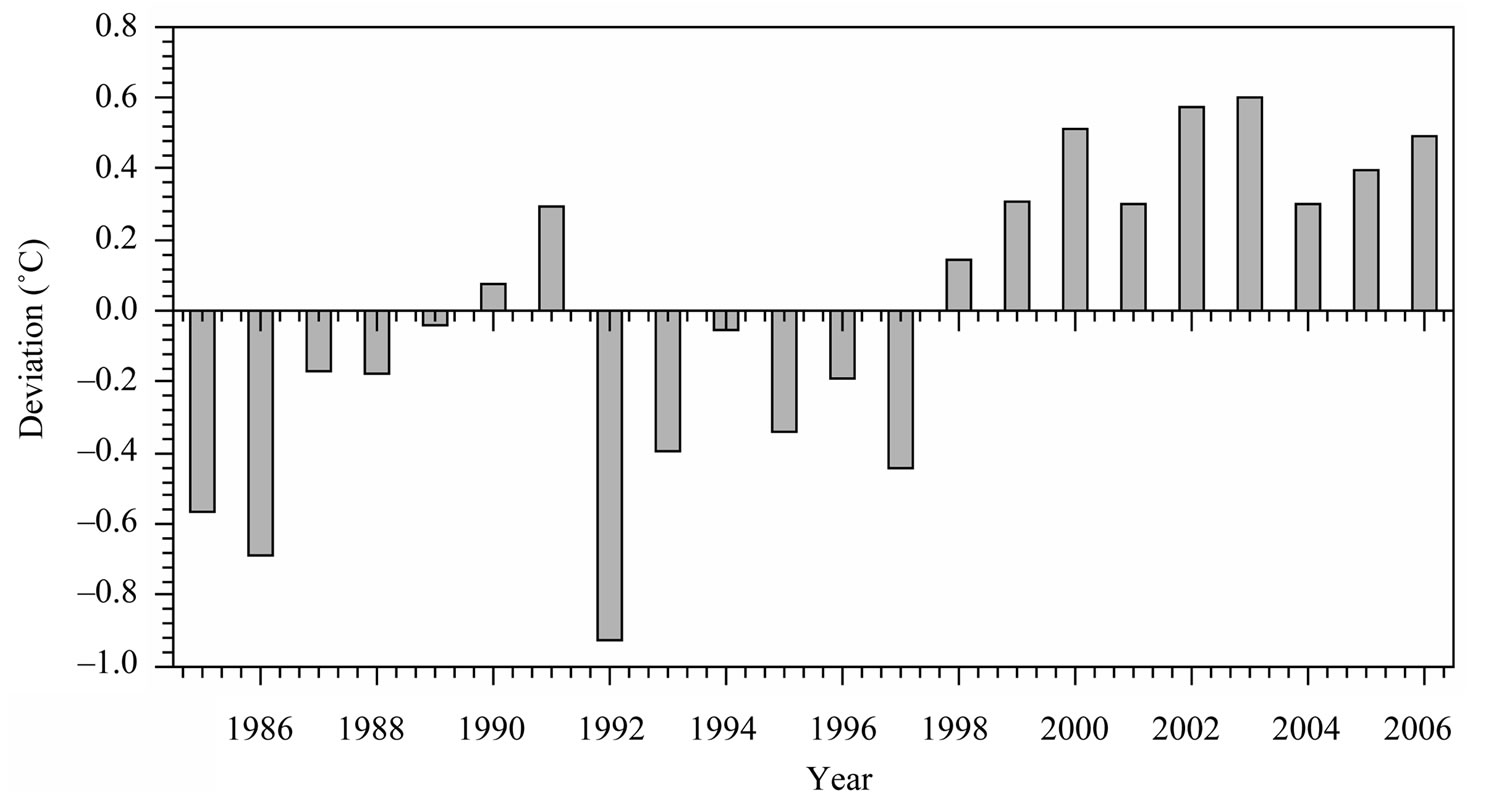
Figure 4. Annual deviations from overall mean temperature at Abha during 1985-2006.
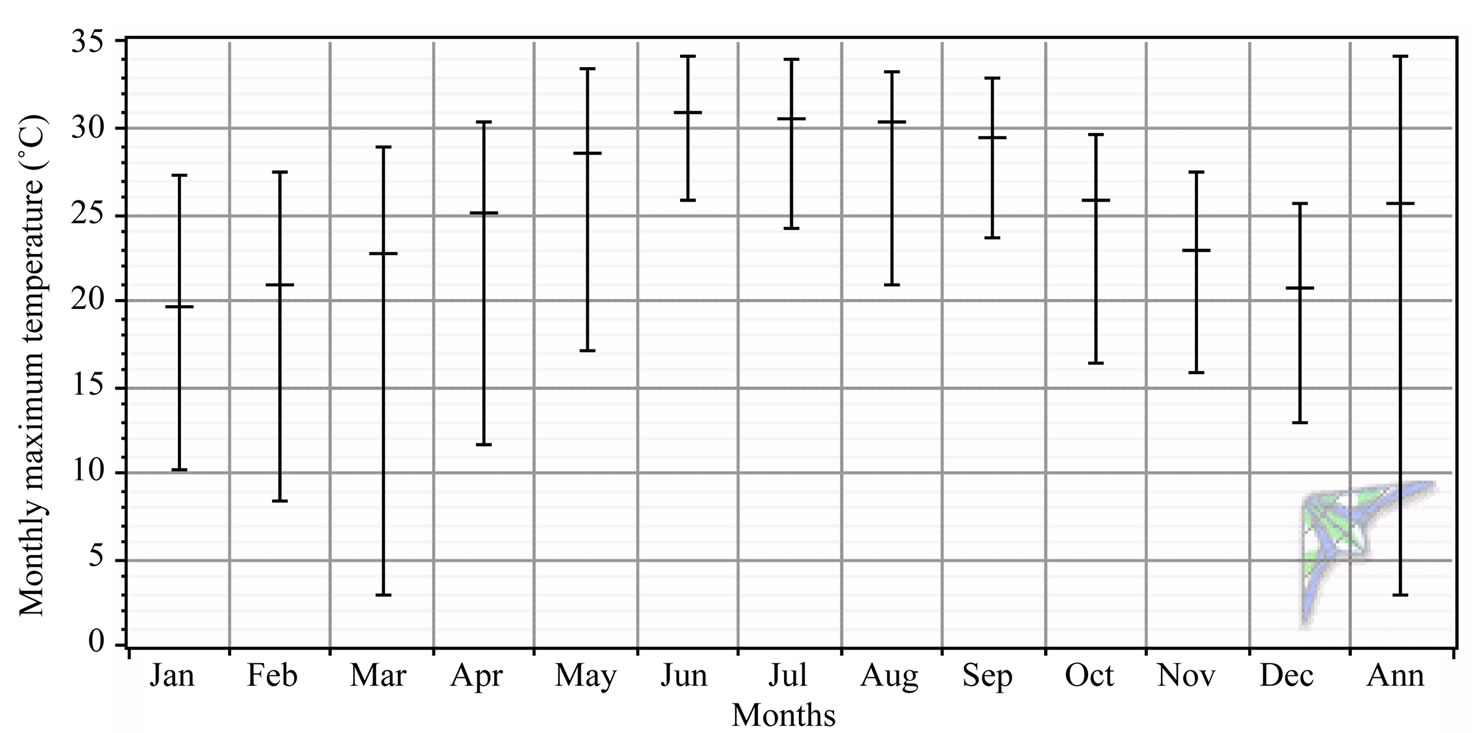
Figure 5. Seasonal variation of monthly mean maximum temperature of daily maximum at Abha during 1985-2006.
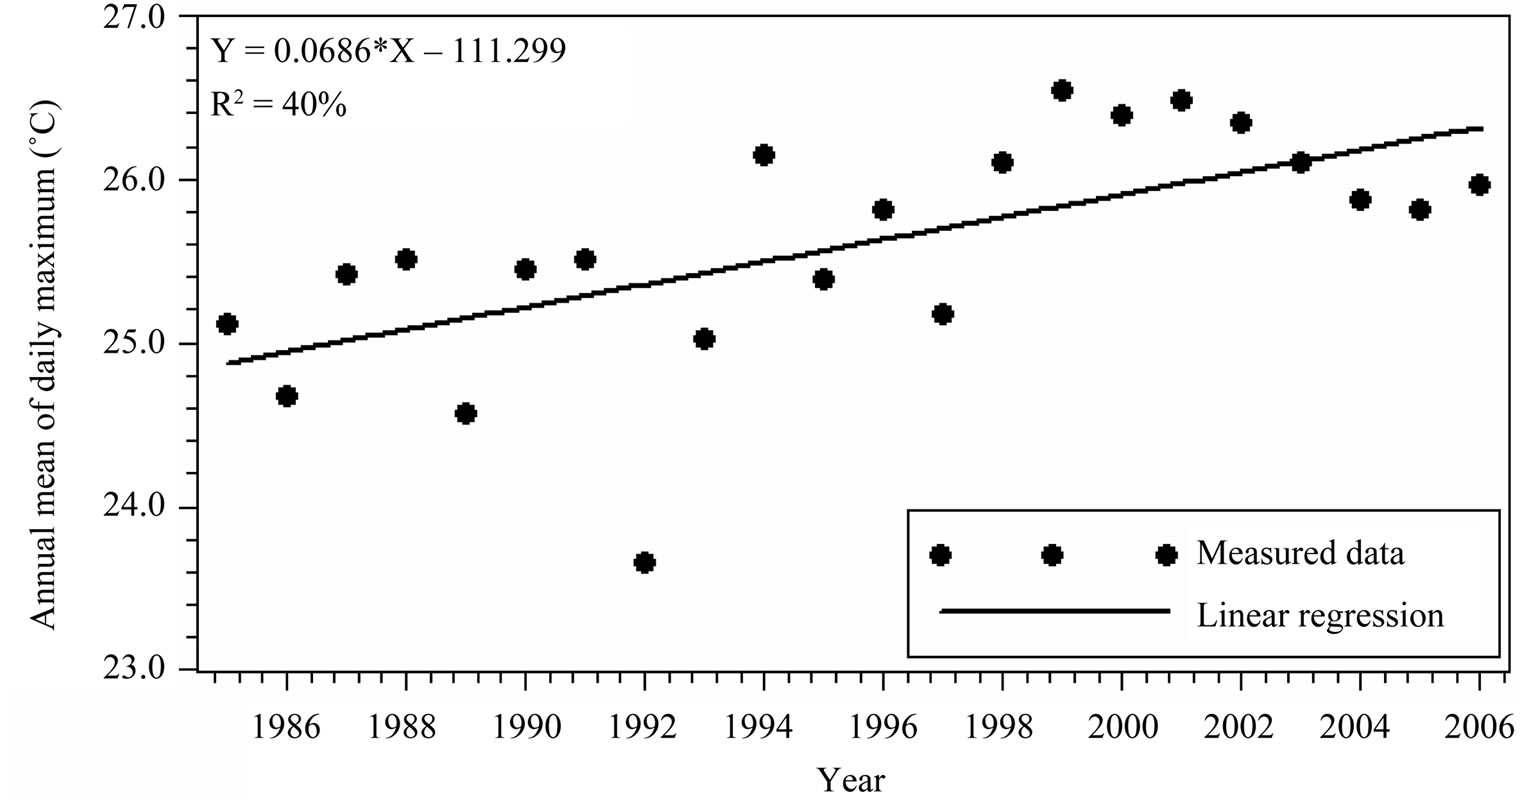
Figure 6. Annual mean maximum temperature and linear regression model at Abha during 1985-2006.
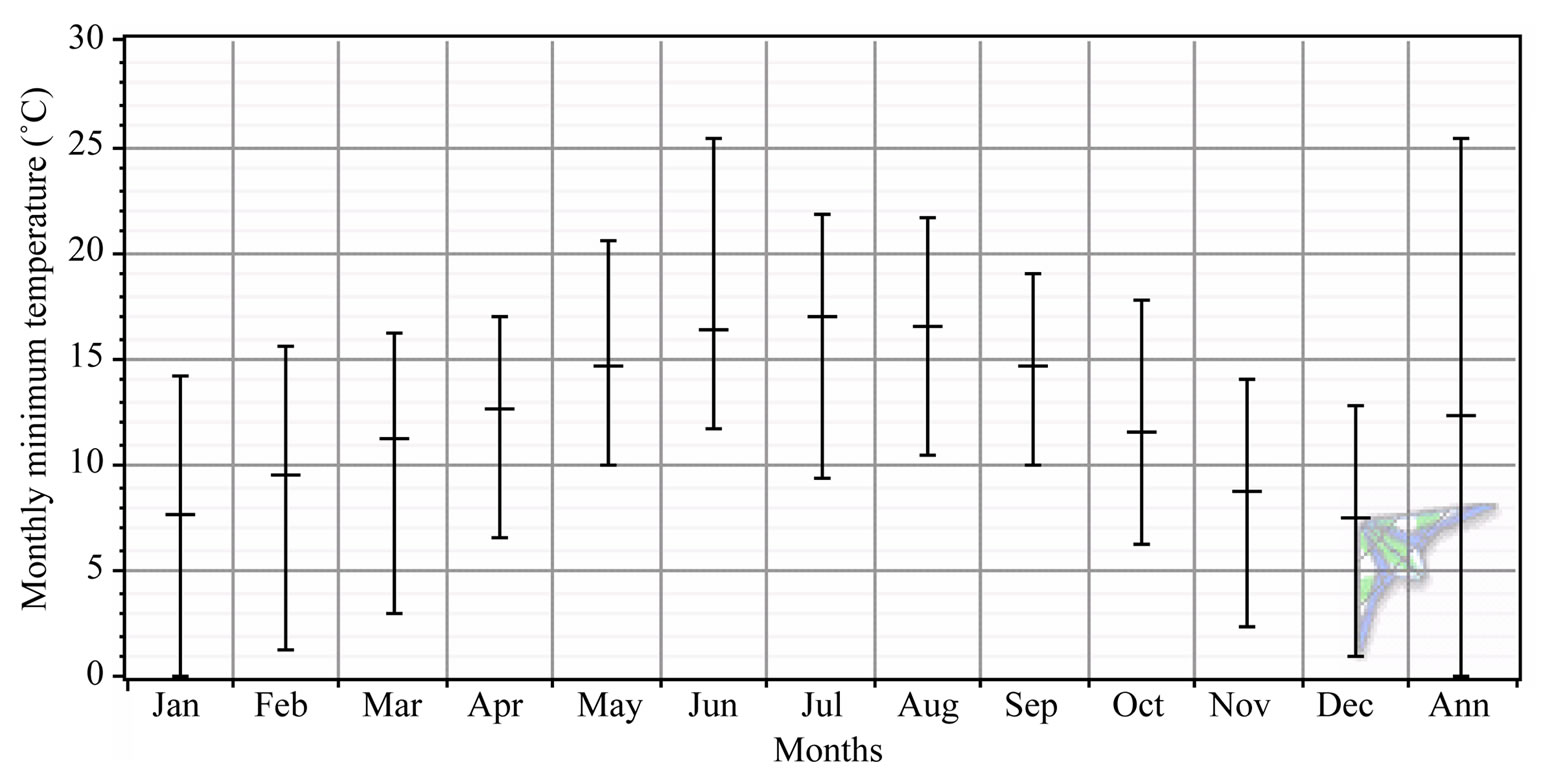
Figure 7. Seasonal variation of monthly mean minimum temperature of daily minimum at Abha during 1985-2006.
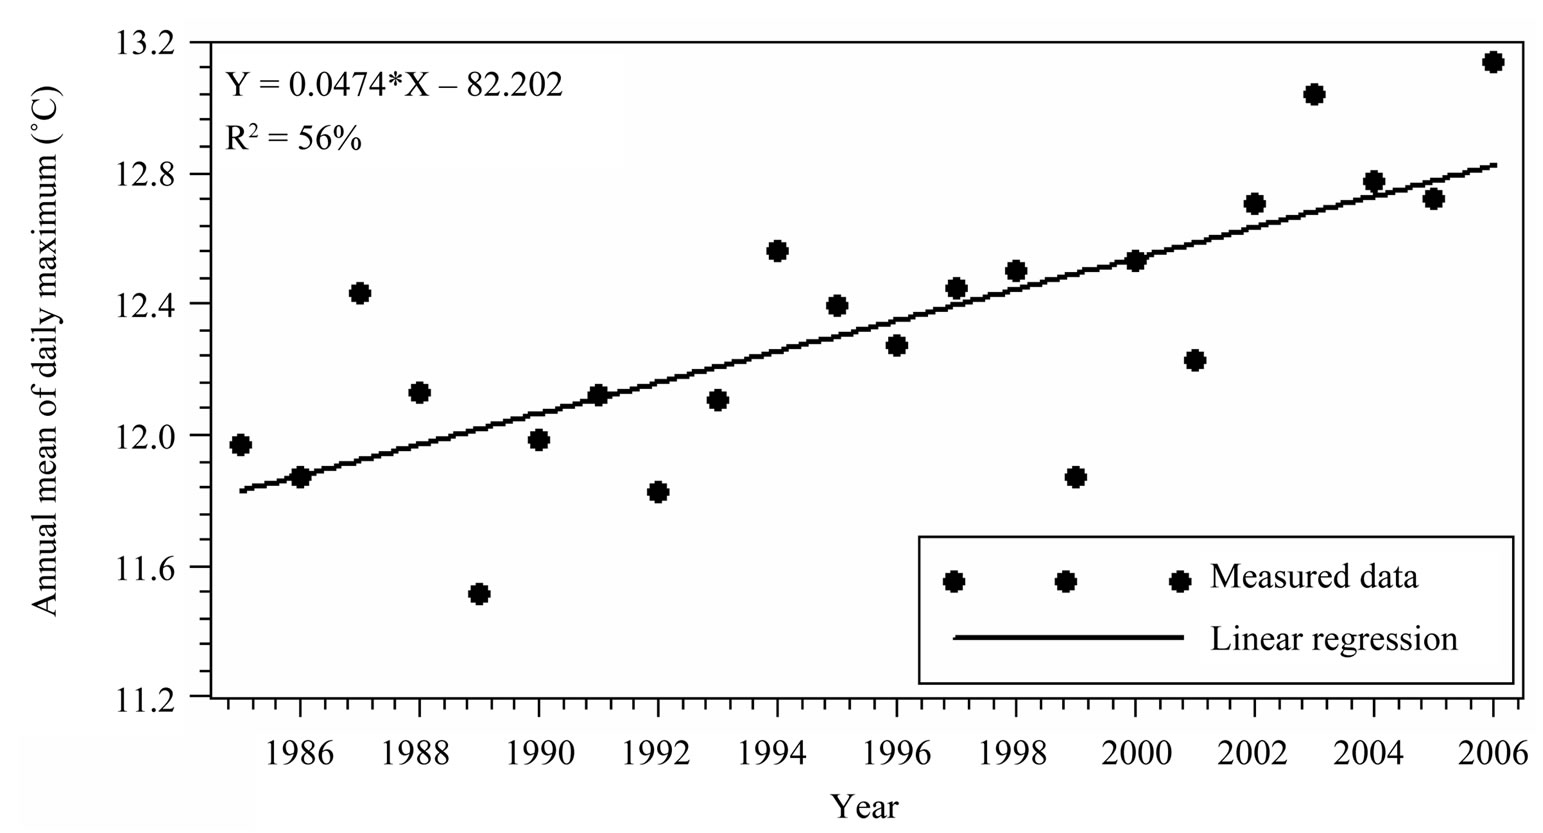
Figure 8. Annual mean minimum temperature and linear regression model at Abha during 1985-2006.
minimum temperature of approximately 0.05˚C per year with coefficient of determination of 56%. Significant decrease in annual mean minimum temperature was noticed in the years 1989 and 1999. An overall increase of 0.995˚C was found between 1985 and 2006 that is from 11.887˚C to 12.882˚C as estimated by the least square regression line is shown in Figure 8.
4.4. Long Term Seasonal Trends of Monthly Mean Maximum, Mean and Minimum Temperatures
The quantification of temperature trends in different months of the year over long period of time is important for applications such as agriculture, power generation, weather forecasting, etc. This section is devoted to the detailed study of monthly mean maximum, mean, and means minimum temperature trends. The trend analysis is performed using linear regression lines and the MannKendall statistical rank test. The regression line for each month and for monthly mean maximum, mean and minimum temperatures are depicted in Figure 9. The corresponding coefficients (a and b) of the linear best fit lines along with square of coefficients of determination are summarized in Table 1. To further strengthen the trend rates, Mann-Kendall rank statistics and the Sen’s Slope (SS) were determined and are summarized in Table 2.
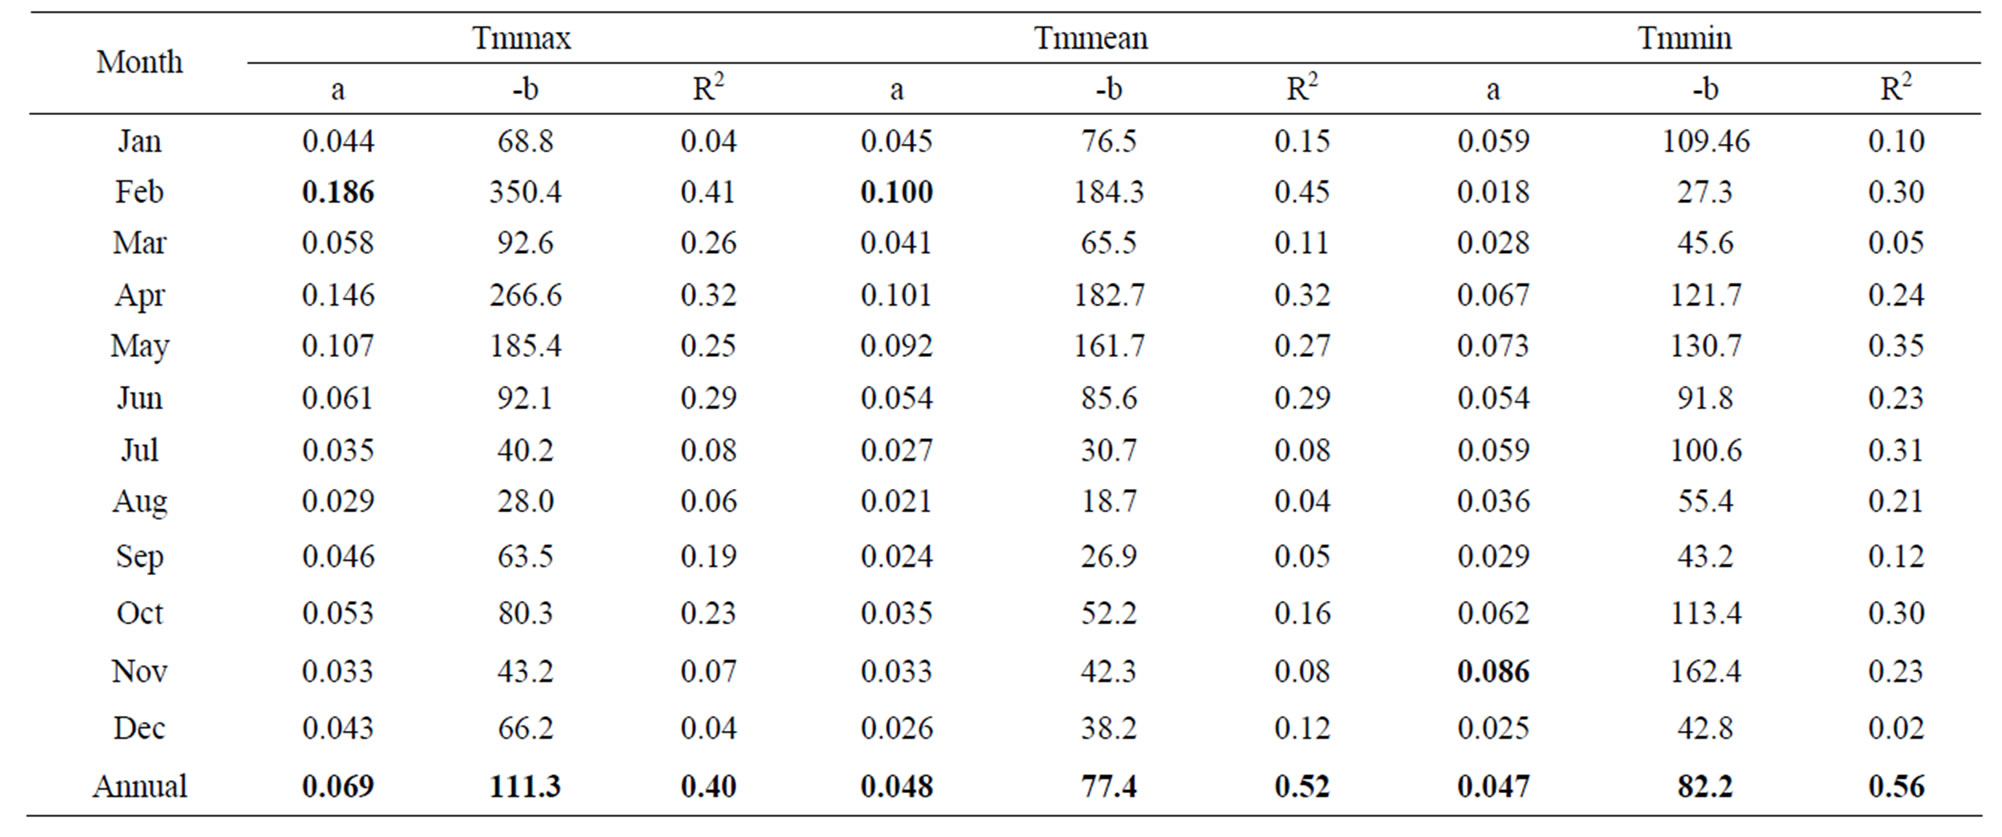
Table 1. Coefficients (a and b) of linear regression lines.
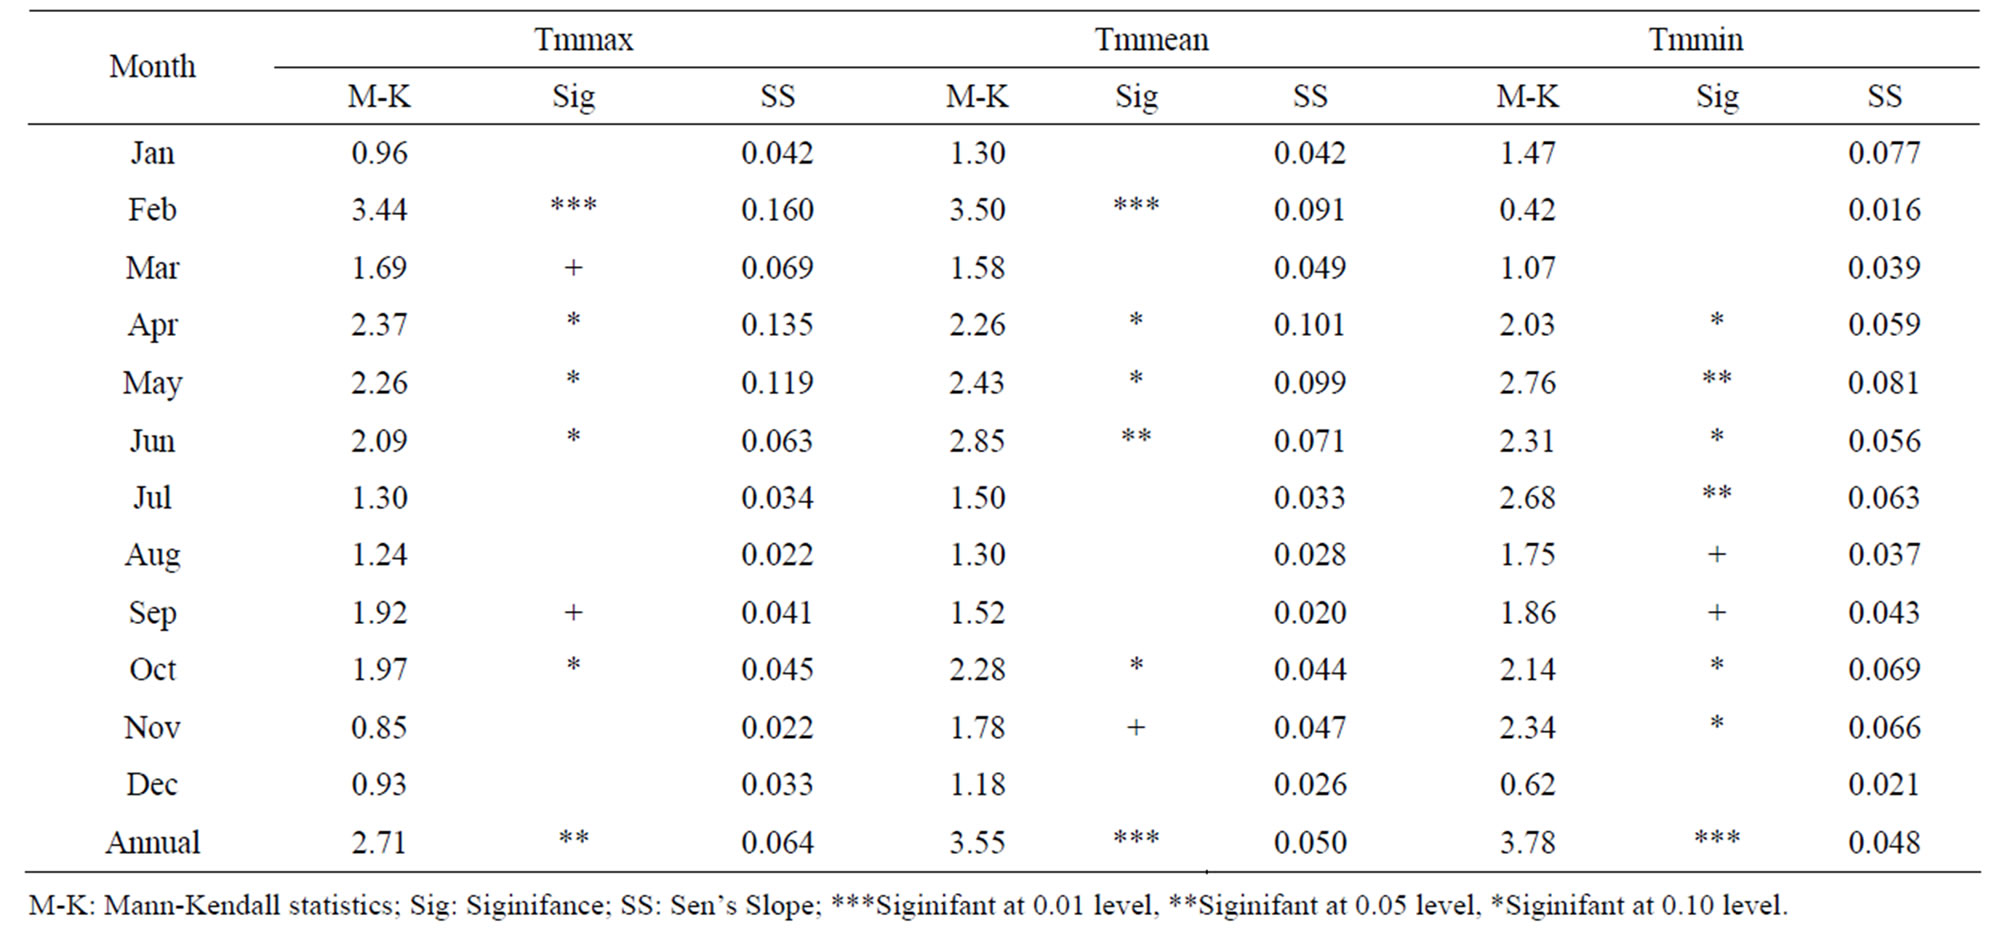
Table 2. Summary of Mann-Kendall rank statistics and Sen’s slope (SS) estimates
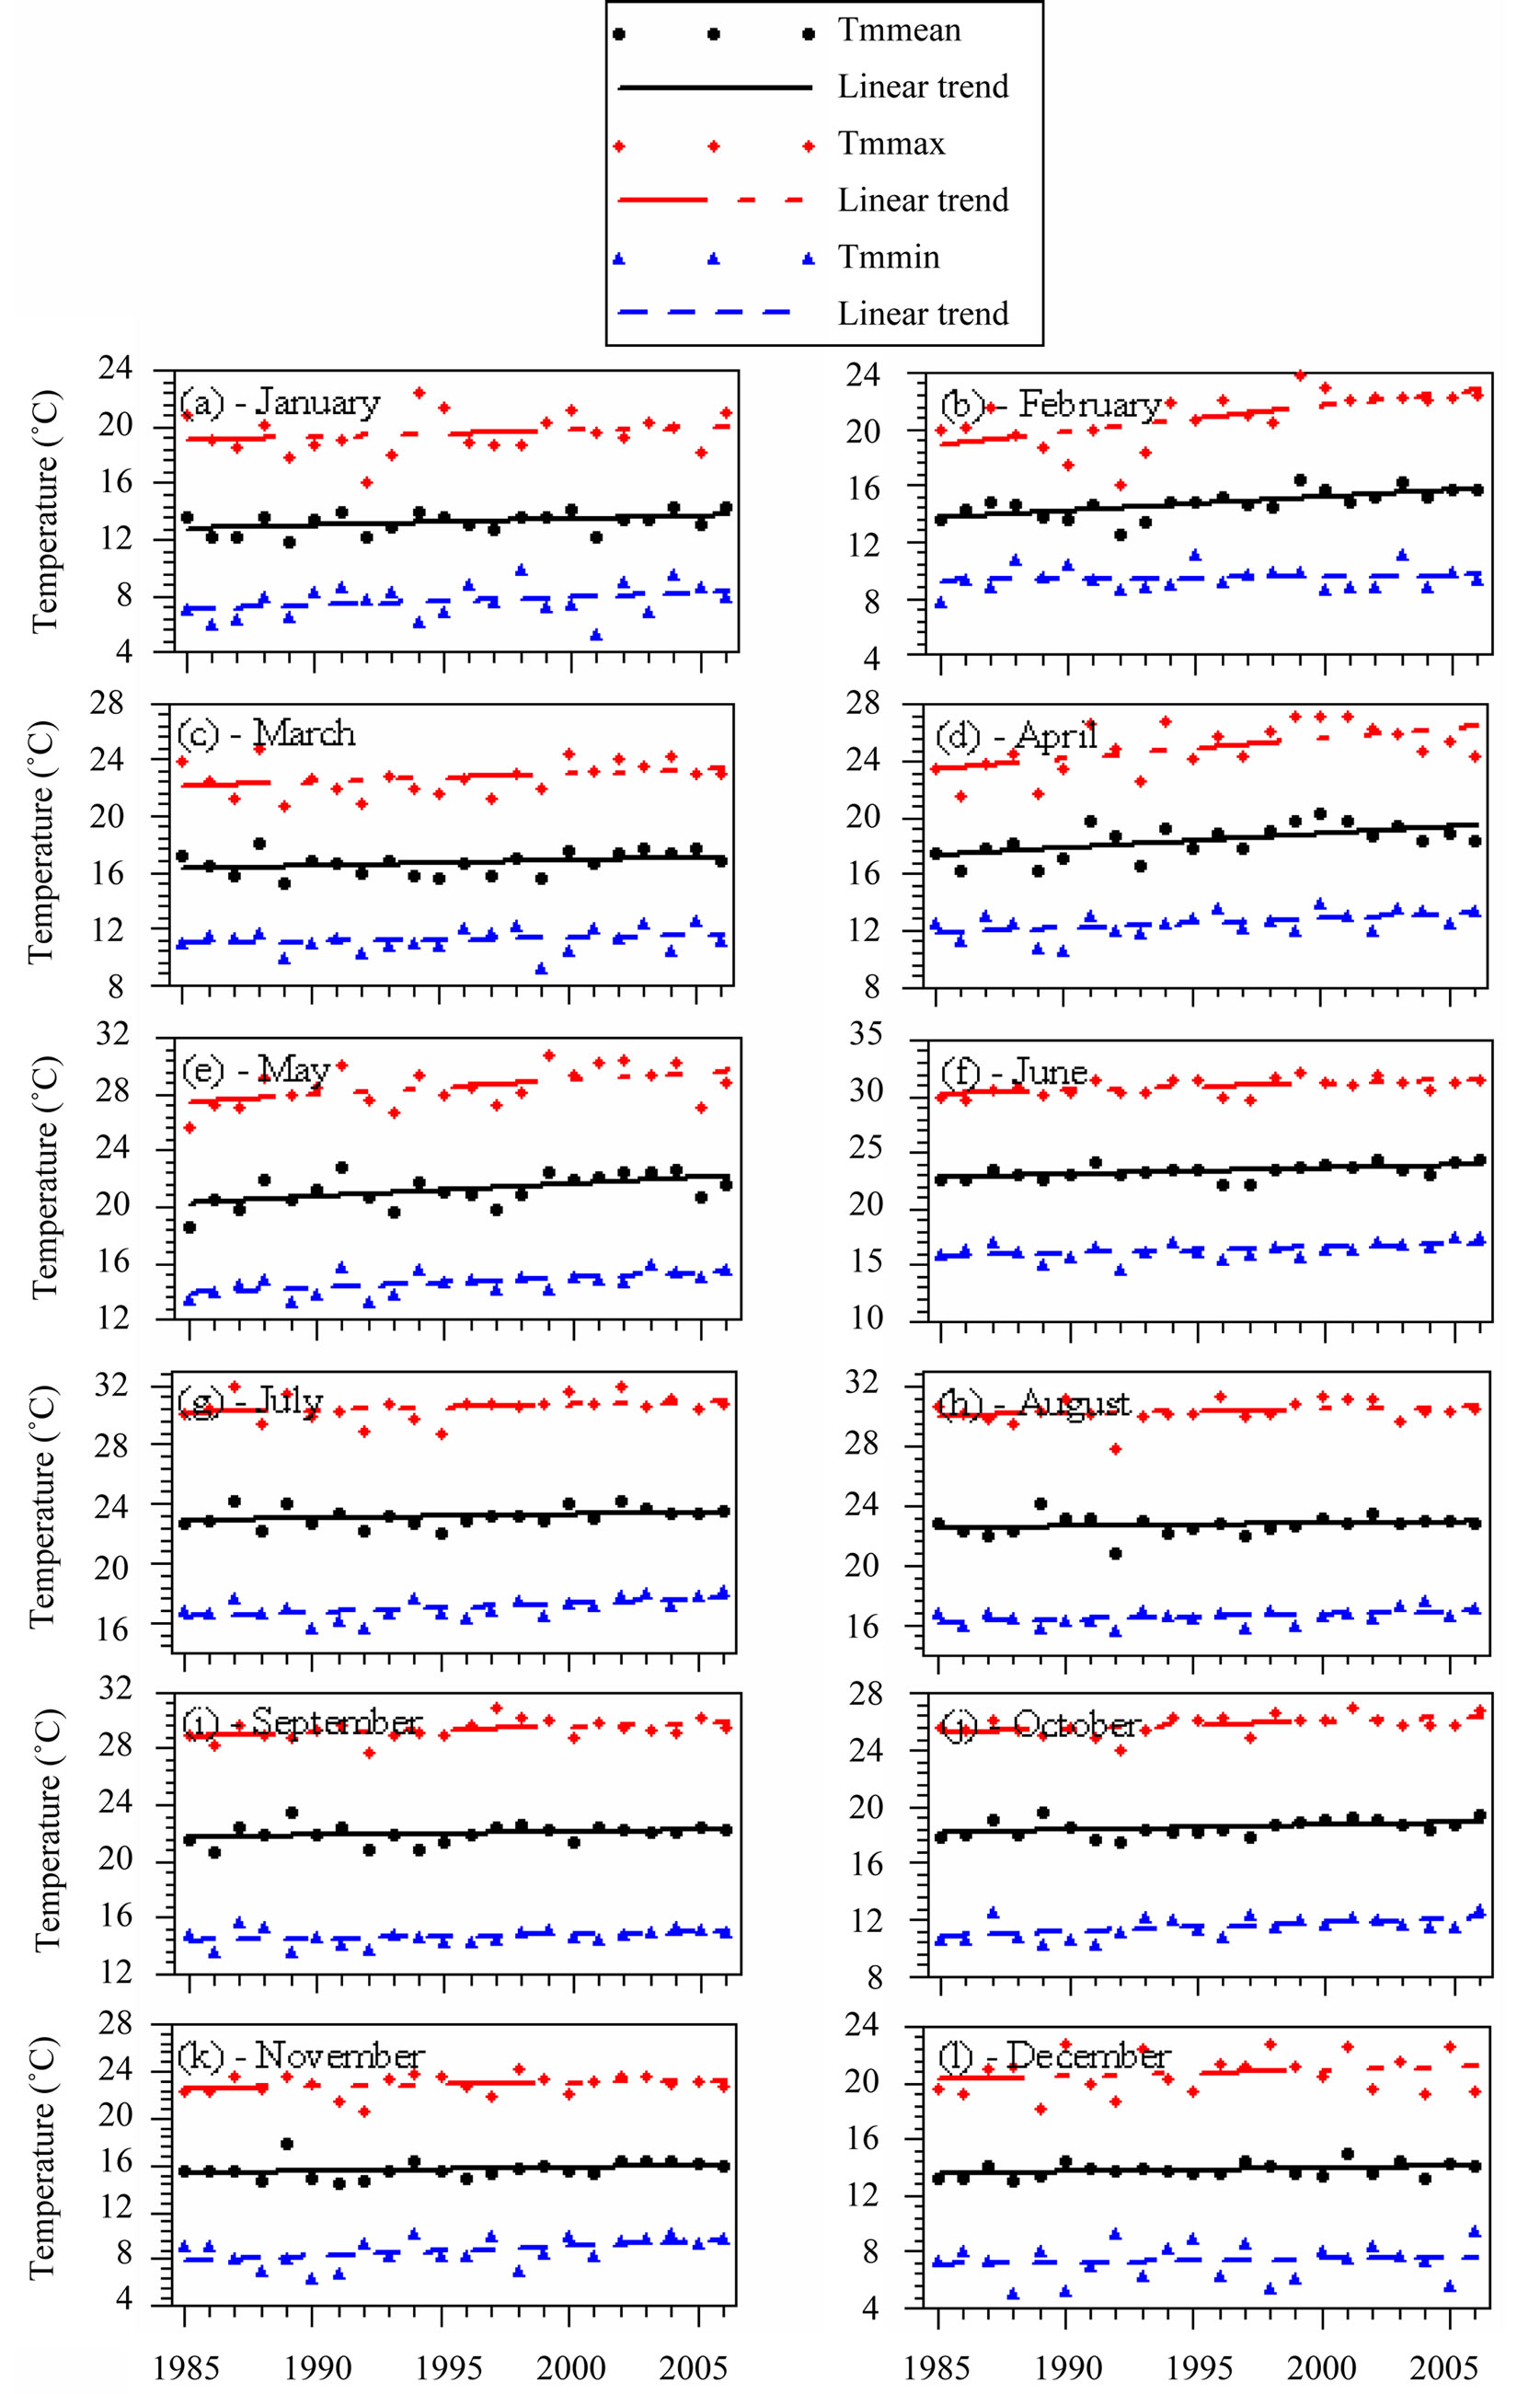
Figure 9. Seasonal trends of mean monthly maximum, mean and minimum temperatures and linear regression models at Abha during 1985-2006.
The linear coefficient a, which indicates the rate of increase/decrease of the temperature, was found to be highest (0.186˚C per year, Table 1) in the month of February for monthly mean maximum temperature. The Mann-Kendall rank statistics (3.44) was also found to be significant at 0.01 level in this particular case and the Sen’s Slope was also highest i.e. 0.16, as seen from Table 2. Minimum value of rate (0.029˚C per year) of increase of monthly mean maximum temperature was obtained corresponding to the month of August (Table 1, column 2). Similar types of results were found for monthly mean temperatures as can be seen from Table 1 (column 5) and Table 2 (columns 5 to 7). In case of monthly mean minimum temperatures, the maximum rate of increase of 0.086˚C per was found in the month of November, different than the previous two cases.
4.5. Hot and Cold Days and Hot and Cold Nights Variability
The number of hot (daily maximum temperature ≥ 35˚C) and cold (daily maximum temperature ≤ 20˚C) day’s variability in different years also provide information on the increasing or decreasing effect of warming on local, regional and global scales. Similarly the variability in annual number of hot (daily minimum temperature > 20˚C) and cold (daily minimum temperature ≤ 15˚C) nights also provides an increasing or decreasing trend in the daily minimum temperatures. The annual frequencies in terms of number of hot and cold days and nights over the study period were estimated and are shown in Figure 10. The frequency of extreme events, e.g. hot days, has been almost non-existent right from 1985 till 2006 as shown in Figure 10. The increase in frequency of hot nights per year was insignificant till 1990 but showed a very slow increasing trend of 0.16 nights per year afterwards. On the other hand, the extreme cold event (e.g. the cold days and nights) has shown a significant decrease, as can be seen from Figure 10. Over 1985 to 2006 period, the frequency trend showed a decrease in the annual frequency of cold nights of 1.39 nights per year and of cold days of 1.15 days per year, as shown by best fit equations in Figure 10. This implies that the extreme events are converging and hence the gap between the minimum and maximum temperatures is on the decrease. This implies an increase in the extreme temperatures over the study period.
5. Conclusions
The overall study concluded a warming trend in Abha city with following particular findings:
The minimum of the monthly mean temperature of 13.25˚C was found in January while the maximum of 23.35˚C in June. Thus the ratio between the temperatures of hottest and coldest months was 1.035. The maximum range (difference between monthly maximum and monthly minimum of the daily mean values) of 13.4˚C was obtained in December and a minimum of 8.2˚C in June. Relatively higher ranges were observed during winter months and lower during other months. Similarly the ratios between the hottest and coldest month’s monthly mean maximum and monthly mean minimum temperatures were 1.039 and 1.033, respectively.
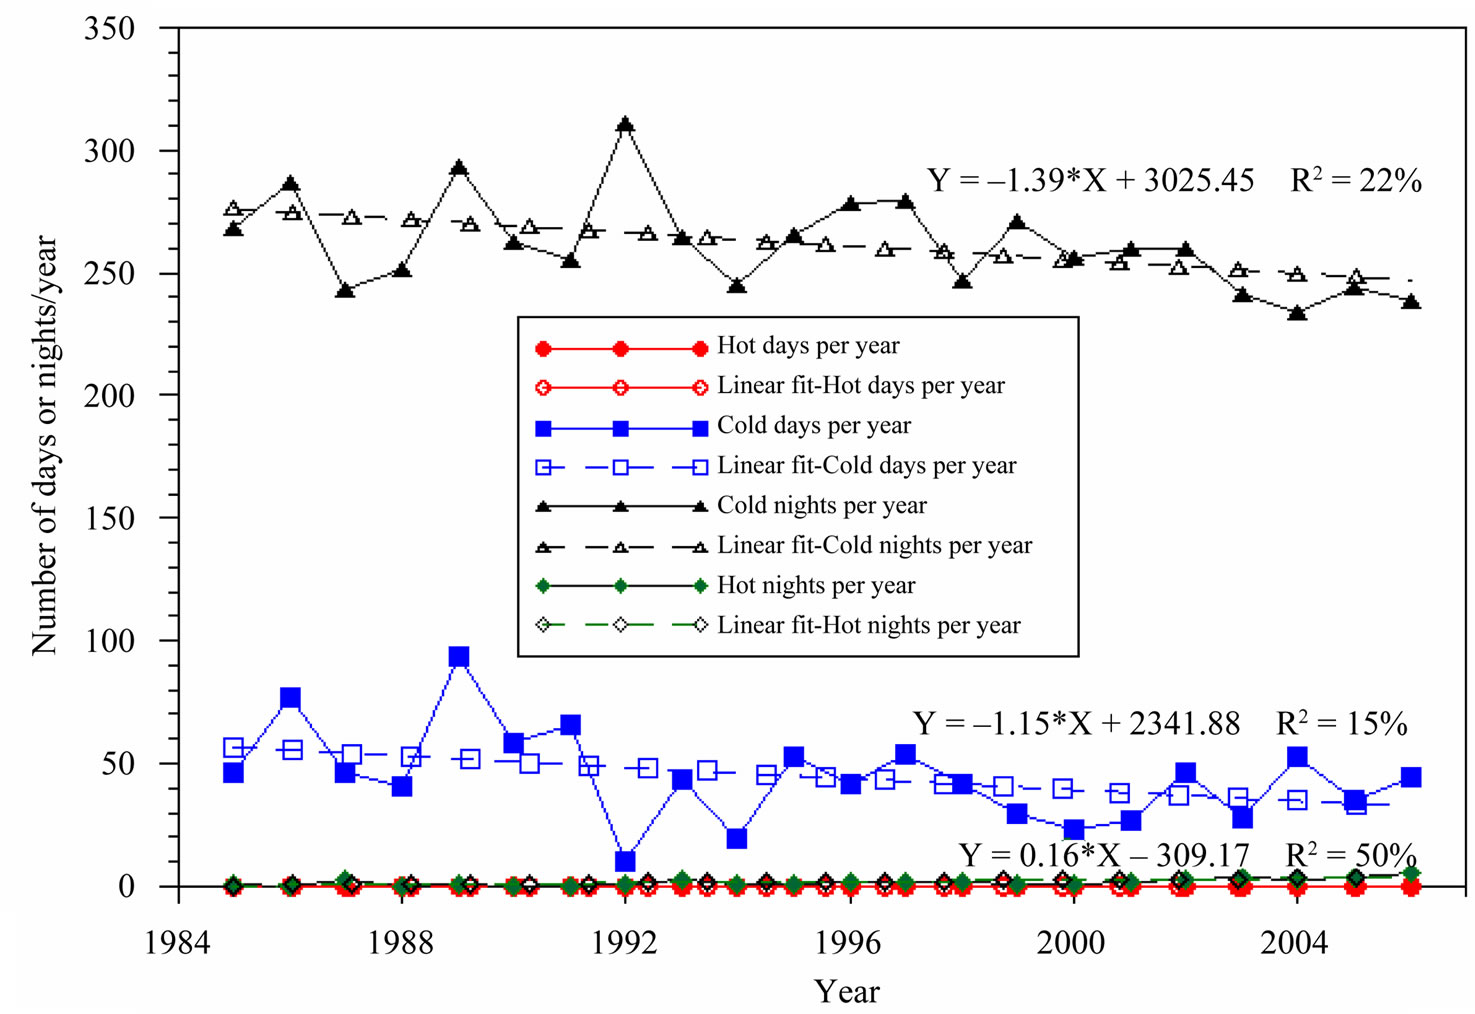
Figure 10. Number of annual cold and hot days and nights at Abha during 1985-2006.
The best fit linear line showed an increase of 0.048˚C per annum in the annual mean temperature with a coefficient of determination of 52%. An overall increase of 1.01˚C was found between 1985 and 2006 that is from 18.054˚C to 19.064˚C as estimated by the least square regression line. The annual mean values of the daily maximum and minimum temperatures also depicted warming trends of 0.068˚C and 0.047˚C per year. The MannKendall rank statistics test also confirmed the warming trends of the local atmospheric environment of Abha city.
The seasonal warming trends showed the highest temperature increases in the month of February and the lowest in August. These increases were recorded in the monthly mean of daily maximum temperatures. However, the highest warming rates in the monthly mean of daily minimum were observed in November and the lowest rates in February. Lastly, the highest rates of warming in case of monthly mean of daily mean temperatures were observed in the month of April and the minimum in August.
Over 1985 to 2006 period, Abha data showed a slight increase (0.16 nights per year) in the frequency hot nights (minimum temperature > 20˚C) with almost zero frequency of hot days (maximum temperature ≥ 35˚C). On the other hand a decrease of 1.39 nights per year was observed in the frequency of cold nights (daily minimum temperature ≤ 15˚C). Similarly, a decrease of 1.15 days per year was observed in the frequency of cold days (daily maximum temperature ≤ 20˚C). This trend in the frequencies also confirms the heating of the local environment in and around Abha city.
6. Acknowledgements
The author wishes to acknowledge the support of The Research Institute of King Fahd University of Petroleum and Minerals, Dhahran, Saudi Arabia.
REFERENCES
- N. Nicholls and D. Collins, “Observed Climate Change in Australia over the Past Century,” Energy & Environment, Vol. 17, No. 1, 2006, pp. 1-12. doi:10.1260/095830506776318804
- C. K. Folland, T. R. Karl, J. R. Christy, R. A. Clark, G. V. Gruza, J. Jouzel, M. E. Mann, J. Oerlemans, M. J. Salinger and S. W. Wang, “Observed Climate Variability and Change 2001: The Scientific Basis,” In: G. T. Houghton, Y. Ding, D. J. Griggs, M. Noguer, P. J. van de Linden, X. Dai, K. Maskell and C. A. Johnson, eds, Contribution of Working Group I to the Third Assessment Report of the Intergovernmental Panel on Climate Change, Cambridge University Press, Cambridge, 2001, pp. 99-181.
- IPCC, “Climate Change 2001 Synthesis Report,” Cambridge University Press, Cambridge, 2001.
- Vicente de Paulo Rodrigues da Silva, “On Climate Variability in Northeast of Brazil,” Journal of Arid Environments, Vol. 58, No. 4, 2004, pp. 575-596. doi:10.1016/j.jaridenv.2003.12.002
- T. Tonkaz and M. Cetin, “Effects of Urbanization and Land-Use Type on Monthly Extreme Temperatures in a Developing Semi-Arid Region, Turkey,” Journal of Arid Environments, Vol. 68, No. 1, 2007, pp. 143-158. doi:10.1016/j.jaridenv.2006.03.020
- C. Serra, A. Burgueno and X. Lana, “Analysis of Maximum and Minimum Daily Temperatures Recorded at Fabra Observatory (Barcelona, Spain) in the Period 1917- 1998,” International Journal of Climatology, Vol. 21, No. 5, 2001, pp. 617-636. doi:10.1002/joc.633
- S. Nizamuddin, “Spatial and Temporal Variations of Rainfall over India,” Fifth International Conference on Precipitation, Crete, 14-16 June 1995.
- H. M. Hasanean, “Fluctuations of Surface Air Temperature in the East Mediterranean,” Theoretical and Applied Climatology, Vol. 68, No. 1-2, 2001, pp. 75-87.
- H. M. Kafle and H. J. Bruins, “Climate Trends in Israel 1970-2002: Warmer and Increasing Aridity Inland,” Climatic Change, Vol. 96, No. 1-2, 2009, pp. 63-77. doi:10.1007/s10584-009-9578-2
- A. Toreti and F. Desiato, “Temperature Trend over Italy from 1961-2004,” Theoretical and Applied Climatology, Vol. 91, No. 1-4, 2008, pp. 51-58. doi:10.1007/s00704-006-0289-6
- M. Rebetez and M. Reinhard, “Monthly Air Temperature Trends in Switzerland 1901-2000 and 1975-2004,” Theoretical and Applied Climatology, Vol. 91, No. 1-4, 2008, pp. 27-34. doi:10.1007/s00704-007-0296-2
- M. Turkes, U. M. Sumer and G. Kılıc, “Observed Changes in Maximum and Minimum Temperatures in Turkey,” International Journal of Climatology, Vol. 16, No. 4, 1996, pp. 463-477.
- M. Kadıoglu, “Trends in Surface Air Temperature Data over Turkey,” International Journal of Climatology, Vol. 17, No. 5, 1997, pp. 511-520. doi:10.1002/(SICI)1097-0088(199704)17:5<511::AID-JOC130>3.0.CO;2-0
- N. A. Elagib and M. G. Mansell, “Recent Trends and Anomalies in Mean Seasonal and Annual Temperatures over Sudan,” Journal of Arid Environment, Vol. 45, No. 3, 2000, pp. 263-288. doi:10.1006/jare.2000.0639
- P. Domonkos, “Temporal Accumulations of Extreme Daily Mean Temperature Anomalies,” Theoretical and Applied Climatology, Vol. 68, No. 1-2, 2001, pp. 17-32. doi:10.1007/s007040170050
- M. Kadıoglu and L. Saylan, “Trends in Growing Degree-Days in Turkey,” Water Air and Soil Pollution, Vol. 126, No. 1-2, 2001, pp. 83-96.
- H. A. Nasrallah, E. Nieplova and E. Ramadan, “Warm Season Extreme Temperature Events in Kuwait,” Journal of Arid Environments, Vol. 56, No. 2, 2004, pp. 357-371. doi:10.1016/S0140-1963(03)00007-7
- M. Turkes, U. M. Sumer and I. Demir, “Re-Evaluation of Trends and Changes in Mean, Maximum and Minimum Temperatures of Turkey for the Period 1929-1999,” International Journal of Climatology, Vol. 22, No. 8, 2002, pp. 947-977.
- N. A. Elagib and A. S. Addin Abdu, “Climate variability and aridity in Bahrain,” Journal of Arid Environment, Vol. 36, No. 3, 1997, pp. 405-419. doi:10.1006/jare.1996.0237
- F. M. Alkolibi, “Possible Effects of Global Warming on Agriculture and Water Resources in Saudi Arabia: Impacts and Responses,” Climatic Change, Vol. 54, No. 1-2, 2002, pp. 225-245. doi:10.1023/A:1015777403153
- M. Freiwana and M. Kadioglub, “Climate Variability in Jordan,” International Journal of Climatology, Vol. 28, No. 1, 2008, pp. 69-89. doi:10.1002/joc.1512
- H. B. Mann, “Nonparametric Tests against Trend,” Econometrica, Vol. 13, No. 3, 1945, pp. 245-259. doi:10.2307/1907187
- M. G. Kendall, “Rank Correlation Methods,” Griffin, London, 1975.
- C. Koutsikopoulos, P. Beillois, C. Leroy and F. Taillefer, “Temporal Trends and Spatial Structures of the Sea Surface Temperature in the Bay of Biscay,” Oceanologica Acta, Vol. 21, No. 2, 1998, pp. 335-344.