Advances in Aging Research
Vol. 2 No. 4 (2013) , Article ID: 37618 , 6 pages DOI:10.4236/aar.2013.24016
Handgrip strength and falls in community-dwelling Egyptian seniors*
![]()
Geriatrics and Gerontology Department, Ain Shams University, Cairo, Egypt; #Corresponding Author: farida_mf@yahoo.com
Copyright © 2013 Hoda Wahba et al. This is an open access article distributed under the Creative Commons Attribution License, which permits unrestricted use, distribution, and reproduction in any medium, provided the original work is properly cited.
Received 20 June 2013; revised 20 July 2013; accepted 27 July 2013
Keywords: Handgrip Strength; Fallers; Falls; Seniors; Dynamometer
ABSTRACT
Purpose: To establish a relationship between falls and handgrip strength (GS) in communitydwelling senior citizens in Egypt. Subjects: Crosssectional study enrolling 132 subjects, all ≥60 years old. Materials and Methods: History of falls in the past year and their number as well as GS measurement in both hands using Baseline® pneumatic squeeze handheld dynamometer. Results: There is a highly significant difference between the GS of fallers and non-fallers in both hands (P = 0.000). There is a highly significant negative correlation between the mean GS and the number of falls (P = 0.003). There is a highly significant positive correlation between GS of the right hand with the number of falls (R = 0.226, P = 0.009), as for the correlation with the left GS it was a weaker positive correlation (R = 0.209, P = 0.16). Conclusion: Seniors with history of falls have a lower GS in both dominant and nondominant hands and it is directly related to the number of falls. GS is decreased in senior fallers even if within the normal range.
1. INTRODUCTION
Falls often occur in elderly persons. Approximately 30% of the community-dwelling elderly, aged 65 years and over, fall at least once per year, and about 15% fall two or more times per year [1], and up to 60% of nursing home residents fall each year; one half of these fallers have multiple episodes [2]. Prevention of falls is mandatory, because of the severe consequences of falls, such as fractures and other injuries, disability, and fear of falling [3]. Moreover, among older adults, falls are the leading cause of injury deaths [4]. It is important to identify individuals most at risk of falling, because they should be considered with priority for receiving targeted exercise interventions aimed at reducing the incidence of falls [5]. Important predictors include poor balance, muscle weakness, low level of physical activity, and poor physical performance [6].
The measurement of GS is inexpensive and easily carried out even by trained survey interviewers in nonclinical settings [7]. Therefore, several studies attempted to establish whether this measurement can be used to predict falls. This includes the study of Stella and colleagues who developed fall risk profiles including predictors that are easily measurable, in short time, and with simple tools. They found that GS predicted recurrent falling as well as more sophisticated measures as leg extension strength [8]. Moreover, other studies found that the reliability of handgrip strength was even higher than that for leg extension strength [9,10]. Similarly, Pluijm et al., in 2006 stated that “handgrip strength is thought to reflect general body strength and has been used as predictor of falls in epidemiological studies” [11].
To be able to globalize conclusions from studies and to implement guidelines, worldwide studies need to be performed. The co-authors could not find studies in the Middle-East on falls or handgrip assessment. The Egyptian population is unique due to both intrinsic and extrinsic factors. Intrinsic factors unique to each population include genetic factors, psycho-social development and diversity of the socio-economic status. As for the extrinsic factors there is the defective infrastructure of the streets, hospitals, shopping areas etc. that does not consider the special needs of elderly or aim to decrease risk of falls. Moreover, the absence, and not merely the deficiency, of structured geriatric oriented insurance and rehabilitation programs makes it quite impossible to assess, follow up and treat falls victims.
The objective of this study was to establish the relation between handgrip strength; using Baseline® pneumatic squeeze handheld dynamometer and falls in the community-dwelling senior citizens in Cairo, Egypt.
2. METHODOLOGY
2.1. Sample and Methods
The study was approved by the ethical committee of the Faculty of Medicine, Ain Shams University, Cairo, Egypt.
The current study is a cross-sectional one enrolling community-dwelling seniors. All consecutive patients attending the outpatient clinics of Ain Shams University Hospitals were enrolled in the study during the year between March 2011 and March 2012, on 3 days of the week; excluding those having any of the exclusion criteria or refusing to participate.
A written informed consent was taken from all the participants. Assessment for all participants was done to ensure absence of any exclusion criteria which included: anomalies or deformities in the hands, diseases that cause weakness or tremors in the hands, people with cognitive impairment or depression and history of admission to acute care in the past 3 months. History of falls in the past year was taken in details.
Then, every participant was assessed using Baseline® pneumatic squeeze handheld dynamometer after giving instructions on how to use it and one trial before the assessment. All subjects were instructed to sit on the chair with a straight back, without armrest and with the feet flat on the floor, shoulder adducted and neutrally rotated, elbow flexed at 90˚, forearm in neutral position and wrist between 0˚ - 30˚of extension and between 0˚ - 15˚ of ulnar deviation, as given by the American Society of Hand Therapy [12]. The instructions were given in the same tone and volume in order to discourage the overload of instructions [13]. The subjects were instructed to initiate optimal handgrip strength (usually about 3-seconds sustained grip). To get maximum reliability of data collected, every subject was asked to squeeze the dynamometer for three times for each hand, the mean of the three trials of each hand was the measurement used in the study [14]. The mean GS was the mean calculated from the values of both hands. A rest of 60 seconds was given between each squeeze [15]. To counterbalance any order effect of the starting hand, every other subject was instructed to begin with the dominant hand. During the test, the attempts were taken while alternating right and left hands with 60 seconds rest between any two attempts to overcome fatigue. The dynamometer’s maximum force indicator was reset to zero before each trial.
2.2. Statistical Analysis
IBM SPSS statistics (V. 20.0, IBM Corp., USA, 2011) was used for data analysis. Data was expressed as mean ± SD for quantitative parametric measures in addition to both number and percentage for categorized data.
The subjects were studied as a sample that was representative of the community-dwelling seniors and analyzed by comparing two groups (normal and low GS groups) according to the normative values of handgrip strength using the Baseline® pneumatic squeeze handheld dynamometer. The cut off values used for elderly (between 60 and 85 years) were (10.74 - 12.54 PSI) in males and, (9.45 - 11.12 PSI) in females [16].
Logistic regression analysis was done to identify the predictors of mean GS. Comparison between two independent mean groups for parametric data was used (Student t test). Pearson correlation test was to study the possible association between each two variables among each group for parametric data. Chi-square test was done to study the association between each 2 variables or comparison between 2 independent groups as regards the categorized data. Analysis of variance was used for comparison between more than 2 subgroups.
The probability of error at 0.05 was considered significant, while at 0.01 and 0.001 are highly significant.
3. RESULTS
A sample of 132 subjects (of a total of 1443 clinic visitors) fulfilled the inclusion criteria and accepted to join the study. Most of the participants were in the 60 - 69 age group (69.7%). Sixty seven of the participants were males while 65 were females. 47.7% of the participants had jobs that mainly required physical effort. All subjects were right handed.
Table 1 shows the predictors of GS by logistic regression. Table 2 shows the mean values of GS in the sample as a whole and with sub-grouping according to gender and normality of GS. Table 3(a) shows the mean GS, right GS and left GS in the sample with subgrouping into fallers and non-fallers.
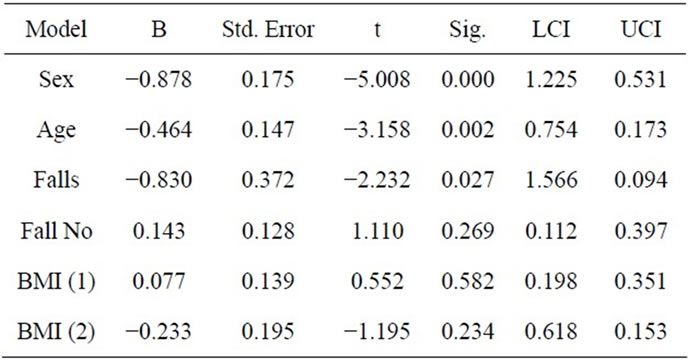
Table 1. Regression analysis for predictors of the mean GS.
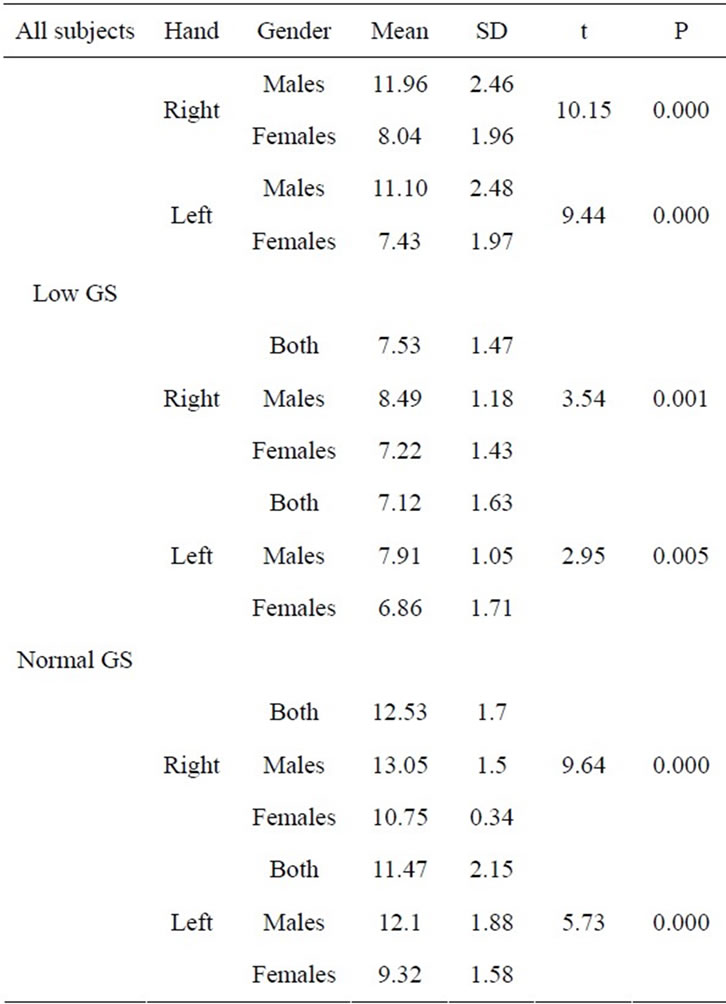
Table 2. Mean values of GS among sample and gender difference.
In the low GS group there were 18 cases with history of falls while the normal GS group had only 4 subjects with history of falls. The 18 fallers in the low GS group showed no significant difference in handgrip strength from the non-fallers (Table 3(b)). Table 4 shows the mean GS in fallers and non-fallers subdivided according to the number of falls. Using multiple comparison (LSD) a significant difference was found between the GS of the left hand of non-fallers (0) and those that fell twice (P = 0.03), and between those who fell twice and thrice (P = 0.04), and between those who fell twice and four times (P = 0), and between those who fell twice and more than four times (P = 0).
On the other hand, the 4 fallers in the normal GS group showed highly significant lower handgrip strength of both the right and left hands when compared to the non-fallers in the same group (controls) (Table 3(b)).
The mean GS in the whole sample was 9.66 PSI SD ± 2.86. The mean GS was significantly negatively correlated to the number of falls (R = −0.254, P = 0.003).
When correlating the GS of the right hand with the number of falls in the whole sample there was a highly significant positive correlation (R = 0.226, P = 0.009), as for the correlation with the left GS it was a weaker
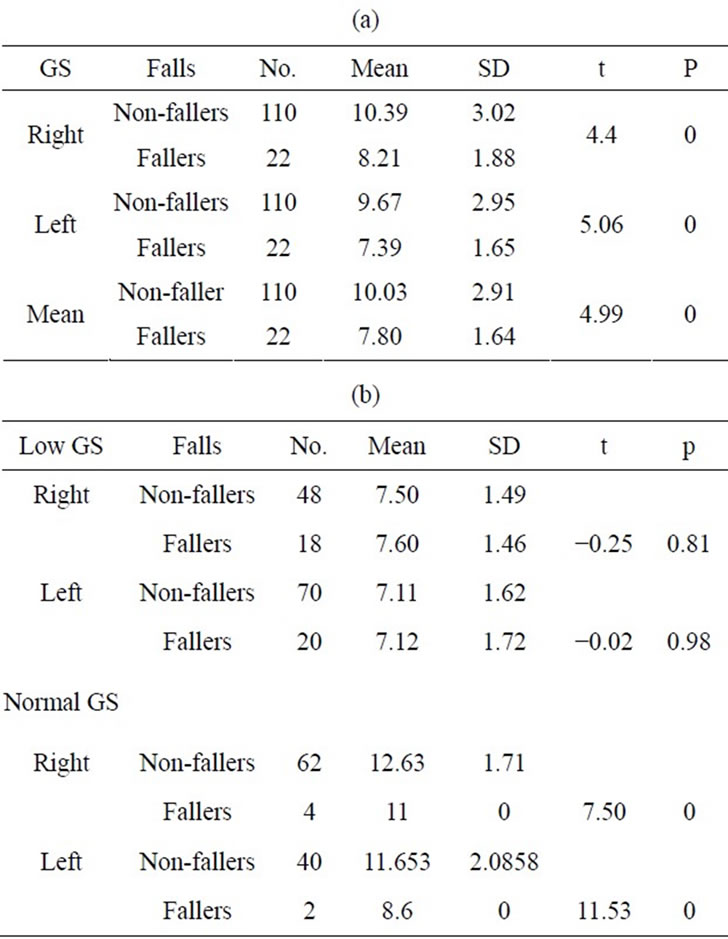
Table 3. (a) Mean GS in both hands among fallers (1) and non-fallers (0) in the whole sample; (b) Mean GS in both hands among fallers (1) and non-fallers (0).
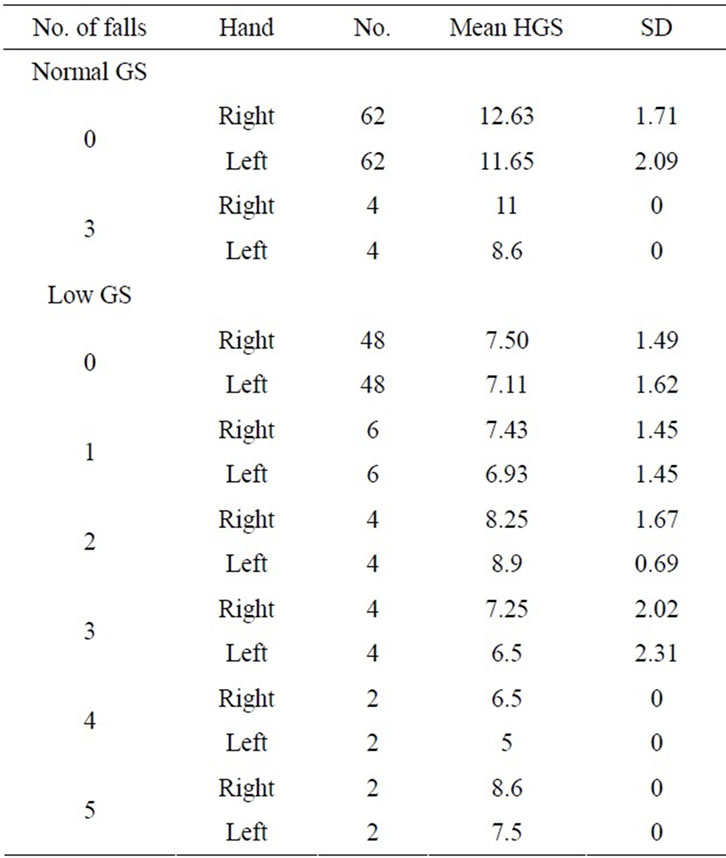
Table 4. The mean handgrip strength of fallers (1 = once, 2 = twice, 3 = thrice, 4 = four times, 5 = more than four times) and non-fallers (0) in both groups.
positive correlation (R = 0.209, P = 0.16). Age was not significantly correlated to the number of falls (R = 0.16, P = 0.857).
4. DISCUSSION
The use of GS is a single, simple and inexpensive method for assessing general muscle strength and function [17].
Many studies have established the relation between falls and handgrip strength in the elderly using the Jamar® dynamometer which is widely used due its validated normative values. The authors of this study found the Baseline® pneumatic squeeze handheld dynamometer easier to use and much lighter than the Jamar® dynamometer and hence more applicable in the primary care setting later on for routine use (Figure 1). The normative values of the Baseline® pneumatic squeeze handheld dynamometer had been published by Hamza et al., 2013. The current study was aiming to ascertain that the same relationship can be elicited using another dynamometer and in another population, the
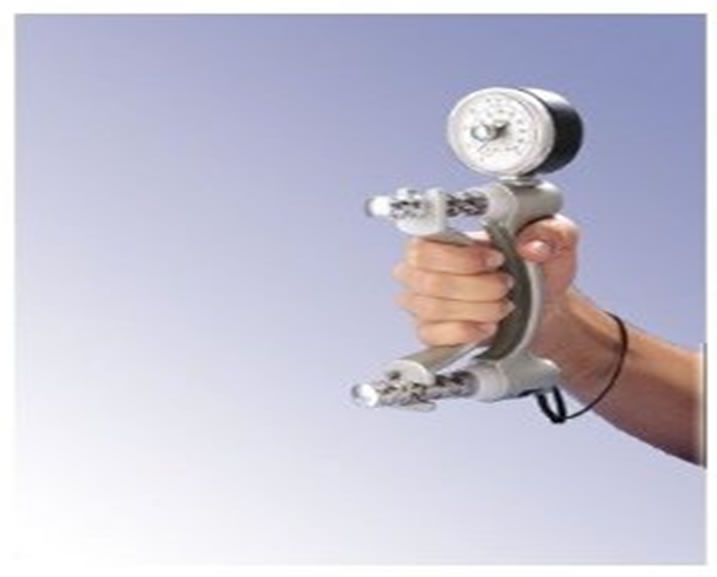
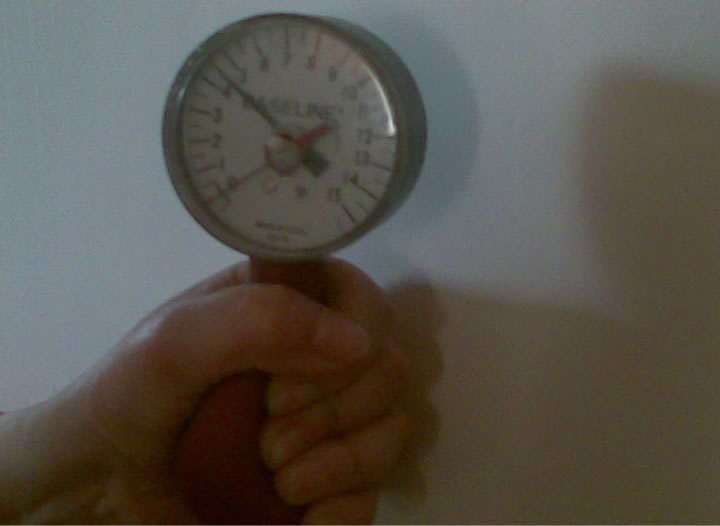
Figure 1. Jamar dynamometer versus the Baseline pneumatic dynamometer.
Egyptian population, that has never been studied before. The authors of this study have been disappointed in not having local findings that can support the global data as implementing international guidelines with no available regional studies is impractical. Therefore, the study recruited 132 subjects most of which were in the 60 - 69 age group (69.7%). Sixty seven of the participants were males while 65 were females.
When examining the demographic data of the sample the following results have come to light. By logistic regression the significant predictors of GS were age, sex and presence of falls. Yet age was not significantly correlated to the number of falls (P = 0.857). This points out that increasing age increases the risk of falls while probably other factors control the frequency of falls.
There was a gender difference where females produced lower handgrip strength in both hands in both groups. The sex difference was explained in literature by the higher levels of androgenic hormones [18], the greater muscle mass [19], greater height and weight in men [20] and greater workload that men may perform [21].
There is disagreement regarding whether there is a consistent difference in handgrip strength between dominant and non-dominant hands. The current study revealed a highly significant difference between the GS of both hands with higher results in the right hand (dominant). This was evident when comparing both hands in the whole sample and when they were divided into low and normal GS groups. This agrees with Bansal, 2005 and Budziareck et al., 2008, but disagrees with Petersen et al., 1989, results which showed higher GS values in the non-dominant hand [22-24]. The inconsistent results regarding right and left hand grips have surfaced when the results were analyzed in fallers versus non-fallers.
The results revealed there is a highly significant difference between the GS of fallers versus non-fallers. This was evident when studying the GS of the right hand, left hand and mean of both hands in fallers versus non-fallers in the entire sample and in the normal GS group. Strangely this was not evident in the low GS group (Table 3(a)).
Correlating the GS of the right hand with the number of falls in the whole sample there was a highly significant positive correlation (R = 0.226, P = 0.009), as for the correlation with the left GS it was a weaker positive correlation (R = 0.209, P = 0.16). The discrepancy between the results of both hands disappeared when comparing the mean GS and the number of falls revealed a highly significant negative correlation (P = 0.003).
When subdividing the sample according to GS, the results show significant difference in handgrip strength as the frequency of falls increases in the low GS group and in relation to the left handgrip strength only. This disagrees with the above results in the whole sample where only the right GS was correlated to the number of falls. On reviewing the data of the participants the left hand was the non-dominant for these subjects. As we have mentioned above studies have not agreed on the importance or predictive value of different hands however within this study challenging results have surfaced.
When having a closer look by examining the subjects according to their GS the following results unveiled; the 18 fallers in the low GS group showed no significant difference in handgrip strength from the non-fallers when compared as two ends of a spectrum. Detailed statistical analysis showed a significant difference between the GS of the left hand of non-fallers (0) and those that fell twice (2) (P = 0.03), and between those who fell twice and thrice (3) (P = 0.04), and between those who fell twice and four times (4) (P = 0), and between those who fell twice and more than four times (5) (P = 0).
On the other hand, the 4 fallers (1) in the normal GS group showed highly significant lower handgrip strength of both the right and left hands when compared to the non-fallers (0) in the same group (normal handgrip) (Table 4).
The study showed lower handgrip strength in fallers of the normal GS group but not in the low GS group which could conclude that handgrip strength has only a limited predictive value of those at risk of falls if they at baseline have low GS. On the other hand a decline in GS on a routine checkup may alarm us of an increased risk of falls. Hence, normal GS doesn’t necessarily mean a low risk of falls unless the baseline GS of the patient is known. The small number of fallers due to underreporting has limited the firm confirmation of the importance of GS relation to falls hence warranting further studies in the future. The authors of this study also believe that more detailed studies could reveal different outcomes in different genders given there is a baseline difference in GS.
The authors of this study have reached several conclusions yet believe that further studies are needed to unravel the contradicting and unexplainable diversity in GS in relation to hand dominance and falls, incidence and frequency, especially due to the absence of left hand dominance. It is worth mentioning that part of the hand dominance in Egypt is enforced by the cultural upbringing that encourages the use of the right hand. We also believe that due to the continuous progress in the implementation of GS testing in the primary care clinics it is important to widen the scope of dynamometers used.
5. CONCLUSION
Seniors with history of falls have a lower GS in both dominant and non-dominant hands and it is directly related to the number of falls.
REFERENCES
- Tromp, A.M., Smit, J.H., Deeg, D.J.H., Bouter, L.M. and Lips, P. (1998) Predictors for falls and fractures in the longitudinal aging study Amsterdam. Journal of Bone and Mineral Research, 13, 1932-1939. http://dx.doi.org/10.1359/jbmr.1998.13.12.1932
- Hirsch, C.H., Sommers, L., Olsen, A., Mullen, L. and Winograd, C.H. (1990) The natural history of functional morbidity in hospitalized older patients. Journal of the American Geriatrics Society, 38, 1296-1303.
- Tinetti, M.E. and Powell, L. (1993) Fear of falling and low self-efficacy: A case of dependence in elderly persons. The Journals of Gerontology, 48, 35-38. http://dx.doi.org/10.1093/geronj/48.Special_Issue.35
- Hornbrook, M.C., Stevens, V.J., Wingfield, D.J., Hollis, J.F., Greenlick, M.R. and Ory, M.G. (1994) Preventing falls among community-dwelling older persons: Results from a randomized trial. The Gerontologist, 34, 16-23. http://dx.doi.org/10.1093/geront/34.1.16
- Pijnappels, M., Van der Burg, P.J.C., Reeves, N.D. and Van Dieën, J.H. (2008) Identification of elderly fallers by muscle strength measures. European Journal of Applied Physiology, 102, 585-592. http://dx.doi.org/10.1007/s00421-007-0613-6
- Tromp, A.M., Pluijm, S.M., Smit, J.H., Deeg, D.J.H., Bouter, L.M. and Lips, P. (2001) Fall risk screening test: A prospective study on predictors for falls in community-dwelling elderly. Journal of Clinical Epidemiology, 54, 837-844. http://dx.doi.org/10.1016/S0895-4356(01)00349-3
- Andersen-Ranberg, K., Petersen, I., Frederiksen, H., Mackenbach, J.P. and Christensen, K. (2009) Cross-national differences in grip strength among 50+-year-old Europeans: Results from the SHARE study. EJA, 6, 227- 236.
- Stel, V.S., Smit, J.H., Pluijm, S.M.F. and Lips, P. (2003) Balance and mobility performance as treatable risk factors for recurrent falling in older persons. JCE, 56, 659- 668.
- Greig, C.A., Young, A., Skelton, D.A., Pippet, E., Butler, F.M. and Mahmud, S.M. (1994) Exercise studies with elderly volunteers. Age and Ageing, 23, 185-189. http://dx.doi.org/10.1093/ageing/23.3.185
- Merlini, L., Mazzone, E.S., Solari, A. and Morandi, L. (2002) Reliability of handheld dynamometry in spinal muscular atrophy. Muscle and Nerve, 26, 64-70. http://dx.doi.org/10.1002/mus.10166
- Pluijm, S.M.F., Smit, J.H., Tromp, E.A.M., Stel, V.S., Deeg, D.J.H., Bouter, L.M. and Lips, P. (2006) A risk profile to identify community-dwelling elderly at high risk for recurrent falling: Results of a three-year prospective study. Osteoporosis International, 17, 417-425. http://dx.doi.org/10.1007/s00198-005-0002-0
- Desrosiers, J., Bravo, G., Hébert, R. and Dutil, E. (1995) Normative data for grip strength of elderly men and women. American Journal of Occupational Therapy, 49, 637-644. http://dx.doi.org/10.5014/ajot.49.7.637
- Johansson, C.A., Kent, B.E. and Shepard, K.F. (1983) Relationship between verbal command volume and magnitude of muscle contraction. Physical Therapy, 63, 1260- 1265.
- Mathiowetz, V., Weber, K., Volland, G. and Kashman, N. (1984) Reliability and validity of grip and pinch strength evaluations. JHS, 9, 222-226. http://dx.doi.org/10.1016/S0363-5023(84)80146-X
- Trossman, P.B. and Li, P.W. (1989) The effect of the duration of inter-trial rest periods on isometric grip strength performance in young adults. Occupational Therapy Journal of Research, 9, 362-378.
- Hamza, S.A., Wahba, H.M.F. and Hegazy, M.M. (2013) Assessment of handgrip strength variables in a population of Egyptian elderly. MEJAA, 3, 19-23.
- Aadahl, M., Beyer, N., Linneberg, A., Thuesen, B.H. and Jørgensen, T. (2011) Grip strength and lower limb extension power in 19 - 72-year-old Danish men and women: The health 2006 study. BMJ Open, 1, Article ID: e000192. http://dx.doi.org/10.1136/bmjopen-2011-000192
- Graafmans, W.C., Ooms, M.E., Hofstee, H.M.A., Bezemer, P.D., Bouter, L.M. and Lips, P. (1996) Falls in the elderly: A prospective study of risk factors and risk profiles. American Journal of Epidemiology, 143, 129-136. http://dx.doi.org/10.1093/oxfordjournals.aje.a008690
- Page, S.T., Amory, J.K., Bowman, F.D., Anawaltm, B.D., Matsumoto, A.M., Bremner, W.J. and Tenover, J.L. (2005) Exogenous testosterone alone or with finasteride increases physical performance, grip strength, and lean body mass in older men with low serum testosterone. JCEM, 90, 1502-1510.
- Kallman, D.A., Plato, C.C. and Tobin, J.D. (1990) The role of muscle loss in the age-related decline of grip strength: Cross-sectional and longitudinal perspective. The Journals of Gerontology, 45, 82-88. http://dx.doi.org/10.1093/geronj/45.3.M82
- Kuh, D., Hardy, R., Butterworth, S., Okell, L., Wadsworth, M., Cooper, C. and Sayer, A.A. (2006) Developmental origins of midlife grip strength: Findings from a birth cohort study. Journals of Gerontology Series A: Biological Sciences and Medical Sciences, 61, 702-706. http://dx.doi.org/10.1093/gerona/61.7.702
- Dhara, P.C., Sujaya, D.E., Pal, A., Sengupta, P. and Roy, S. (2009) Assessment of handgrip strength of orthopedically challenged persons affected with upper extremity. Life Science Journal, 1, 121-127.
- Bansal, N. (2005) A study to analyze the effect of hand dominance on grip strength. Sirinvas College of Physiotherapy Mangalore, 2, 4-6.
- Budziareck, M.B., Duarte, R.R.P. and Barbosa-Silva, M.C.G. (2008) Reference values and determinants for handgrip strength in healthy subjects. Clinical Nutrition, 27, 357-362. http://dx.doi.org/10.1016/j.clnu.2008.03.008
NOTES
*Conflict of interest: None.