Low Carbon Economy
Vol.3 No.3(2012), Article ID:22483,4 pages DOI:10.4236/lce.2012.33007
International Technology Spillover, Energy Consumption and CO2 Emissions in China
![]()
School of Economy & Trade, Hunan University, Changsha, China.
Email: rihui.lei@gmail.com
Received May 9th, 2012; revised June 20th, 2012; accepted July 3rd, 2012
Keywords: Technology Spillover; Energy Consumption; CO2 Emissions
ABSTRACT
Based on autoregressive distributed lag model, we empirically study the interrelationship between international technology spillover, energy consumption and CO2 emissions by using time series data covering the period 1960-2008. The results show that international technology spillover, technology transformation and domestic R&D input cut down CO2 emissions. R&D input has both direct and indirect effect on the reduction in CO2 emissions. On the one hand, R&D input promotes domestic innovation and accelerates transformation, absorption and utilization of the technology from forerunners. On the other hand, R&D input reduces CO2 emissions by rising energy efficiency. Energy consumption increases CO2 emissions.
1. Introduction
With China’s extraordinary economic growth, energy consumption and CO2 emissions have been increasing dramatically. China has been the second largest energy consumption country in the world, where the total energy consumption rose from 302 million tons of standard coal equivalent in 1960 to 2850 million tons in 2008. International Energy Agency (IEA) predicted that in 2030 China would emit twice as much carbon dioxide as that in 2007, provided that CO2 emissions increase by 2.9% each year [1]. In the medium and long term, China’s CO2 emissions with a significant upward trend may even exceed the amount of the provisions of the Kyoto Protocol. Investigating on the influencing factors of CO2 emissions and their interactive mechanism has become a particular concern among economists.
The purpose of this paper is to analyze the impacts of international technology spillover and energy consumption on CO2 emissions, using time-series data covering the period 1960-2008 in China. Based on endogenous economic growth theory and environmental economics, the paper introduces international technology spillover into an analytic framework on CO2 emissions and empirically investigates the influences of international technology spillover on long-run equilibrium and shortterm fluctuations of CO2 emissions.
The paper is organized as follows: Section 2 illustrates a measuring model and analytic framework on CO2 emissions; Section 3 describes the time series data utilized in the empirical work and discusses its main results; Section 4 concludes the paper.
2. The Model
Following the contributions of Romer (1990) to the development of the new growth theory, this paper adopts energy consumption to Cobb-Douglas production function [2]. The amended endogenous economic growth model is:
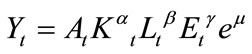 (1)
(1)
where, A denotes total factor productivity (TFP). E denotes energy consumption. A large number of literatures on endogenous economic growth emphasizes the important impetus of domestic independent innovation on technology progress [2,3]. Growth rate of TFP depends on growth speed of R&D stock. There is a decreasing effect in R&D output. With R&D input increasing, ascent occurs in technological level and in degree of product diversification, but product innovation is increasingly difficult.
Under open economic condition, a country’s technology progress not only depends on domestic R&D input, but also benefits from international technology spillovers [4]. International technology spillover overflows to the host country mainly through three paths: import trade, inputting foreign direct investment and foreign patent applications, which promotes local technological progress. In order to maintain technology monopoly advantage, forerunners strongly inhibits the spillovers of their advanced technology. Therefore, involuntary spread of technology from the forerunners, videlicet, international technology spillovers or R&D spillovers, is important for host countries to accelerate technological progress. In this paper, we assume FDI as the only path of international technology spillovers. Griffith et al. considered that R&D activities had direct and indirect effects on technological progress. On the one hand, R&D activities promote technological progress directly by increasing R&D stock. On the other hand, R&D activities enhance technological absorptive capacity of the enterprise, which accelerates the introduction, absorption and imitation of advanced technology from the forerunners [5]. Therefore, economic growth model of total factor production rate is defined as:
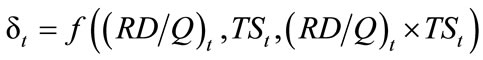 (2)
(2)
where, δt represents growth rate of TFP. (RD/Q)t represents R&D intensity. RDt denotes R&D input. Qt represents product categories. TSt denotes international technology spillovers. (RD/Q)t × TSt denotes international technology absorptive capacity of the host country in domestic R&D activities.
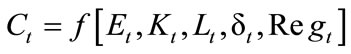
The primary factors that influence scales of CO2 emissions is per capita energy consumption and per capita real output [6,7]. The CO2 emissions model is:
 (3)
(3)
Our dependent variable, Ct represents CO2 emissions. Cole et al. considered the correlation between technology level and greenhouse gas emissions. Countries with backward technology have high levels of greenhouse gas emissions resulting from low efficiency of energy using. High-productivity countries significantly reduce greenhouse gas emissions through two channels: One channel is to ameliorate production process and lower input per unit of output by technology; the other channel is to reduce the energy consumption per unit of output by advanced energy-saving means and high-efficient operation capacity. Besides, clean energy is developed more positively and the enterprises respond more sensitively to energy saving and emission reduction policies in technological advanced countries [8]. Substituting Yt in Equation (3) with Equation (1), we can get:
 (4)
(4)
where, dummy variable Regt denotes the stringency of environmental protection policy. In equilibrium, substituting δt in Equation (4) with Equation (2) and formulating our CO2 emissions function, then we can define CO2 emissions as:
 (5)
(5)
Our estimating equation originates from Equation (5),
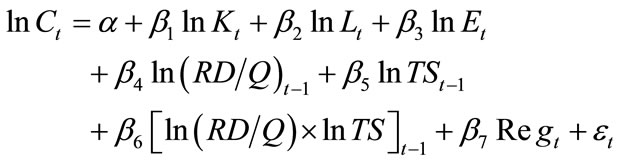 (6)
(6)
3. Data and Econometrics
3.1. Data Description
To test our model, we use time series data covering the period 1960-2008 in China, published by the China’s National Bureau of Statistics (NBS). All monetary variables are deflated to 1960 prices by a GDP deflator. Variable considerations are as follows:
1) Greenhouse gas emission indicator: Ct, CO2 emissions, is defined as per capita CO2 emissions from cement manufacture and fossil-fuel burning such as coal, oil and natural gas. We measure greenhouse gas emissions by using data from World Development Indicators (WDI).
2) Factor input indicator: Kt denotes physical capital stock. Based on 5% capital depreciation rate, we estimate capital stock by using perpetual inventory method. Lt denotes the number of labor. Et denotes per capita energy consumption. The data on energy consumption is reported in China Energy Statistical Yearbook.
3) R&D intensity: We measure (RD/Q)t by actual R&D input divided by the degree of product diversification. The product diversification indicators are Y, AL and AHL. Where, H represents average years of education.
4) International technology spillover: TSt denotes Imported FDI technology spillovers. We pick up the top ten countries with the largest accumulated amount of actual FDI to China in the period 1960-2008 and use LP method to calculate the foreign R&D capital stock which is embodied in the imported FDI technology spillovers. Data on FDI to China from the ten countries is reported by China Foreign Economic and Trade Statistical Yearbook and data source of the ten countries’ GDP is World Economic Outlook Database.
3.2. Equations Empirical Results
Autoregressive distributed lag approach doesn’t demand all variables be of the same order of integratedness, but the variables’ order of integratedness not be more than 1. Unit root tests on the variables in the equation, including lnC, lnE, lnK, lnL, lnRD/Q, lnTS and lnRD/Q × lnTS, have revealed that lnK, lnRD/Q, lnRD/Q × lnTS at least at the 5% level of significance are stationary series, and the rest variables are I(1).
With the assistance of Microfit 4.0 software, we use the bound test to determine whether there is a cointegration among series. According to AIC and SBC criteria, the optical lag order is 1. The results of bound test are presented as:
We could see from Table 1 that the F statistic of the regression equation is 5.4397. According to the critical value provided by Pesaran, the F statistic exceeds 4.71, upper bound at the 5% level of significance. Therefore, the null hypothesis of not existing long-run equilibrium relationship is rejected, which means there is a cointegration between variables.
The above tests demonstrate that there is a cointegration between the chosen variables. Then we estimate Equation (6) under three measurement criteria of R&D intensity. Autoregressive distributed lag model I is estimated on condition that RD/Q is equal to RD/Y; Autoregressive distributed lag model II is estimated on condition that RD/Q is equal to RD/AL; Autoregressive distributed lag model III is estimated on condition that RD/Q is equal to RD/AHL. The results are as follows:
The above results have shown a significantly positive correlation between energy consumption and carbon dioxide emissions, which is consistent with the test results of Liu (2005). The fluctuation range of coefficient estimates is around 1. To take one step ahead, Wald test with null hypothesis β1 = 1 shows that the null hypothesis at the 10% level of significance cannot be rejected, which validates that the elasticity between energy consumption and carbon dioxide emissions is 1 and there is a unit elasticity between energy consumption and CO2 emissions. Tables 2-4 lead us to believe: no matter under what measurement criterion of R&D intensity, there is no significant correlation between labor input and carbon dioxide emissions; there is a significantly positive correlation between capital input and carbon dioxide emissions

Table 1. Results of bound test.
which means growth in physical capital input leads to growth in energy consumption, and thus more greenhouse gas is emitted; labor input, comparing with physical capital input, is relatively cleaner, therefore, labor-intensive products generally fall into the clean product category and capital-intensive products into the contaminating product category.
In agreement with the theoretical expectations, both direct-channel and indirect-channel technological progress give rise to reduction in CO2 emissions. Results in the tables show that technological progress in the channel of domestic R&D puts a palpable curb on carbon dioxide emissions and the range of coefficient estimation is −0.11 to −0.26. Domestic R&D input directly promotes utilization rate of production factors, increases energy efficiency and reduces CO2 emissions. What’s more, indirect-channel technological progress also reins in carbondioxide emissions. The coefficient of interaction term lnRD/Q × lnTS reveals that the estimate of effect of in ternational technology spillovers on CO2 emissions is negative, on the average, carbon dioxide emission elasticity of absorption of international advanced technology is −1.31 to −3.37. This means absorption and application of international advanced technology grants countries with backwardness advantage, such as China, an
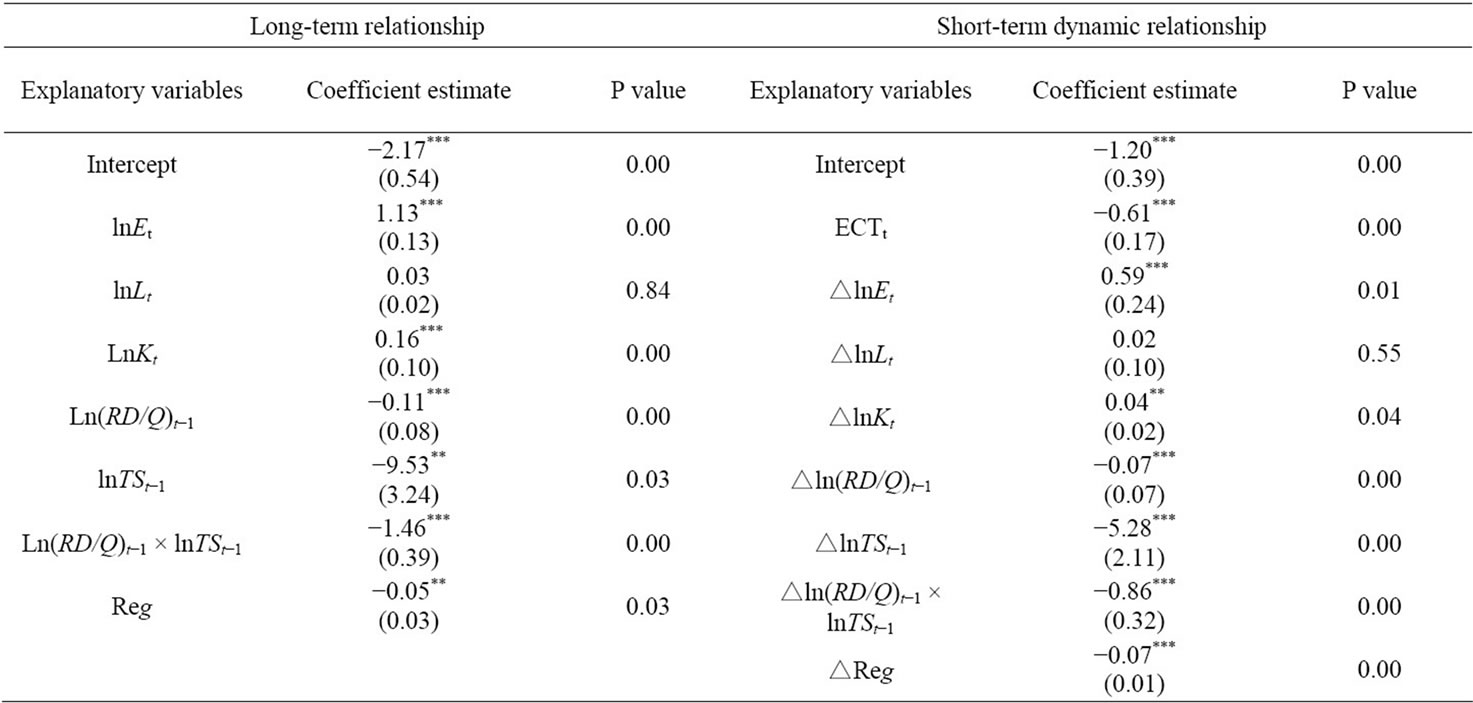
Table 2. Parameter estimates of autoregressive distributed lag model I.
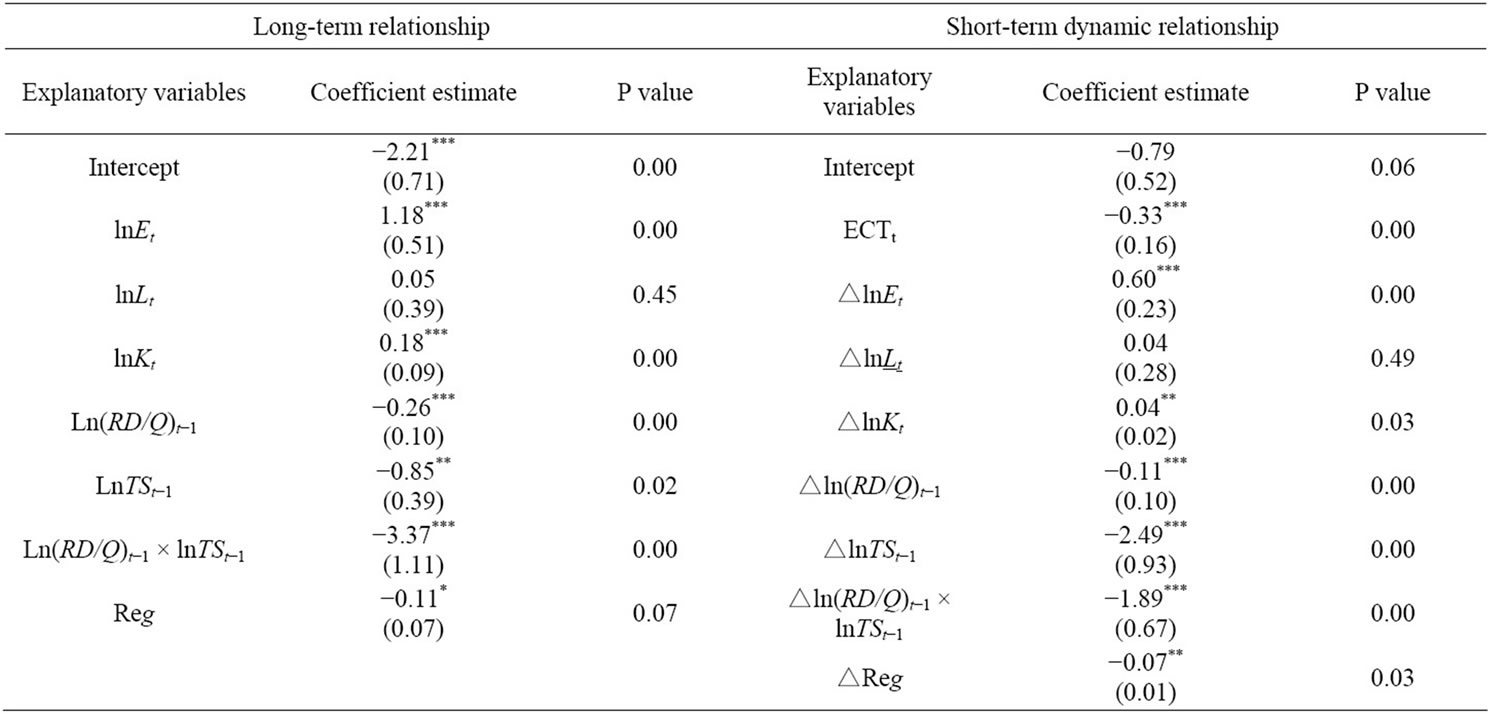
Table 3. Parameter estimates of autoregressive distributed lag model II.
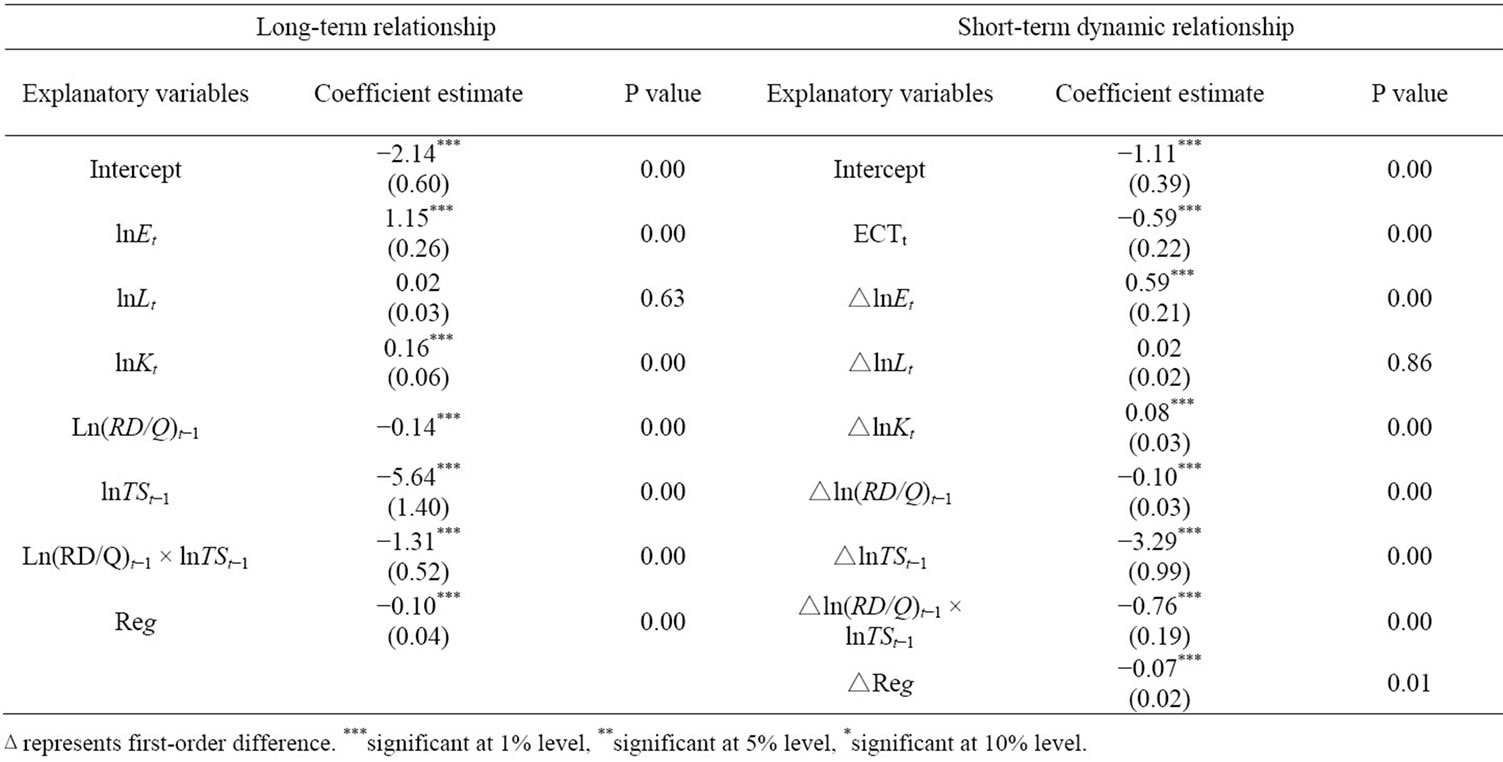
Table 4. Parameter estimates of autoregressive distributed lag model III.
opportunity of saving energy and reducing emissions. International technology spillover, of which China’s ecological environment is a beneficiary, elevates domestic technological level and reduces carbon dioxide emissions. The coefficient of dummy variable Regt is negative and significant at 10% level, which means Chinese environmental protection policy in force is effective.
Further we analyze the relationship between variables in short-term changes. There is also no significant correlation between labor input and carbon dioxide emissions. Coefficient signs of variables are basically in line with the estimates of the long-term CO2 emission equation. The range of short-term estimates, however, is smaller than that of long-term estimates, which connotes that the long-term effect of variables is more significant. In the estimates of model I, for instance, 1% rise in R&D input will induce 0.11% reduction in carbon dioxide emissions in the long run, while 1% rise in R&D input will induce only 0.07% reduction in carbon dioxide emissions in the short run. This substantiates that China’s R&D input in an effort to ameliorate environment is more effective in the long term than in the short term. Judging from coefficient estimates of error correction terms (in Model I, −0.61; in Model II, −0.33; in Model III, −0.59), when short-term fluctuations deviate from the long-run equilibrium, non-equilibrium state will be pulled back to equilibrium state by a restoring force ranging from 33% to 61%.
There is an implicit assumption in cointegration test and long-run equilibrium equation, that is, the estimated parameters are fixed. However, the estimated parameters of time series model may change over time, leading to defect of model reliability. Hence stability test is mandatory. We in this paper use recursive cumulative sum of residual squares recommended by Pesaran to test the parameter stability of model structure. Results of CUSUMSQ test show over the time series span, residual sum has never been out of the boundary, which leads us to believe that the estimate equation of CO2 emissions is stable and reliable, and its estimate coefficients are credible and scientific.
4. Conclusions
China’s galloping economy has witnessed increasingly tremendous amount of energy consumption and CO2 emissions, but few scholars have touched on the social, economical and institutional determinants of CO2 emissions. This paper casts some light on that sphere and accordingly comes up with policy recommendations to China and other developing countries.
Within the framework of endogenous economic growth theory and environmental economics, this paper zeros in on the interrelationship between international technology spillover, energy consumption and CO2 emissions. Our aggregate data of China covering almost half a century has provided a number of conclusions. Firstly, domestic R&D input, international technology spillover and technological transformation respectively bring about reduction in CO2 emissions. This bears testimony that R&D input has both direct and indirect effect on the reduction in CO2 emissions-promotion of independent domestic innovation and acceleration of transformation, absorption and utilization of technology from forerunners by a rise in energy efficiency lead to reduction in CO2 emissions. Secondly, energy consumption contributes to the growth of CO2 emissions in China; labor input is relatively cleaner than physical capital input. Thirdly, there is evidence of more stringent environmental protecttion measures reducing carbon dioxide emissions and reining in CO2 emissions.
5. Acknowledgements
This project is supported by national soft science projects (No. 2010GXS5D245).
REFERENCES
- IEA, “CO2 Emissions from Fuel Combustion,” 2008. http://www.iea.org/co2highlights/CO2highlights.pdf
- P. M. Romer, “Endogenous Technological Change,” Journal of Political Economy, Vol. 98, No. 5, 1990, pp. 71-102. doi:10.1086/261725
- P. Aghion and P. Howitt, “Model of Growth through Creative Destruction,” Econometrica, Vol. 60, No. 2, 1992, pp. 323-352. doi:10.2307/2951599
- D. T. Coe and E. Helpman, “International R&D Spillover,” European Economic Review, Vol. 39, No. 5, 1995, pp. 859-887. doi:10.1016/0014-2921(94)00100-E
- R. Griffith, S. Redding and J. V. Reenen, “Mapping the Two Faces of R&D: Productivity Growth in a Panel of OECD Industries,” Review of Economics and Statistics, Vol. 86, No. 4, 2004, pp. 883-895. doi:10.1162/0034653043125194
- X. Liu, “Explaining the Relationship between CO2 Emissions and National Income—The Role of Energy Consumption,” Economics Letters, Vol. 87, No. 3, 2005, pp. 325-328. doi:10.1016/j.econlet.2004.09.015
- J. B. Ang, “CO2 Emissions, Energy Consumption and Output in France,” Energy Policy, Vol. 35, No. 10, 2007, pp. 4772-4778. doi:10.1016/j.enpol.2007.03.032
- M. A. Cole, R. J. R. Elliott and S. Wu, “Industrial Activity and the Environment in China: An Industry-Level Analysis,” China Economic Review, Vol. 19, No. 3, 2008, pp. 393-408. doi:10.1016/j.chieco.2007.10.003