American Journal of Climate Change
Vol.06 No.04(2017), Article ID:79839,24 pages
10.4236/ajcc.2017.64029
Impact of Elevated CO2 on Wheat Growth and Yield under Free Air CO2 Enrichment
Vivek Pandey1*, Marisha Sharma1, Farah Deeba1, Vivek K. Maurya1, Sunil K. Gupta1, Satyendra P. Singh2, Aradhana Mishra2, Chandra Shekhar Nautiyal2
1Plant Ecology & Environmental Sciences, CSIR-National Botanical Research Institute, Lucknow, India
2Division of Plant Microbe Interaction, CSIR-National Botanical Research Institute, Lucknow, India

Copyright © 2017 by authors and Scientific Research Publishing Inc.
This work is licensed under the Creative Commons Attribution International License (CC BY 4.0).
http://creativecommons.org/licenses/by/4.0/


Received: July 12, 2017; Accepted: October 22, 2017; Published: October 25, 2017
ABSTRACT
Impact of elevated CO2 (free air CO2 enrichment) was studied on wheat (Triticum aestivum L. var Kundan) growth, yield and proteome. Elevated CO2 significantly impacted both underground (+24%) and aboveground (+15%) biomass. Grain weight/plant and harvest index were increased by 35% and 11.4%, respectively under high CO2. On the other hand, seed protein content was decreased by 19% under CO2 enrichment while seed starch and soluble sugar contents were increased by 8% and 23%, respectively. Wheat leaf proteomics revealed that 50 proteins were showing differential expression. Twenty proteins were more abundant while 30 were less abundant. Thirty two proteins were identified by MALDI TOF TOF. More abundant proteins were related to defense, photosynthesis, energy metabolism etc. While less abundant proteins were related to glycolysis and gluconeogenesis. Wheat grain proteomics revealed that out of 49 differentially abundant proteins, 24 were more in abundance and 25 were less in abundance in wheat grains under eCO2 condition. Thirty three proteins were identified and functionally characterized. They were found to be involved mainly in carbon metabolism, storage, defence and proteolysis. Gluten proteins are the major component of wheat storage proteins. Our results showed that both high and low molecular weight glutenins were more in eCO2 wheat seeds while there was no change in gliadin evels. This might alter wheat dough strength. Concentration of grain Cr and As was increased at eCO2 while that of Fe, Cu, Zn and Se were found to be decreased. Dynamics of carbon utilization and metabolic abilities of soil microbes under eCO2 were significantly altered. Our study showed that altered wheat seed composition is cause for concern vis-à-vis nutrition and health and for industries which may have implications for agriculturally dominated country like India.
Keywords:
Carbon Dioxide, FACE, Wheat, Proteomics, Grain Yield, Soil Microbes

1. Introduction
The rise in atmospheric CO2 concentration is unequivocal as the emissions of CO2 due to anthropogenic activities have increased dramatically within the last 50 years and will continue to increase by almost 3% each year. Future predictions of atmospheric [CO2] estimates concentrations reaching 421 ppm (Representative Concentration Pathways; RCP 2.6) to 1313 ppm (RCP 8.5) by the year 2100 [1] . Most of the C3 plants respond to these increasing levels through photosynthetic conversion of high CO2 into increased growth and productivity. Apart from this, elevated CO2 (eCO2) is also known to directly alter grain yield and quality of important agricultural crops such as wheat [2] [3] . Many studies have reported altered protein content and nutritional value of wheat seed as affected by eCO2. Some demonstrated decrease of total grain protein concentration by 3.5% - 14.3% [4] [5] while others reported altered protein composition [2] [6] . The reported changes in the grain quality under eCO2 condition could, in future, result in a need for a dietary counter-balancing with other food protein compounds or fortification to provide the required nutrients for an adequate human nutrition. Moreover indirect plant-mediated effects of eCO2―including more rhizo-deposits and root exudates and changes in their composition―can affect the amount, composition and functions of soil microorganisms [7] . Turnover of the net carbon from primary production to the soil via root exudates is based on the concentration of the CO2 in the atmosphere. Recent studies have revealed only minor changes in soil microbial communities under eCO2 [8] . But it is important to understand microbial response to increasing (CO2) to predict its effects on soil as plant-associated microbes produce plant hormones, fix nitrogen, and oxidize methane [9] .
Wheat (Triticum aestivum L.) is the world’s foremost food and feed crop and India is second largest producer of this major crop contributing about 12% of the global production. Hogy and Fangmeier (2008) [10] and Hogy et al. (2009a) [2] reported positive effects of CO2 enrichment on wheat biomass and grain yield production. Atmospheric CO2 enrichment results in a concurrent rise in net photosynthetic rate (PN) causing stomatal conductance (gs) to decrease and water-use efficiency (WUE) to improve [11] .
In India, CO2 enrichment studies on wheat (Triticum aestivum) in Open Top Chambers (OTCs) showed stimulated growth and yield [12] , increased PN and Fv/Fm ratio with decreased gs [13] and photosynthetic acclimation [14] . Uprety et al. (2009) [15] observed increases in growth and yield with increase in grain starch and decrease in protein concentration in grain as ploidy level increased in Triticum species under mid-FACE system. However there is hardly any information on CO2-induced impacts on proteomic changes in leaves and seeds of wheat plants as also changes in gluten proteins. In addition there are no reports of eCO2 impact on some important microelements like Zn, Cu, Mn and Fe.
The aim of this study was to investigate the impacts of elevated CO2 on the growth and yield, physiology, proteome and nutrient composition of wheat (Triticum aestivum L. var Kundan) under Free Air CO2 Enrichment (FACE) conditions. Further we studied how elevated CO2 is impacting the structure and activity of the soil microbial community. We report that besides enhanced growth there are indeed some changes in nutrient composition of wheat grains under eCO2.
2. Materials and Methods
2.1. Plant Establishment and CO2 Exposure
The experiment was carried out in FACE system of the National Botanical Research Institute, Lucknow (80˚59'E, 26˚55'N, 123 m asl), Uttar Pradesh, India. The NBRI FACE facility consists of three hexagonal CO2 enrichment rings together with their three companion ambient (non-enrichment) rings. The ring has a diameter of 10 m. Each FACE ring is made up of six 3 m long G.I. pipes. Each horizontal tube is grounded in soil. Each horizontal arm is fitted, at three points, with 5 m vertical pipes. These vertical pipes have nozzles to release CO2 inside the ring. CO2 is supplied through 30 kg cylinders fitted with pre-heaters. 300 litre capacity of air compressors are used to pump air mixed with CO2 into FACE ring through GI pipes. Six solenoid valves are used for each arm of FACE ring and one valve is for main CO2 line, therefore total seven solenoid valve were used to control CO2 release inside the ring. The CO2 concentration inside the ring is sampled at 3 places and fed to the infrared gas analyser. Before being fed to the analyser, air is passed through a desiccant and filter to remove moisture and particulate matter. In the middle of the ring, sensors for wind speed and direction, temperature, humidity, light intensity and CO2 are mounted. Signals from these sensors are transmitted toward control room through four core shielded cable. Fully automatic control system (SCADA) for monitoring and regulation of desired CO2 works with inputs form the CO2 analyzer, temperature and anemometer. The control system is operated with microprocessor through in-built timer and data logger input. Online display of temperature, humidity, CO2 concentration in ppm and air velocity is integrated with necessary controls and monitoring station controller. The system has memory backup and real time clock combination and single window operation to monitor temperature, humidity, CO2 level and air velocity with direction. We intended to achieve 500 ppm CO2 concentration but could achieve 472 ppm throughout the experiment (from seed emergence till final harvest).
A local winter wheat cultivar (Triticum aestivum L. cv. Kundan) was grown inside FACE rings. Seeds were manually sown in rows spaced around 15 cm and at depth of 3 - 4 cm. Recommended doses of NPK (Nitrogen: Phosphorus: Potassium at 120:60:60 kg per hectare) were applied as urea, diammonium phosphate (DAP) and potash, respectively. Phosphorus and potassium were applied at the time of seed bed preparation while nitrogen fertilizer was applied in three split doses. One-third nitrogen was applied at the time of seed bed preparation and was thoroughly mixed into soil by ploughing and planking. The second dose (1/3) of nitrogen was applied at the time of 1st irrigation & third dose at the time of 3rd irrigation. The irrigation was maintained regularly throughout the experiment. Weeds were removed manually.
2.2. Plant Photosynthesis, Growth and Yield
Photosynthetic rate and stomatal conductance were measured using LiCOR model 6400 (Lincoln, Nebraska) equipped with CO2 control modules and LED light sources. Measurements were made on fully expanded leaves two leaves down from the youngest expanding leaf after 8 - 9 weeks of growth for vegetative phase and 12 - 13 weeks of growth for flowering phase.
Plants were harvested for biomass analysis at vegetative phase (8 - 9 weeks of growth) and final harvest (full maturity) in five replicates from each ring. Root and shoot biomass were weighed after drying the plants in oven at 80˚C till constant weight for both the samplings. Spikelet number per inflorescence, inflorescence number per plant and inflorescence weight per plant was also counted. Yield parameters were studied through grain weight per plant, thousand grain weight and harvest index.
2.3. Starch, Total Soluble Sugar, Total Nitrogen and Mineral Content
Starch was extracted following the perchloric acid method described by Whelan (1955) [16] and was assayed using Iodine. Total soluble sugars (TSS) was estimated using anthrone method. Total nitrogen content was estimated using standard protocol described by Kalra and Maynard (1991) [17] . Minerals were analysed after acid digestion of samples using inductivity-coupled plasma mass spectrometry (7500CX, Agilent, Japan).
2.4. Proteomic Studies
2.4.1. Leaf 2DE and Image Analysis
Proteins were extracted initially with extraction buffer 50 mM Tris-HCl, pH 8.0, 25 mM EDTA, 500 mM thiourea and 0.5% 2-mercaptoethanol (BME) after grinding leaf sample in Liquid N2 followed by overnight trichloroacetic acid-acetone precipitation at −20˚C, followed by acetone washing. The pellet was suspended in 0.1 M Tris-HCl, pH 8.0 with 50 mM EDTA and 2% BME followed by phenol-ammonium acetate precipitation overnight at −20˚C. Dried pellet was solubilised in solubilisation buffer 7M urea, 2M thiourea, 2% CHAPS (w/v), 25 mM DTT (Dithiotheritol) for 2 - 3 hours at room temperature subsequently protein was estimated by Bradford method and stored at −20˚C.
Isoelectric focusing (IEF) was performed on 7 cm IPG strips, pH 4 - 7 (Immobilization strip by GE Healthcare) with 120 µg protein in Ettan IPGphor3 unit (GE Healthcare) in triplicates for each treatment. After overnight passive rehydration, focussing was done on Ettan IPGphor under following conditions: 200 V for 20 min, 450 V for 15 min, 750 V for 15 min, and 2000 V for 4 h for a total of 10 kVh. Consequently, equilibration of strips was performed in a buffer containing 50 mM Tris-HCl, pH 8.8, 6 M urea, 30% (v/v) glycerol, 2%(w/v) SDS, 1% (w/v) DTT for 15 min, and another 15 min in the same buffer but with 2.5% (w/v) iodoacetamide replacing DTT. The second dimension was run in Mini-PROTEAN Tetra Cell (BioRad) using 7 × 8 cm homogeneous SDS-PAGE gels of 12% T and 5% C at constant 200 V in standard Tris-Glycine running buffer. Gels were stained with 0.5% Brilliant Blue G-250. Gel images were acquired using HP scanner (SCAN-JET XPA). Image analysis was performed using ImageMaster 2D Platinum 7.0 (GE Healthcare) for protein expression analysis on the basis of relative volume (% volume) as upregulated (1.5 fold increase or more) or downregulated (1.5 fold decrease or more). Different statistical analysis was also performed as facilitated by the software.
2.4.2. Seed 2DE and Image Analysis
Seed protein was extracted following the extraction protocol by Guo et al. (2012) [18] based on TCA-acetone precipitation. The seeds were grounded in Liquid N2 and first extracted with buffer containing 400 mM sucrose, 35 mM Tris-HCl, pH 7.5, 200 mM EDTA, l mM DTT and l mM PMSF for 7 - 8 min followed by 2 - 3 min in extraction buffer (400 mM sucrose, 35 mM Tris-HCl, pH 7.5, 200 mM EDTA, 400 mM Triton X-100, l mM DTT and l mM PMSF). The supernatants were mixed at room temperature for 30 min and total protein was precipitated from supernatants overnight by 1/4 volumes of cold 10% trichloroacetic acid at −20˚C overnight followed by cold acetone washing. Pellet collected after washing was freeze dried and added to solubilisation buffer (7 M urea, 2 M thiourea, 4% CHAPS, 25 mM DTT) at the room temperature for 2 - 3 h. The concentrations of protein samples were determined with Bradford reagent.
Isoelectric focussing (IEF) was performed on 7 cm IPG strips, pH 3 - 10 (Immobilization strip by GE Healthcare) in Ettan IPGphor 3 unit (GE Healthcare) with 60 µg of protein in similar way as described earlier for total protein of leaf with changes in buffer for rehydration which contain 4% CHAPS. Running conditions were: 100 V for 1 hr, 200 V for 30 min, 500 V for 30 min, 1000 V for 2 hr, 5000 V for 2 hr and 8000 V for 5 hr. Equilibration of strip, second dimension, staining of gels and image analysis were performed by following methods described in previous section.
2.4.3. In-Gel Digestion, Mass Spectrometry and Protein Identification
Protein spots were excised from the gels and gel particles were destained overnight by 50% methanol and 0.05 M ABC. Next morning, gels were re-swelled by replacing destain solution with sterilized MQ water for about 5 - 8 min and fresh volume of destain solution were added for upto 3 - 4 h. Gels were washed twice with 0.025 M ABC for 10 min and dehydrated by washing with 2:1 solution of ACN and 0.05 M ABC. The cycle of dehydration was followed by rehydration by 0.025 M ABC three times. Destained gel pieces were dried in a vacuum centrifuge concentrator for 30 min and dried gel pieces were rehydrated in trypsin solution (10 - 20 µl from 20 ng/µl trypsin stock solution) which were added according to 1:20 ratio of protein. Gel particles were immersed in 0.025 M ABC and samples were digested overnight at 37˚C (about 16 - 18 hrs). Peptides were extracted twice with 50% ACN/1% TFA. The recovered peptides were concentrated to a final volume of 10 µl. The identification of protein spots was done through Mass spectrometry (MS) using 4800 Plus MALDI TOF/TOF Analyzer (ABSCIEX, USA). The mono isotopic peptide masses obtained from MALDI-TOF were analyzed by the 4000 Series Explorer software version 3.5 (ABI). On the basis of mass signals, protein identification was performed through Mascot software (http://www.matrixscience.com) against NCBInr protein database. The search criteria in database were as follows: taxonomy, viridiplantae; fixed modification, cysteine carbamidomethylation; variable modification, methionine oxidation; peptide tolerance, ±100 ppm, MS/MS tolerance, ±0.2 Da; peptide charge +1; maximum allowed missed cleavage, 1; instrument type, MALDI-TOF/TOF. The non-probabilistic basis for ranking protein hits and as the sum of the series of peptide scores were protein scores derived from ion scores. The mascot algorithm set the score threshold to achieve p < 0.05 based on the size of the database used in the search. False discovery rate (FDR) for protein identification was set to 1%. The protein spots with MOWSE score above threshold level determined by Mascot were considered and proteins with the confidence interval percentage greater than 95% were considered to represent a positive identification.
2.4.4. High Molecular Weight Glutenins (HMW-GS) and Gliadin Analysis
1) Isolation of HMW-GS Fractions and Gliadins
HMW Glutenins (alcohol insoluble gluten) fraction was extracted from both AMB and ELE seeds according to Marchylo et al. (1989) [19] . The method is based on selective precipitation at ambient conditions by gradually increasing the concentration of alcohol (1-propanol). HMW-GS fraction was precipitated by increasing the concentration of 1-propanol to 60% (v/v) in supernatant after three extractions with 50% (v/v) 1-propanol containing 1.0% DTT (w/v) at 60˚C for 30 min with continuous stirring followed by centrifuging at 4600 g for 20 min. The precipitate, after allowing suspension to stand at ambient conditions for 30 min, was then collected after centrifugation (20 min at 4600 g) and removal of the supernatant. Freeze dried precipitated proteins were solubilised in solubilisation buffer (7 M urea, 2 M thiourea, 4% CHAPS, 25 mM DTT) and protein concentration estimated by Bradford reagent.
The extraction of gliadins was performed through modified Osborne fractionation (Wieser et al., 1998) [20] method followed by precipitation with trichloroacetic acid-acetone. Albumins/globulins fraction of wheat flour was separated before gliadins extraction. Wheat seed (100mg) was crushed into fine powder and extracted with 1 ml 0.4 mol∙L−1 NaCl + 0.067 mol∙L−1 HKNaPO4, pH 7.6 with continuous mixing at 20˚C for 10 min. The suspension was centrifuged for 20 min at 6000 g and 20˚C. The above extraction step was performed twice to remove albumins/globulins fraction. The albumins/globulins free pellet was then extracted thrice with 70% ethanol for gliadins fraction. The pellet was stirred with 0.5 ml 70% ethanol at 20˚C for 10 min then centrifuged at 6000 g and 20˚C for 20 min. The suspension was collected after each centrifugation step and then pooled (gliadins fraction). The gliadins were precipitated overnight by TCA/ acetone (5ml) at −20˚C. The precipitated gliadins were recovered by centrifugation at 4500 rpm for 10 min (4˚C). The pellet was air-dried then solubilised in solubilization buffer containing (8 M urea, 2M thiourea, 4% CHAPS (w/v), 25 mM DTT) for 4 hours at room temperature. The protein was quantified using Bradford reagent.
2) SDS-PAGE and Image Analysis
SDS-PAGE was carried out according to Lagrain et al. (2013) [21] with a homogeneous 10% polyacrylamide-Bis-Tris [Bis(2-hydroxyethyl)-amino-tris(hy- droxymethyl)-methane-HCl] gel at pH 6.4, 1.0 mm × 10 well. The running buffer was MOPS-Tris (50 mmol/L MOPS, 50 mmol/LTris, 3.5 mmol/L SDS, 1 mmol/L EDTA, pH 7.7) containing DTT (5 mmol/L). Ten and twenty µg of glutenin and 10 µg of gliadin per treatment was loaded with 1 mL of extraction buffer (293.3 mmol/L sucrose, 246.4 mmol/L Tris, 69.4 mmol/L SDS, 0.51 mmol/L EDTA, 0.22 mmol/L brilliant blue G250 0.105 mmol/L HCl, pH 8.5) for 24 h under reducing conditions (DTT, 50 mmol/L). The gliadin standard from Sigma-aldrich was prepared by mixing 4 mg in 1 ml (4 µg/µl) of loading buffer for 24 h under reducing conditions (50 mmol/L DTT). The protein suspension was then shaken for 10 min at 60˚C and centrifuged at 5000 g for 5 min at 20˚C. Low range molecular marker (14 kDa - 97 kDa) from GE Healthcare was used for calibration purpose. Electrophoresis was performed at constant 30 mA current. After the run, proteins were stained for 30 min with Coomassie Brilliant Blue R-250. Gels were first destained twice with methanol/water/ acetic acid (50/40/10, v/v/v) for 15 min and then overnight with water/methanol/acetic acid (80/10/10, v/v/v).
Image analysis was performed through ImageQuant TL 7.0 software (GE Healthcare) with amount of protein calibrated according to Low Molecular Weight Protein Marker from GE Healthcare containing mixture of protein standards (Phosphorylase b, Albumin, Ovalbumin, Carbonic Anhydrase, Trypsin Inhibitor, α Lactalbumin). MS analysis was also done in similar way as described earlier for total leaf protein.
2.5. Soil Microbiology
2.5.1. Microbial Analysis
Soil samples (3 samples for each treatment) were collected from the upper layer (0 - 20 cm) in the field and brought to the laboratory in sealed polybags for microbiological and biochemical studies.
Microflora associated with soil samples were determined by the culture enrichment technique [22] . The total microbial counts were determined as follows: nutrient agar for heterogenous bacteria, Kenknight, and Munaier’s medium for Actinomycetes spp. and Potato Dextrose agar for isolation of fungi.
2.5.2. Community-Level Physiological Profiles (BIOLOG)
The patterns of potential carbon source utilization by soil microbial communities under ambient and elevated condition of CO2 were assessed by Biolog Eco and MT plates (Biolog, Inc., Hayward, CA, USA) as described by Campbell et al. (1997) [23] . Manufacturer’s instructions were used during the preparation of Biolog MT Plates. One g soil sample of the individual soil samples were shaken in 9.0 ml of sterile 0.85% saline Milli-Q Water (MQW) for 60 min and then a final dilution was prepared up to 10−3. 150 µl of sample were inoculated at 30˚C in each well of Biolog Eco plates. The utilization rate is showed by the reduction of tetrazolium (redox indicator dye), which alters from colourless to purple. Data were recorded during the study period (day 1 - 15) at 590 nm described earlier [24] . Microbial activity was expressed and determined as average well colour development (AWCD) in each microplate as described by Garland (1996) [25] . Microbial evenness indexes and diversity were calculated Mishra and Nautiyal (2009) [24] . Principal component analysis (PCA) was done on data divided by AWCD [25] .
2.6. Statistical Analysis
All values reported in this work are mean of at least three independent experiments. The means ± SD and the exact number of experiments are given in legends. The significance of differences between control and each treatment was analyzed using Student’s t-test. Principal component analysis was performed on different morphological, physiological and yield parameters using PAST 3 (PAleontological Statistics, Version 3.11).
3. Results and Discussion
3.1. Morphological, Physiological and Yield Parameters
Our results showed that eCO2 clearly acted as C “fertiliser” positively influencing the biomass accumulation, photosynthesis and yield of wheat plants. Root and shoot weight were increased significantly by 24% and 15%, respectively (Figure 1). CO2 enrichment significantly enhanced weight of inflorescence/plant, grain weight/plant and harvest index (HI) by 27%, 35% and 11.4%, respectively (Figure 2(a), Figure 2(d) and Figure 2(f)). The increase in yield parameters showed carbon assimilates partitioning from source to sink under eCO2. Principal component analysis (PCA) was used to analyze morphological, physiological and yield responses of wheat plants to eCO2 (Figure 3). The biplot revealed two principal components, together explaining 62% of the observed variability. The first principal component PC1 explained 47.77% of the variance showing fertilization effect on carbon metabolism observed through biomass accumulation and
 (a)
(a)
 (b)
(b)
Figure 1. Effect of eCO2 on wheat plant biomass (a) Root weight; (b) Shoot weight. Bar represents the mean ± std. dev and <*> represents level of significance through t-Test.
 (a)
(a)
 (b)
(b)
 (c)
(c)
 (d)
(d)
 (e)
(e)
 (f)
(f)
Figure 2. Yield parameters under elevated CO2. (a) Weight of inflorescence/ plant; (b) Number of inflorescence/ plant; (c) Spikelet number/ plant; (d) Grain weight; (e) 1000 Grain weight and (f) Harvest index. Bar represents the mean ± std. dev and <*> represents level of significance through t-Test.

Figure 3. PCA biplot showing two principal components with loadings of different variables (morphological, physiological and yield) and factor loadings of ambient and elevated CO2 treatment for wheat plants. Variables: SW = Shoot weight; RW = Root weight; ANI = Photosynthetic rate at vegetative stage; ANII = Photosynthetic rate at flowering stage; gsI = Stomatal conductance at vegetative stage; gsII = Stomatal conductance at flowering stage; GW = Grain weight; IW = Inflorescence weight/plant; SN = Spikelet number/plant; IN = Inflorescence number/plant; TSW = 1000 seed weight; HI = Harvest index; NL = Nitrogen content of leaf; NS = Nitrogen content of seed.  = Ambient;
  = Elevated
improved yield. The maximum positive loadings on PC1 were of two yield parameters (grain wt/plant and inflorescence wt/plant), stomatal conductance (both stages), photosynthesis (flowering stage), harvest index (HI) followed by root and shoot weight (Supporting Information Figure S1(a)). The increase in biomass and yield parameters under eCO2 has been reported in previous FACE study on wheat [26] . Photosynthesis (measured at two growth stages) was insignificantly increased by eCO2 and decreased on long exposure to eCO2 as observed during flowering stage (Supporting Information Figure S2(a)). The stomatal conductance (gs) during early exposure increased under eCO2 then decreased after long exposure (Supporting Information Figure S2(b)). A/Ci curve showed that continued high CO2 supply resulted in photosynthetic acclimation (Figure 4). Photosynthetic acclimation has been previously described in wheat plants exposed to eCO2 [27] . It has been reported that in C3 plants downward photosynthetic acclimation occurs after prolonged eCO2 exposure. This downward acclimation has been explained through either sink limitation hypothesis or N limitation hypothesis.
 (a)
(a) (b)
(b)
Figure 4. Aci curve representing rate of photosynthesis (µmol∙m−2∙s−1) with increasing concentration of CO2 in wheat plants at (a) Vegetative phase and (b) Flowering phase under eCO2.
3.2. Proteomics
The proteomic investigation of leaf and seed revealed increased abundance of proteins involved in carbon metabolism. The non-significant decrease in protein content of leaf was observed under eCO2 (Figure 5(a)). Seed protein content was found to be increased significantly by 3.24% on CO2 fertilization (Figure 5(b)).
 (a)
(a)
 (b)
(b)
Figure 5. Effect of eCO2 on protein content of (a) Leaf and (b) Seed. Bar represents the mean ± std. dev and <*> represents level of significance through t-Test.
1) Leaf Proteomics
2-DE resolved a total of 431 proteins in wheat leaf (Supporting Information Figure S3), of which 50 proteins were differentially expressed. Software analysis revealed that 20 proteins were up-regulated and 30 were down-regulated and 34 of them were identified (Supporting Information Table S1 and Supporting Information Table S2). Leaf proteomics revealed that proteins involved in C metabolism were more abundant. However, RuBisCO (spot nos 176, 185, 187, 189) which accounts for around 50% of leaf protein was found downergulated under eCO2 condition. N reallocation within plants or non-selective decrease in leaf N content resulted in decrease of RuBisCO [27] . Our PCA analysis also showed inverse relation of leaf nitrogen with photosynthetic rate (Figure 3). It has been suggested that as consequence of enhanced photosynthetic rates under elevated [CO2], level of photosynthetic assimilates cause source/sink imbalance [27] . Consequently, source/sink imbalance causes decrease in RuBisCO content resulting in photosynthetic acclimation after initial increase under CO2 enrichment, as observed in our experiment. Rate of photosynthesis is not only limited by carboxylation catalysed by Rubisco but also by ribulose 1, 5-bisphosphate (RuBP) regeneration and mesophyll conductance. RuBP regenerating enzymes like, sedoheptulose 1,7-bisphosphatase (SBPase), transketolase (TK), and fructose 1,6-bisphosphate aldolase (FBPase, chloroplastic) were increased in abundance (Supporting Information Table S1 and Supporting Information Table S2). SBPase, FBPase and TK significantly control RuBP regeneration [28] [29] and carbonic anhydrase (CA) regulates mesophyll conductance [27] . Similarly ATP synthase and photorespiratory enzyme like phosphoglycolate phosphatase (PGLP) (spot no 88) were also increased in abundance. Aranjuelo et al. (2011) [27] suggested that abundance of these enzymes is a rebalancing away from carboxylation to RuBP-regeneration capacity. Plant growth under eCO2 changes the balance between electron transport, electron consumption, and reactive oxygen species (ROS) production. Cytochrome b6-f complex (spot no 30) and Oxygen-evolving enhancer protein 2 (spot no 52) were upregulated which drive the carbon reduction and oxidation cycle balancing towards the carbon metabolism. It is unclear how eCO2 affect antioxidant metabolism, since decreased concentration of antioxidative enzyme APX (spot no 68) and increased concentration of Cu/Zn SOD (spot no 29), germin like protein (spot nos 31, 32) and peroxidase (spot no 75) were found. The impact of eCO2 on antioxidant metabolism was unclear as both decrease and increase were found as reported by Gillespie et al. (2012) [30] . The upregulation in antioxidant metabolism may be to cope up with oxidative stress caused by reduced respiration rate under eCO2. Many protein metabolism related proteins were down-regulated e.g, chaperone (spot no 13) and heat shock proteins (spot no 221) accounting for dilution by increased concentrations of non-structural carbohydrates [31] .
2) Seed Proteomics
3) Glutenins and Gliadins
The SDS-PAGE analysis of wheat grains revealed that proteins, five HMW-GS and three LMW-GS, major seed storage proteins, increased under eCO2 condition (Figure 6(a), Supporting Information Table S5 and Supporting Information Table S6). Wieser et al. (2008) [5] reported that HMW-GS fraction was more affected than LMW-GS fraction under eCO2. In wheat grain, HMW-GS represents about 12% of the total grain protein and plays an important role in determining the dough strength [32] . LMW-GS determined the dough extensibility and resistance and its level were also increased by eCO2 in agreement with previous findings of Hogy et al. (2009b) [32] . It has been reported that LMW-GS rapidly accumulates during early to mid grain filling while HMW-GS accumulates more rapidly during later phase of grain filling [33] . Our results showed
 (a)
(a)
 (b)
(b)
Figure 6. Homogeneous 10% polyacrylamide-Bis-Tris gel representing the effect of eCO2 on two seed proteins determining the quality of seeds (a) Gluten and (b) Gliadin.
protein synthesis throughout the grain filling period remained unaffected by eCO2, indicating adequate N intermediate supply for protein synthesis. We did not find any change in gliadins (storage protein) levels in response to eCO2 studied through 8 distinct bands on SDS-PAGE (Figure 6(b)). Similar results have also been reported by Hogy et al. (2009b) [32] . While both glutens and their fractions were reduced in a comparable FACE study [5] . Our results showed that higher glutenin/gliad in ratio under eCO2 might impact visco-elastic dough properties such as higher dough resistance and other traits fundamental to producing high quality bread. Seed proteins like Glucosidase (spot no 216), N-glycan processing enzyme and alanine aminotransferase supported the increase in seed storage proteins (glutenins) in our experiment (Supporting Information Table S3 and Supporting Information Table S4).
3.3. Nutrients, Starch, Total Soluble Sugars and Nitrogen Content
Nutritional value of food grains should be a matter of concern under changing environment like rise in levels of CO2. In our study, eCO2 caused alterations in the concentrations of microelements in wheat grains (Supporting Information Figure S5). Among the minerals, concentrations of Cr increased (87%) under eCO2 while that of Fe, Mn, Cu, Zn and Se were found to be decreased. There were insignificant increases in As, Ni and Mo contents also. The decrease in Fe and Zn content under eCO2 is a cause for concern [34] . Fe-deficiency currently affects more than 3.5 billion people and this decrease is likely to aggravate worldwide malnutrition, more so in India. Selenium (Se) is an integral component required for normal cell metabolism in humans and its concentrations were lower under eCO2 which is in agreement with Hogy et al. (2013) [6] . This reduction was probably caused by the dilution effect, induced by increased concentration of carbohydrate in grains. Although Pleijel and Hogy (2015) [3] contended that the effect of eCO2 on plant nutrients is smaller than that suggested by the dilution hypothesis. Starch is the main component of wheat grain and its concentration increased significantly by 8.25% in eCO2 condition (Figure 7(a)). Total soluble sugar content of grains increased significantly by 23.1% under eCO2 (Figure 7(b)). Nitrogen content of soil remained unchanged and no significant change was observed in leaf and seed nitrogen content (Supporting Information Table S7). Phytate, anti-nutritional compounds in cereals, insignificantly decreased (Supporting Information Figure S6) having role in lower uptake of Fe and Mn from the soils but it needs further investigation.
3.4. Soil Microbes
Soil microbial response under elevated CO2 gives insight about microbial structure and function shift under elevated CO2 environment. In present study, it was observed that the dynamics of carbon utilization and metabolic abilities of microflora under eCO2 were significantly altered. Under ambient condition, the bacterial population and actinomycetes were marginally reduced (0.29 log CFU
 (a)
(a)
 (b)
(b)
Figure 7. Effect of eCO2 on (a) Seed starch and (b) Seed total soluble sugars. Bar represents the mean ± std. dev and <*> represents level of significance through t-Test.
and 0.04 log CFU) at the harvesting stage as compared to the initial stage (Zero day) of rhizospheric soil (Supporting Information Figure S7). However in eCO2 condition, an increase in bacterial population (0.18 log CFU) and decrease in actinomycetes (0.05 log CFU) was found on prolonged exposure (harvesting stage). On the contrary, the fungal population was higher at harvesting stage in both ambient (0.26 log CFU) and elevated (0.09 log CFU) conditions (Supporting Information Figure S7). Substrate utilization pattern was observed in Biolog MT plates. Amino acid (Serine, Phenylalanine, proline and isoleucine) carbohydrates (glucose, arabinose, fructose, lactose gelatine, CMC), polymers (chitin, tween 80, and dextrin) and carboxylic groups (citric, malic and succinic acid) were effectively utilized by microflora present in eCO2 condition (Supporting Information Figure S8). Principal component analysis (PCA) of carbon source utilization pattern showed quiet unlike clustering between ambient and elevated microbial community (Figure 8). Xu et al. (2013) [35] reported that array of microbial functional groups (e.g., amine and amides, C degraders, pollutants and miscellaneous utilizers) were significantly influenced by CO2. Present findings showed the diversity of microbial community in different conditions. The diversity indices (in eCO2: ShanD: 1.41, ShanEv: .9941, MacD: 0.996, MacEv: 0.996, Simpson: 0.998) were significantly (p < 0.05) different between both rhizospheric soil, clearly showing the impact of eCO2 in richness of rhizospheric bacterial communities (Supporting Information Table S8). The increase of specific microbial growth rates was probably mediated by increased rhizodeposition due to higher root biomass resulting in a higher input of easily available substrates into the rhizosphere [7] . The increase in diversity was also linked with soil properties (e.g., nitrate, ammonia, soil C and N) under eCO2 [36] .
4. Conclusion
Elevated CO2 positively impacted wheat growth and yield. RuBisCO protein was less abundant under eCO2 condition, which might be due to N reallocation and/or photosynthetic acclimation. Seed proteins belonging to carbohydrate and
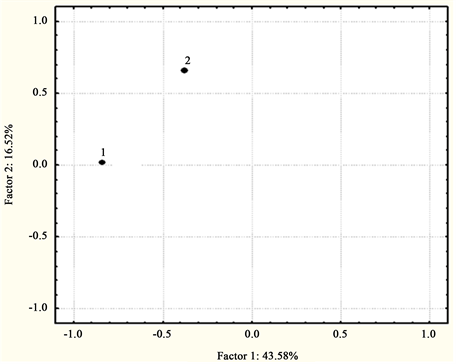
Figure 8. Principal component analysis (PCA) of carbon source utilization pattern of microbial community under 1. Ambient and 2. Elevated CO2 concentration. The biplot representing the two principal components causing variance
starch metabolism were more abundant under eCO2 resulting in high seed starch content. Whereas higher glutenin/gliadin ratio under eCO2 will impact visco-elastic dough properties such as higher dough resistance. The decrease in seed Fe and Zn content under eCO2 is a cause for concern in a country like India where child and female anaemia is a major health problem. Microbial study highlighted the necessity and importance of examining the microbial response to eCO2 in agroecosystem and more such long term studies are needed. However, in the present study only one wheat cultivar at one single location and year was examined. Therefore more wheat varieties need to be tested in multi-year studies to determine eCO2-induced changes across different cultivars. Moreover, interactive effects of CO2 enrichment and other abiotic stressors such as temperature and ozone should also be investigated in this part of the world.
Acknowledgements
Funding for this work was provided by Council of Scientific & Industrial Research (CSIR), New Delhi, India (Grant no. PSC 0112). Senior Research Fellowships provided to MS and SKG by University Grants Commission and Council of Scientific and Industrial Research New Delhi, India, respectively is gratefully acknowledged.
Cite this paper
Pandey, V., Sharma, M., Deeba, F., Maurya, V.K., Gupta, S.K., Singh, S.P., Mishra, A. and Nautiyal, C.S. (2017) Impact of Elevated CO2 on Wheat Growth and Yield under Free Air CO2 Enrichment. American Journal of Climate Change, 6, 573-596. https://doi.org/10.4236/ajcc.2017.64029
References
- 1. IPCC (2013) Summary for Policymakers. In: Stocker, T.F., Qin, D., Plattner, G.K., Tignor, M., Allen, S.K., Bouschung, J., Nauels, A., Xia, Y., Bex, V. and Midgley, P.M., Eds., Climate Change 2013: The Physical Science Basis, Contribution of Working Group I to the Fifth Assessment Report of Intergovermental Panel on Climate Change, Cambridge University Press, Cambridge, New York.
- 2. Hogy, P., Wieser, H., Kohler, P., Schwadorf, K., Breuer, J., Franzaring, J., Muntifering, R. and Fangmeier, A. (2009) Effects of Elevated CO2 on Grain Yield and Quality of Wheat: Results from a Three-Year FACE Experiment. Plant Biology, 11, 60-69. https://doi.org/10.1111/j.1438-8677.2009.00230.x
- 3. Pleijel, H. and Hogy, P. (2015) CO2 Dose-Response Functions for Wheat Grain, Protein and Mineral Yield Based on FACE and Open-Top Chamber Experiments. Environmental Pollution, 198, 70-77.
- 4. Taub, D.R., Miller, B. and Allen, H. (2008) Effects of Elevated CO2 on the Protein Concentration of Food Crops: A Meta-Analysis. Global Change Biology, 14, 565-575. https://doi.org/10.1111/j.1365-2486.2007.01511.x
- 5. Wieser, H., Manderscheid, R., Erbs, M. and Weigel, H.J. (2008) Effects of Elevated Atmospheric CO2 Concentrations on the Quantitative Protein Composition of Wheat Grains. Journal of Agricultural and Food Chemistry, 56, 6531-6535. https://doi.org/10.1021/jf8008603
- 6. Hogy, P., Brunnbauer, M., Koehler, P., Schwadorf, K., Breuer, J., Franzaring, J., Zhunusbayeva, D. and Fangmeier, A. (2013) Grain Quality Characteristics of Spring Wheat (Triticum aestivum) as Affected by Free-Air CO2 Enrichment. Environmental and Experimental Botany, 88, 11-18.
- 7. Drigo, B., Kowalchuk, G.A., Knapp, B.A., Pijl, A.S., Boschker, H.T. and Veen, J.A. (2013) Impacts of 3 Years of Elevated Atmospheric CO2 on Rhizosphere Carbon Flow and Microbial Community Dynamics. Global Change Biology, 19, 621-636. https://doi.org/10.1111/gcb.12045
- 8. Xiong, J., He, Z., Shi, S., Kent, A., Deng, Y., Wu, L., Van Nostrand, J.D. and Zhou, J. (2015) Elevated CO2 Shifts the Functional Structure and Metabolic Potentials of Soil Microbial Communities in a C4 Agroecosystem. Scientific Reports, 5, Article No. 9316. https://doi.org/10.1038/srep09316
- 9. Okubo, T., Liu, D., Tsurumaru, H., Ikeda, S., Asakawa, S., Tokida, T., Tago, K., Hayatsu, M., Aoki, N., Ishimaru, K. and Ujiie, K. (2015) Elevated Atmospheric CO2 Levels Affect Community Structure of Rice Root-Associated Bacteria. Frontiers in Microbiology, 6, 1-8. https://doi.org/10.3389/fmicb.2015.00136
- 10. Hogy, P. and Fangmeier, A. (2008) Effects of Elevated Atmospheric CO2 on Grain Quality of Wheat. Journal of Cereal Science, 48, 580-591.
- 11. Tuba, Z., Raschi, A., Lannini, G.M., Nagy, Z., Helyes, L., Vodnik, D. and Di Toppi, L.S. (2003) Vegetations with Various Environmental Constraints under Elevated Atmospheric CO2 Concentrations. In: Sanita di Toppi, L. and Pawlik-Skowronska, B., Eds., Abiotic Stresses in Plants, Kluwer Academic Publishers, Dordrecht, 157-204.
- 12. Kant, P.C.B., Bhadraray, S., Purakayastha, T.J., Jain, V., Pal, M. and Datta, S.C. (2007) Active Carbon-Pools in Rhizosphere of Wheat (Triticum aestivum L.) Grown under Elevated Atmospheric Carbon Dioxide Concentration in a Typic Haplustept in Sub-Tropical India. Environmental Pollution, 147, 273-281.
- 13. Pal, M., Rao, L.S., Jain, V., Srivastava, A.C., Pandey, R., Raj, A. and Singh, K.P. (2005) Effects of Elevated CO2 and Nitrogen on Wheat Growth and Photosynthesis. Biologia Plantarum, 49, 467-470. https://doi.org/10.1007/s10535-005-0031-8
- 14. Pandurangam, V., Sharma-Natu, P., Sreekanth, B. and Ghildiyal, M.C. (2006) Photosynthetic Acclimation to Elevated CO2 in Relation to Rubisco Gene Expression Three C3 Species. Indian Journal of Experimental Biology, 44, 408-415.
- 15. Uprety, D.C., Dwivedi, N., Raj, A., Jaiswal, S., Paswan, G., Jain, V. and Maini, H.K. (2009) Study on the Response of Diploid, Tetraploid and Hexaploid Species of Wheat to the Elevated CO2. Physiology and Molecular Biology of Plants, 15, 161-168. https://doi.org/10.1007/s12298-009-0018-6
- 16. Whelan, W.J. (1955) Starch, Glycogen, Fructosans and Similar Polysaccharides. In: Tracey, M.V., Ed., Modern Methods of Plant Analysis/Moderne Methoden der Pflanzenanalyse Paech, Springer, Berlin, Heidelberg, 145-196. https://doi.org/10.1007/978-3-642-64955-4_6
- 17. Kalra, Y.P. and Maynard, D.G. (1991) Methods Manual for Forest Soil and Plant Analysis. Canadian Forest Service Publications.
- 18. Guo, G., Lv, D., Yan, X., Subburaj, S., Ge, P., Li, X., Hu, Y. and Yan, Y. (2012) Proteome Characterization of Developing Grains in Bread Wheat Cultivars (Triticum aestivum L.). BMC Plant Biology, 12, 147. https://doi.org/10.1186/1471-2229-12-147
- 19. Marchylo, B.A., Kruger, J.E. and Hatcher, D.W. (1989) Quantitative Reversed-Phase High-Performance Liquid Chromatographic Analysis of Wheat Storage Proteins as a Potential Quality Prediction Tool. Journal of Cereal Science, 9, 113-130.
- 20. Wieser, H., Antes, S. and Seilmeier, W. (1998) Quantitative Determination of Gluten Protein Types in Wheat Flour by Reversed-Phase High-Performance Liquid Chromatography. Cereal Chemistry Journal, 75, 644-650. https://doi.org/10.1094/CCHEM.1998.75.5.644
- 21. Lagrain, B., Brunnbauer, M., Rombouts, I. and Koehler, P. (2013) Identification of Intact High Molecular Weight Glutenin Subunits from the Wheat Proteome using Combined Liquid Chromatography-Electrospray Ionization Mass Spectrometry. PLoS ONE, 8, e58682. https://doi.org/10.1371/journal.pone.0058682
- 22. Nautiyal, C.S., Govindarajan, R., Lavania, M. and Pushpangadan, P. (2008) Novel Mechanism of Modulating Natural Antioxidants in Functional Foods: Involvement of Plant Growth Promoting Rhizobacteria NRRL B-30488. Journal of Agricultural and Food Chemistry, 56, 4474-4481. https://doi.org/10.1021/jf073258i
- 23. Campbell, C.D., Grayston, S.J. and Hirst, D.J. (1997) Use of Rhizosphere Carbon Sources in Sole Carbon Source Tests to Discriminate Soil Microbial Communities. Journal of Microbiological Methods, 30, 33-41.
- 24. Mishra, A. and Nautiyal, C.S. (2009) Functional Diversity of Microbial Community in the Rhizosphere of Chick Pea Grown in Diesel Fuel Spiked Soil Amended with Trichoderma ressi using Sole-Carbon-Source Utilization Profiles. World Journal of Microbiology and Biotechnology, 25, 1175-1180. https://doi.org/10.1007/s11274-009-9998-1
- 25. Garland, J.L. (1996) Patterns of Potential C Source Utilization by Rhizosphere Communities. Soil Biology and Biochemistry, 28, 223-230.
- 26. O’Leary, G.J., Christy, B., Nuttall, J., Huth, N., Cammarano, D., Stockle, C., Basso, B., Shcherbak, I., Fitzgerald, G., Luo, Q. and Farre-Codina, I. (2015) Response of Wheat Growth, Grain Yield and Water Use to Elevated CO2 under a Free Air CO2 Enrichment (FACE) Experiment and Modelling in a Semiarid Environment. Global Change Biology, 21, 2670-2686. https://doi.org/10.1111/gcb.12830
- 27. Aranjuelo, I., Cabrera-Bosquet, L., Morcuende, R., Avice, J.C., Nogués, S., Araus, J.L., Martínez-Carrasco, R. and Perez, P. (2011) Does Ear C Sink Strength Contribute to Overcoming Photosynthetic Acclimation of Wheat Plants Exposed to Elevated CO2? Journal of Experimental Botany, 62, 3957-3969. https://doi.org/10.1093/jxb/err095
- 28. Schnarrenberger, C. and Kruger, I. (1986) Distinction between Cytosol and Chloroplast Fructose-Bisphosphate Aldolases from Pea, Wheat, and Corn Leaves. Plant Physiology, 80, 301-304. https://doi.org/10.1104/pp.80.2.301
- 29. Rosenthal, D.M., Locke, A.M., Khozaei, M., Raines, C.A., Long, S.P. and Ort, D.R. (2011) Over-Expressing the C3 Photosynthesis Cycle Enzyme Sedoheptulose-1-7 Bisphosphatase Improves Photosynthetic Carbon Gain and Yield under Fully Open Air CO2 Fumigation (FACE). BMC Plant Biology, 11, 123. https://doi.org/10.1186/1471-2229-11-123
- 30. Gillespie, K.M., Xu, F., Richter, K.T., McGrath, J.M., Markelz, R.C., Ort, D.R., Leakey, A.D. and Ainsworth, E.A. (2012) Greater Antioxidant and Respiratory Metabolism in Field-Grown Soybean Exposed to Elevated O3 under Both Ambient and Elevated CO2. Plant, Cell & Environment, 35, 169-184. https://doi.org/10.1111/j.1365-3040.2011.02427.x
- 31. Gifford, R.M., Barrett, D.J. and Lutze, J.L. (2000) The Effects of Elevated [CO2] on the C:N and C:P Mass Ratios of Plant Tissues. Plant Soil, 224, 1-14. https://doi.org/10.1023/A:1004790612630
- 32. Hogy, P., Zorb, C., Langenkamper, G., Betsche, T. and Fangmeier, A. (2009) Atmospheric CO2 Enrichment Changes the Wheat Grain Proteome. Journal of Cereal Science, 50, 248-254.
- 33. Shewry, P.R., Underwood, C., Wan, Y., Lovegrove, A., Bhandari, D., Toole, G., Mills, E.C., Denyer, K. and Mitchell, R.A. (2009) Storage Product Synthesis and Accumulation in Developing Grains of Wheat. Journal of Cereal Science, 50, 106-112.
- 34. Wroblewitz, S., Huther, L., Manderscheid, R., Weigel, H.J., Watzig, H. and Danicke, S. (2013) The Effect of Free Air Carbon Dioxide Enrichment and Nitrogen Fertilisation on the Chemical Composition and Nutritional Value of Wheat and Barley Grain. Archives of Animal Nutrition, 67, 263-278. https://doi.org/10.1080/1745039X.2013.821781
- 35. Xu, M., He, Z., Deng, Y., Wu, L., Van Nostrand, J.D., Hobbie, S.E., Reich, P.B. and Zhou, J. (2013) Elevated CO2 Influences Microbial Carbon and Nitrogen Cycling. BMC Microbiology, 13, 1. https://doi.org/10.1186/1471-2180-13-124
- 36. He, Z., Xu, M., Deng, Y., Kang, S., Kellogg, L., Wu, L., Van Nostrand, J.D., Hobbie, S.E., Reich, P.B. and Zhou, J. (2010) Metagenomic Analysis Reveals a Marked Divergence in the Structure of Belowground Microbial Communities at Elevated CO2. Ecology Letters, 13, 564-575. https://doi.org/10.1111/j.1461-0248.2010.01453.x
Supporting Information
 (a)
(a) (b)
(b) (c)
(c)
Figure S1. Correlation graph for all variables on. (a) PC1; (b) PC2; Scree plot representing % eigenvalues of all components (c).
 (a)
(a) (b)
(b)
Figure S2. Effect of elevated CO2 on (a) Rate of photosynthesis and (b) Stomatal conductance of wheat plants at Vegetative phase (VEG) and Flowering phase (FLO). Bar represents the mean ± std. dev and <*> represents level of significance through t-Test. AMB represents ambient [CO2] and ELV represents elevated [CO2].
 AMBIENT LEAF 1
 AMBIENT LEAF 2
 AMBIENT LEAF 3(a)
 ELEVATED LEAF 1
 ELEVATED LEAF 2
 ELEVATED LEAF 3(b)
Figure S3. (a) Triplicate gels of wheat total leaf proteins under ambient CO2; (b) Triplicate gels of wheat total leaf proteins under elevated CO2
 AMBIENT SEED 1
 AMBIENT SEED 2
 AMBIENT SEED 3(a)
 ELEVATED SEED 1
 ELEVATED SEED 2
 ELEVATED SEED 3(b)
Figure S4. (a) Triplicate gels of wheat total seed proteins under ambient CO2; (b) Triplicate gels of wheat total seed proteins under elevated CO2.


Figure S5. Elemental content in wheat grain.

Figure S6. The antinutritional % phytate content of wheat seed under eCO2.. Bar represents mean ± std. dev.
 (a)
(a) (b)
(b) (c)
(c) (d)
(d)
Figure S7. Microbial count of different populations (a) Bacterial population, (b) Fungi population; (c) Actino population and (d) Number of isolated colonies in ambient and elevated CO2 soil. Values are mean ± S.E.
 (a)
(a)
 (b)
(b)
 (c)
(c)
 (d)
(d)
 (e)
(e)
Figure S8. Different carbon source (a) amino acids; (b) carbohydrate and miscellaneous;(c) polymers; (d) carboxylic group and (e) pollutants utilization patterns of microbial population present in ambient and elevated CO2 soil samples.
Tables S1-S8:
https://www.dropbox.com/sh/3j5uoxui04izojc/AADSW0XjiTVFYAEQo687t7h4a?dl=0