American Journal of Climate Change
Vol. 2 No. 3 (2013) , Article ID: 37293 , 10 pages DOI:10.4236/ajcc.2013.23017
Future Changes in Drought Characteristics over Southern South America Projected by a CMIP5 Multi-Model Ensemble
1Department of Atmospheric and Oceanic Sciences, University of Buenos Aires, Buenos Aires, Argentina
2National Council of Scientific and Technical Research, Buenos Aires, Argentina
Email: jrivera@at.fcen.uba.ar
Copyright © 2013 Olga C. Penalba, Juan A. Rivera. This is an open access article distributed under the Creative Commons Attribution License, which permits unrestricted use, distribution, and reproduction in any medium, provided the original work is properly cited.
Received January 19, 2013; revised February 26, 2013; accepted March 18, 2013
Keywords: CMIP5 Models; Drought; Standardized Precipitation Index; Climate Change; Southern South America
ABSTRACT
The impact of climate change on drought main characteristics was assessed over Southern South America. This was done through the precipitation outputs from a multi-model ensemble of 15 climate models of the Coupled Model Intercomparison Project Phase 5 (CMIP5). The Standardized Precipitation Index was used as a drought indicator, given its temporal flexibility and simplicity. Changes in drought characteristics were identified by the difference for early (2011-2040) and late (2071-2100) 21st century values with respect to the 1979-2008 baseline. In order to evaluate the multi-model outputs, model biases were identified through a comparison with the drought characteristics from the Global Precipitation Climatology Centre database for the baseline period. Future climate projections under moderate and high-emission scenarios showed that the occurrence of short-term and long-term droughts will be more frequent in the 21st century, with shorter durations and greater severities over much of the study area. These changes in drought characteristics are independent on the scenario considered, since no significant differences were observed on drought changes. The future changes scenario might be even more dramatic, taking into account that in most of the region the multi-model ensemble tends to produce less number of droughts, with higher duration and lower severity. Therefore, drought contingency plans should take these results into account in order to alleviate future water shortages that can have significant economic losses in the agricultural and water resources sectors of Southern South America.
1. Introduction
Among extreme meteorological events, droughts are possibly the most slowly developing ones, that often have the longest duration, and at the moment the least predictability among all atmospheric hazards [1]. In the last 20 years, 1 billion people worldwide were affected by droughts [2]. Southern South America (SSA) was no exception to this hazard, whose impacts were evident in the reduction in crop yields, reduced cattle products, streamflow deficiencies and consequently problems for hydroelectric power generation.
Climate change refers to any change in climate over time, whether due to natural variability or as a result of human activity [3]. These changes can lead to changes in the statistical properties of the distribution of the variable considered, as changes in their mean values and its amplitude or variability. Changes in precipitation variability can include more frequent and damaging extreme events such as drought [4]. Therefore, climate change is expected to primarily affect the frequency and severity of droughts. However, most of the research in SSA concentrated on changes in the mean state of the climate rather than in changes in its temporal variability, and the impact of climate change on drought characteristics remains partially unknown. Several works have evidenced the occurrence of positive trends in precipitation totals at different time scales during the second half of the 20th century over most of SSA [5-7]. In agreement to these variations, a decrease in the annual number of dry days was observed over a great portion of Argentina [8]. These trends exhibited a high degree of non-linearity, and some regions presented a reversion in their sign after 1990s [8,9]. Hence, climate model outputs are necessary in order to evaluate if modeled precipitation shows these low-frequency changes and if these trend’s reversion will continue during the 21st century, given the importance of these trends in the economy of the region. If a return to dry conditions is projected, droughts can become a more frequent hazard, and its severity and duration characteristics can be altered as well. Therefore, the quantitative knowledge of the characteristics of droughts in the region is an important aspect of the planning and management of agricultural practices and water resources.
Taking this into consideration, the aim of this research is to evaluate how well a multi-model ensemble from the Coupled Model Intercomparison Project Phase 5 (CMIP5) Global Climate Models (GCMs) represents the drought characteristics in SSA, and to evaluate future changes in drought frequency, duration and severity. Given the rising demand on water resources, governments and water agencies will face increased planning for drought alleviation. Therefore it is important to identify if climate change will aggravate water issues by changing drought characteristics at a regional level.
2. Data
2.1. Reference Data
Observed monthly rainfall totals were obtained from the Global Precipitation Climatology Centre (GPCC) Full Data Reanalysis v6 gridded at 1˚ × 1˚ resolution [10]. This dataset spans the Atmospheric Model Intercomparison Project (AMIP) period (1979-2008). The study area corresponds to the portion of South America south of 19˚S, which comprises 617 grid points excluding the southern oceans. The GPCC dataset was selected because its agreement with the spatial and temporal patterns of rain gauge data over the region. This is evident especially over the La Plata Basin, one of the largest basins and producers of hydroelectric power in the world, which is located in the central-eastern portion of SSA. Moreover, several studies used the GPCC dataset in order to characterize precipitation main features in the region [11,12] which also confirm its appropriateness.
2.2. Model Outputs
Assessments of future drought have traditionally used only few climate models to assess possible impacts [13]. Because the outputs of GCMs vary widely within the same scenarios, the use of GCM ensemble means with some acknowledgement of the uncertainty in ensemble outputs has become a standard practice in climate science research [14]. In this work we used an ensemble of monthly modeled precipitation data from 15 GCMs belonging to the CMIP5 [15]. Table 1 lists the selected models used in this study, with their respective modeling groups. Criteria for the selection of models were based
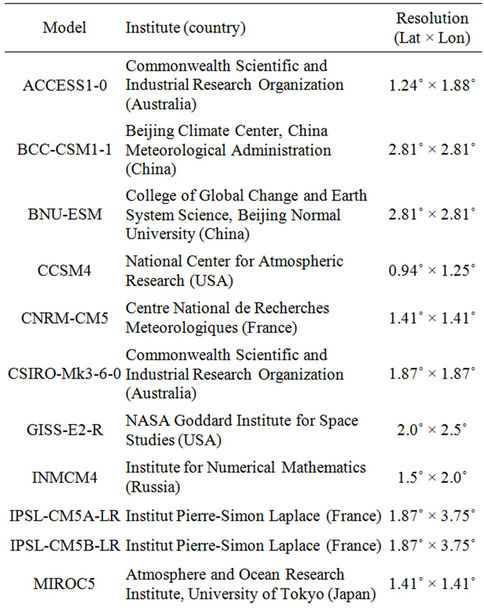
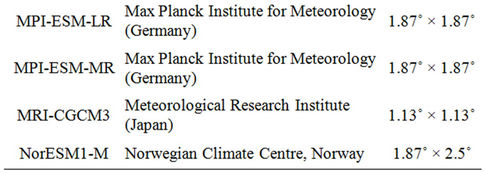
Table 1. List of the 15 GCMs considered for the multimodel ensemble.
on the availability of data, primarily for future projections. Given that most of the models have different spatial resolutions (Table 1), all the model outputs were regridded to 1˚ × 1˚ resolution using bilinear interpolation [16]. The 15 GCM runs considered in this study cover two of the four representative concentration pathways (RCPs) designed as a new set of scenarios for the Fifth Assessment Report of the IPCC: the RCP4.5 and RCP8.5 scenarios [17]. In contrast to the SRES scenarios, RCPs represent pathways of radiative forcing, not detailed socio-economic narratives or scenarios [18], where, for example, RCP4.5 reaches a radiative forcing of 4.5 W/m2 by the year 2100. RCP4.5 show a stabilizing CO2 concentration, close to the median range of the existing literature; while RCP8.5 follows the upper range of available literature, with rapidly increasing concentrations [19]. Three periods of 30 years were considered in order to evaluate changes in future climate: the AMIP period (1979-2008); and projections for the early 21st century (2011-2040) and late 21st century (2071-2100).
3. Methodology
Precipitation is the primary factor controlling the formation and persistence of drought conditions, but evapotranspiration is also an important variable [20]. Given the difficulties in obtaining reliable observed and modeled evapotranspiration measures over SSA, a drought estimator based solely on precipitation totals was choosen.
In order to identify drought characteristics we used the Standardized Precipitation Index (SPI), developed by [21] for drought definition and monitoring. The SPI only requires monthly precipitation as input variable, which is a common variable in all GCMs outputs. This is a powerful, flexible index that is simple to calculate, was widely used in SSA proving to be a good estimator of both wet and dry conditions [9,22,23]. A detailed description of the calculation of the SPI can be found in [20]. A brief summary of the main assumptions for its calculation is presented. The SPI calculation for every gridpoint is based on the accumulated precipitation for a fixed time scale of interest. These series of accumulated precipitation were fitted to a gamma probability distribution, which is found to be one of the most suitable to fit the precipitation distribution in the region [24]. This procedure was performed for each time scale of interest and for each month of the year. The cumulative probability is then transformed to the standard normal random variable z with mean zero and variance of one, which is the value of the SPI [25]. In summary, the SPI quantifies the number of standard deviations that the accumulated rainfall in a given time scale deviates from the average value of a location in a particular period.
In this work we consider time scales of 3 (SPI3) and 12 (SPI12) months, which represents short-term and long-term droughts, respectively. Short-term droughts used to affect the agricultural sector, while long-term droughts have impacts on the water resources. Both sectors are extremely important in SSA. The SPI was calculated for the 3 and 12 months accumulated precipitation from the GPCC database and the simulated precipitation from the multi-model ensemble in the same time scales for the three time periods considered. Several thresholds for the SPI values can be found on literature in order to define drought events [21,26,27]. In this work we consider a drought event as the period of time where SPI values are below to −1.0, which means that precipitation departures from average conditions exceed one standard deviation. Three different parameters were used for drought characterization: a) frequency—number of droughts over the period of interest; b) duration—average duration of all drought events; and c) severity—average SPI value of all drought events. In order to compute the difference between baseline and future drought characteristics, we calculated the percentage of change of the early and late 21st century drought parameters with respect to the 1979-2008 period for both RCPs and time scales considered.
In the case where accumulated precipitation time series does not fit to the gamma probability function, those gridpoints were removed from the analysis. It is expected that the spatial distribution of grid points with non-significant fits show differences among the time scales considered for the accumulation and the precipitation data considered.
4. Results
4.1. Drought Climatology and Evaluation of Multi-Model Control Simulation (1979-2008)
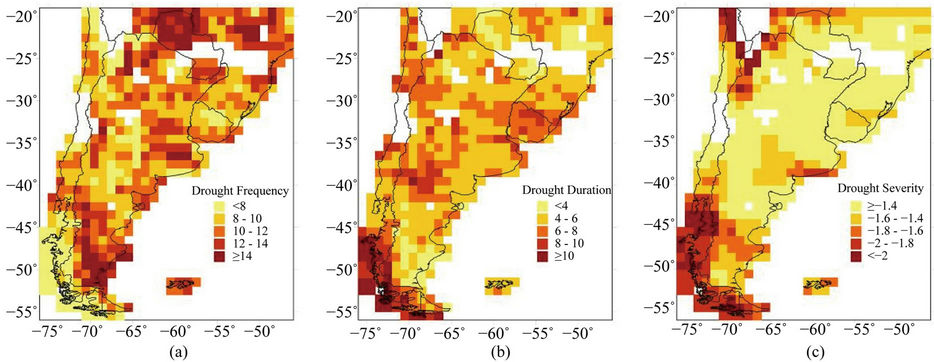
The main characteristics of drought events computed from SPI3 based on the CMIP5 multi-model ensemble for the 1979-2008 baseline are shown in Figure 1. Regarding drought frequency, most of the study area Registered between 15 and 30 droughts. The regions with higher drought frequency are located over the Argentinean Patagonia, northern Argentina and southern Brazil (Figure 1(a)). Those areas where the occurrence of droughts is more (less) common, corresponds with regions where its duration is shorter (longer) (Figure 1(b)). In average, droughts lasted between 2 and 3 months in most of the region, although in southern Chile short-term droughts can last almost 4 months. Concerning drought mean severity, higher values are located over the northwest and southwest portions of the domain (Figure 1(c)). Taking into account the drought categories defined for the SPI [20], this result indicates that, on average, severe droughts (SPI ≤ −1.5) were recorded in the above mentioned regions, as well as over most of Paraguay.
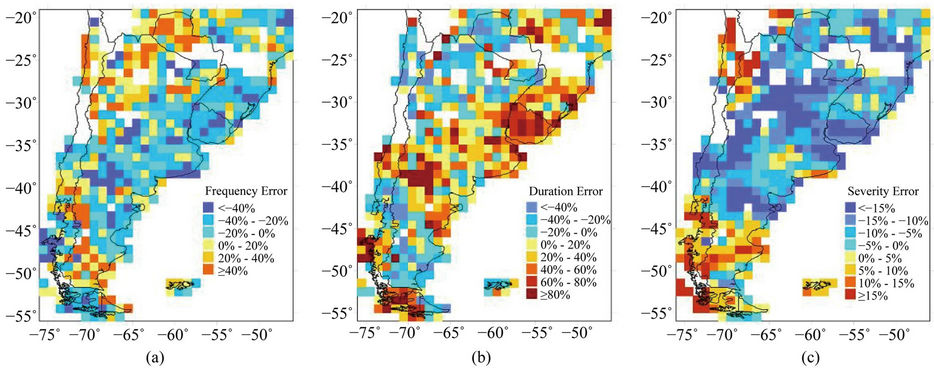
When this drought climatology is compared to the one obtained through the GPCC database, it appears that the CMIP5 ensemble subestimate drought frequencies over most of the study area (Figure 2(a)), mainly in the regions where drought frequency is low. The areas of subestimation in drought frequency are in concordance with areas with an overestimation of drought mean duration (Figure 2(b)). These areas are characterized by a subestimation of 20% - 40% for drought frequency and an overestimation of 20% - 60% in drought duration. There is also a subestimation of drought mean severity, of about 5% - 15%, mostly in the areas where mean severities are lower (Figure 2(c)). In summary, in most of SSA the CMIP5 ensemble tends to produce less number of short-term droughts, with higher duration and lower severity. There are some specific areas where the opposite occurs, with higher drought frequency followed by a decrease in their mean duration, as the case of southern Argentinean Patagonia, a portion of northern Argentina and a small region over the coast of Brazil.
Analyzing the characteristics of the long term drought,
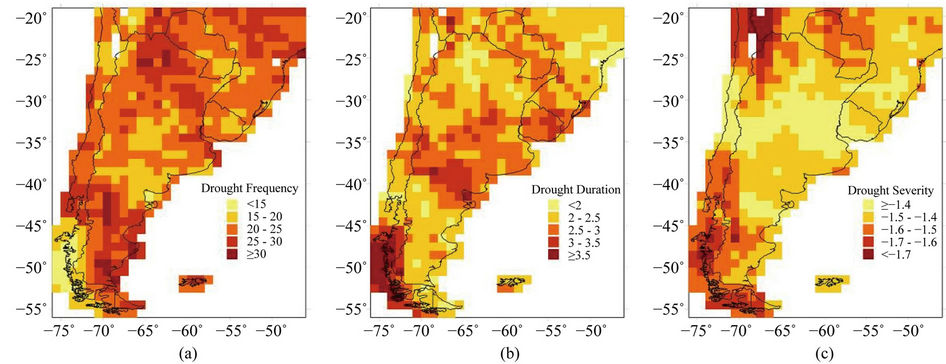
Figure 1. Drought climatology based on the multi-model ensemble for the SPI3. (a) Frequency; (b) mean duration and (c) mean severity of droughts. Period: 1979-2008. The white grid points over the continent correspond to locations where the gamma probability function does not significantly fit to the 3-month accumulated precipitation distribution.
Figure 2. Percentage errors in representation of drought characteristics by the multi-model ensemble when compared with GPCC dataset for the SPI3. Period: 1979-2008.
the multi-model ensemble based on SPI12 approximately shows the same areas of maximum and minimum severities, durations and frequencies than based on SPI3 (Figure 3). As the time period is lengthened to 12 months, the SPI responds more slowly to changes in precipitation, therefore, droughts were less frequent (~8 - 14 droughts during 1979-2008) and lasted longer (~4 - 10 months). When these results are compared with the drought climatology obtained through the GPCC database on a time scale of 12 months, the discrepancies seems to be higher than for short term droughts (Figure 4). This is indicative that the multi-model ensemble skill varies with the time scale considered in the calculation of the SPI. The northwestern and southwestern portions of SSA show errors towards an increase of drought events, with shorter durations and longer severities. The central portion of the domain shows the opposite pattern, with a heterogeneous spatial structure.
The above results could be indicative that long term droughts are spatially more complex than short term ones, although their temporal pattern is less variable. The discrepancies between the multi-model ensemble and the GPCC database could respond to biases in the simulation of mean precipitation patterns in SSA, which was identified in [28,29]; and also to biases unrelated to errors in the mean patterns, like the representation of seasonal and inter-annual precipitation variabilities [30] that are important for drought development.
4.2. Projected Changes in Drought Characteristics: 2011-2040
The RCPs scenario projections for the period 2011-2040 show that, in average, the occurrence of short-term and long-term droughts will be more frequent with respect of 1979-2008 period, with shorter durations and greater
severities (Figures 5 and 6). This is indicative of a future increase in the inter-annual variability of precipitation in SSA, which was already documented for the second half of the 20th century by [7,24]. Therefore, changes in the mean state of climate, and more specifically, precipitation, will have superimposed an increase in the seasonal and inter-annual variabilities that will enhance the occurrence of precipitation extremes, in this case, droughts. Regarding SPI3, both RCP4.5 and RCP8.5 scenarios show approximately the same spatial pattern, which indicates that an increase in greenhouse gasses concentration will have little impact in future changes of shortterm droughts during early 21st century (Figure 5). A large part of the study area will experience decreases of 10% - 30% in drought duration and increases of 10% - 60% in drought frequency. The major changes in drought severity are located in the central portions of Argentina and Chile, Uruguay and southern Brazil, with a well defined increase. Severity increases will be between 5% and 15% for the central portion of SSA.
In the case of long-term droughts, the regional pattern of changes is not as well defined as for short-term droughts (Figure 6). This could be related with the spatial structure of its climatology (Figure 3) and also can be associated to model uncertainties in the representation of precipitation accumulated over longer time scales. The expected changes in long-term drought parameters are greater than the changes for short-term droughts. In the case of the RCP4.5 projection, it is expected that La Plata Basin experience more and severe droughts in the 2011-2040 period, with increases of more than 30% in drought frequency and more than 10% in drought severity. This is also verified for the RCP8.5 projection, although with a diminished magnitude in the changes. Variations according to RCP8.5 scenario show an important increase in drought severity in central-west Argentina and central Chile and in northern Patagonia. Southern Patagonia shows a clear dipole pattern, with higher (lower) drought frequencies over the Chilean (Argentinean) portion, accompanied with lower (higher)
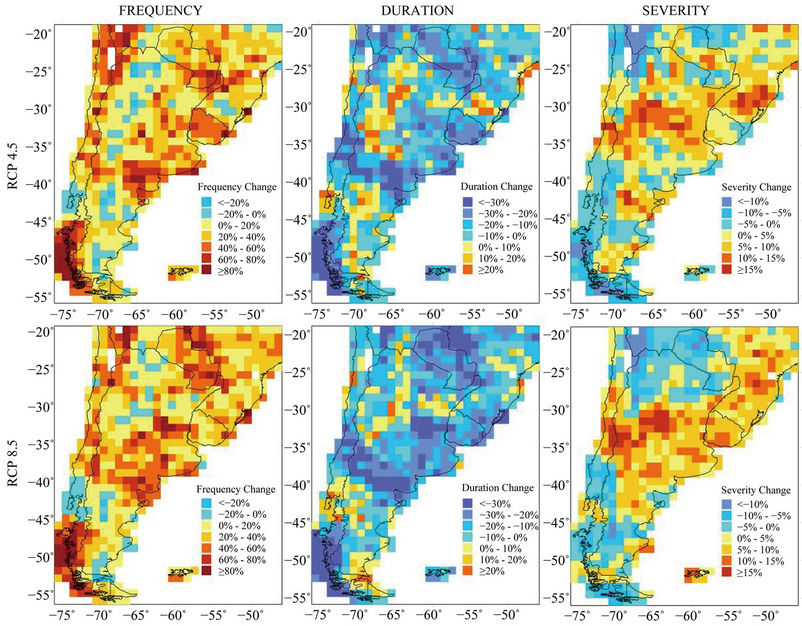
Figure 5. Mean changes in SPI3 drought characteristics projected by the multi-model ensemble for the period 2011-2040 relative to the 1979-2008 baseline along the RCP4.5 (top) and RCP8.5 (bottom) scenarios.
durations and severities (Figure 6).
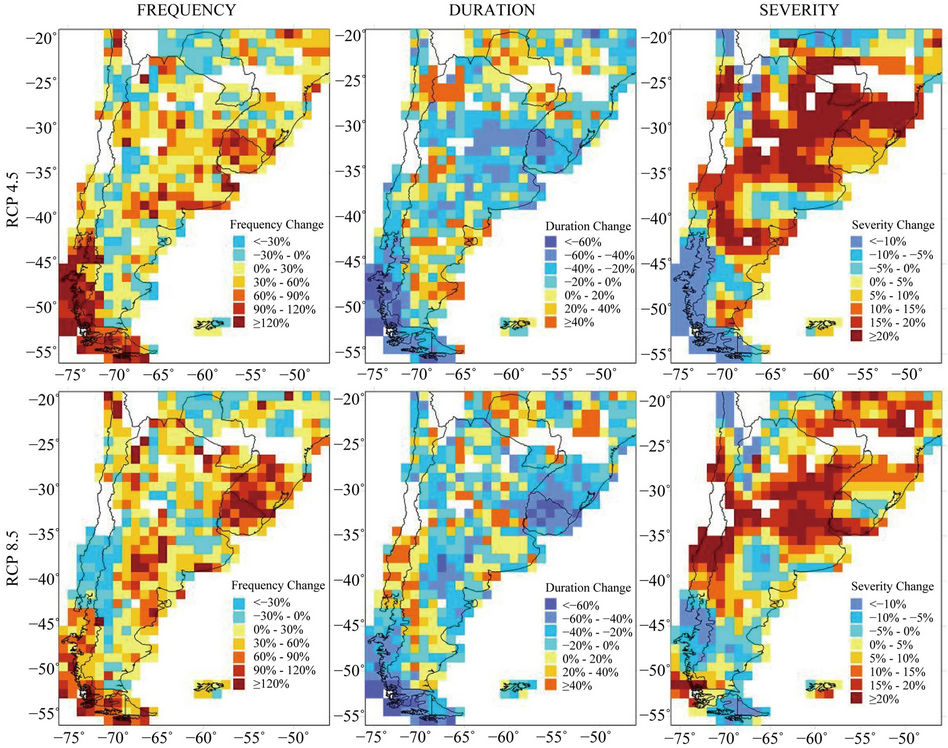
4.3. Projected Changes in Drought Characteristics: 2071-2100
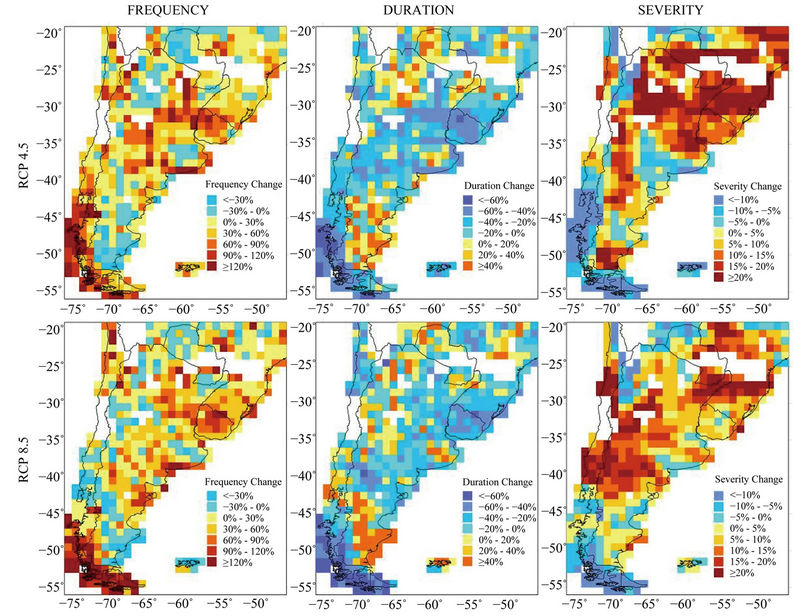
Projections for the late 21st century also show approximately the same spatial pattern of expected changes (Figures 7 and 8). The multi-model ensemble produces more drought events of shorter duration and greater severities over a large portion of SSA. The spatial extension of changes in short-term drought characteristics is greater for 2071-2100 than for 2011-2040 (Figures 5 and 7), although the magnitude of the expected changes remains similar. This is not evident in the case of long-term droughts (Figures 6 and 8). Major changes will be experienced over central Argentina and Uruguay in all the SPI3 drought parameters (Figure 7). Changes in longterm drought severity are important in magnitude and spatial extension, and are located over the central and northeastern portions of SSA (Figure 8). In the case of drought duration, higher uncertainty exists at a regional scale for long-term droughts, with a noisy spatial pattern. As in the case of the projections for 2011-2040, both scenarios show the same changes for long-term drought characteristics, although increases in drought severity are larger under future scenario RCP4.5 than future scenario RCP8.5 (Figures 7 and 8).
5. Summary and Conclusions
This study used the SPI as a drought indicator, in order to evaluate the present day simulations of a CMIP5 multimodel ensemble for the AMIP period (1979-2008) against observations using the GPCC 1˚ × 1˚ dataset; and to establish future changes in drought characteristics over SSA projected by two RCP scenarios for early and late 21st century.
For the 1979-2008 baseline period, the CMIP5 ensemble tends to produce less number of droughts over most of SSA, with higher duration and lower severity, although there are some specific areas where the opposite occurs. The multi-model ensemble skill varies with the
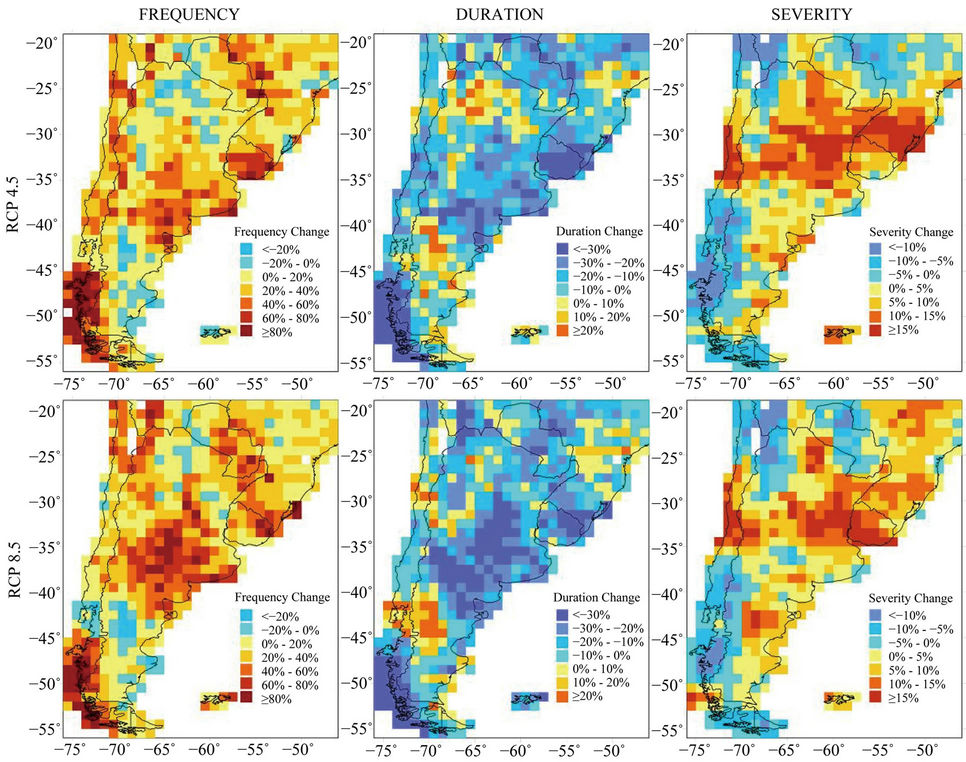
Figure 7. Mean changes in SPI3 drought characteristics projected by the multi-model ensemble for the period 2071-2100 relative to the 1979-2008 baseline along the RCP4.5 (top) and RCP8.5 (bottom) scenarios.
time scale considered in the calculation of the SPI, with larger discrepancies for the estimation of long-term drought characteristics (SPI12). Taking into account the heterogeneous spatial pattern for the SPI12 climatology, we can conclude that there is a high uncertainty in the estimation of long term droughts through the CMIP5 ensemble; although this kind of droughts could by spatially more complex than short term droughts, something already mentioned in [31]. The discrepancies between the multi-model ensemble and the GPCC database could respond to biases in the simulation of mean precipitation patterns over SSA and biases in the representation of seasonal and inter-annual variabilities, which are important for drought development. A bias correction could be applied to the precipitation data for each of the model outputs, but, as stated in [32], this is a troubling procedure and it is not known whether the same bias correction to model outputs will be valid in a future climate.
Future projections indicate that, under the two RCPs used, climate change will have large effects on drought characteristics over SSA. The occurrence of short-term and long-term droughts will be more frequent in the 21st century, with shorter durations and greater severities over much of SSA. The increases in drought frequency changes will be about 10% - 30%; accompanied with increases of 5% - 15% in the mean drought severity and a decrease of 10% - 30% in the mean drought duration. Therefore, it is expected a future increase in the seasonal and inter-annual variability of precipitation in SSA that can result in economic losses for the region if proper adaptation measures are not proposed timely. Hence, drought contingency plans should take these results into account in order to alleviate future drought effects in the agricultural and water resources sectors. The RCP4.5 and RCP8.5 scenarios will have approximately the same effect on droughts, since no significant differences are observed on drought frequencies, durations and severities. This result was already found in [33] for the SRES emission pathways at a global scale. The authors stated that the already accumulated greenhouse gases and the thermal inertia of the oceans could contribute to the increase in drought occurrence. If we consider that the multimodel ensemble tends to underestimate drought frequency, if this bias remains for the future, the panorama for the 21st century could be more dramatic.
6. Acknowledgements
This work has been supported by the projects UBA- 20020100100789 from the University of Buenos Aires and CONICET PIP 227 from the National Council of Scientific and Technical Research. The authors would like to thank Hernán Bechis for his technical contribution analyzing the model outputs at an early stage.
REFERENCES
- A. K. Mishra and V. P. Singh, “A Review of Drought Concepts,” Journal of Hydrology, Vol. 391, No. 1-2, 2010, pp. 202-216. doi:10.1016/j.jhydrol.2010.07.012
- UNISDR: The United Nations Office for Disaster Reduction, “Impacts of Disasters Since the 1992 Rio de Janeiro Earth Summit,” 2012. http://www.unisdr.org/files/27162_2012no21.pdf
- IPCC, “Climate Change 2007: The Physical Science Basis,” In: S. Solomon, D. Qin, M. Manning, Z. Chen, M. Marquis, K. B. Averyt, M. Tignor and H. L. Miller, Eds., Contribution of Working Group I to the Fourth Assessment Report of the Intergovernmental Panel on Climate Change, Cambridge University Press, Cambridge, New York, 2007, p. 996.
- C. A. S. Cohelo and L. Goddard, “El Niño-Induced Tropical Droughts in Climate Change Projections,” Journal of Climate, Vol. 22, No. 23, 2009, pp. 6456-6476. doi:10.1175/2009JCLI3185.1
- J. L. Minetti, W. M. Vargas, A. G. Poblete, L. R. Acuña and G. Casagrande, “Non-linear Trends and Low Frequency Oscillations in Annual Precipitation Over Argentina and Chile,” Atmósfera, Vol. 16, 2003, pp. 119-135.
- O. C. Penalba and W. M. Vargas, “Interdecadal and Interannual Variations of Annual and Extreme Precipitation Over Central-Northeastern Argentina,” International Journal of Climatology, Vol. 24, No. 12, 2004, pp. 1565-1580. doi:10.1002/joc.1069
- V. R. Barros, M. E. Doyle and I. A. Camilloni, “Precipitation Trends in Southeastern South America: Relationship with ENSO Phases and with Low-Level Circulation,” Theoretical and Applied Climatology, Vol. 93, No. 1-2, 2008, pp. 19-33. doi:10.1007/s00704-007-0329-x
- J. A. Rivera, O. C. Penalba and M. L. Bettolli, “InterAnnual and Inter-Decadal Variability of Dry Days in Argentina,” International Journal Of Climatology, Vol. 33, No. 4, 2012, pp. 834-842. doi:10.1002/joc.3472
- C. M. Krepper and G. V. Zucarelli, “Climatology of Water Excess and Shortages in the La Plata Basin,” Theoretical and Applied Climatology, Vol. 102, No. 1-2, 2012, pp. 13-27. doi:10.1007/s00704-009-0234-6
- U. Schneider, A. Becker, P. Finger, A. Meyer-Christoffer, B. Rudolf and M. Ziese, “GPCC Full Data Reanalysis Version 6.0 at 1.0˚: Monthly Land-Surface Precipitation from Rain-Gauges Built on GTS-based and Historic Data,” 2011. doi:10.5676/DWD_GPCC/FD_M_V6_100
- S. C. Chou, J. F. Bustamante and J. L. Gomes, “Evaluation of Eta Model Seasonal Precipitation Forecasts over South America,” Nonlinear Processes in Geophysics, Vol. 12, No. 4, 2005, pp. 537-555. doi:10.5194/npg-12-537-2005
- D. A. Vila, L. G. G. de Goncalvez, D. L. Toll and J. R. Rozante, “Statistical Evaluation of Combined Daily Gauge Observations and Rainfall Satellite Estimates over Continental South America,” Journal of Hydrometeorology, Vol. 10, No. 2, 2009, pp. 533-543. doi:10.1175/2008JHM1048.1
- S. Blenkinsop and H. J. Fowler, “Changes in European Drought Characteristics Projected by the PRUDENCE Regional Climate Models,” International Journal of Climatology, Vol. 27, No. 12, 2007, pp. 1595-1610. doi:10.1002/joc.1538
- K. Strzepek, G. Yohe, J. Neumann and B. Boehlert, “Characterizing Changes in Drought Risk for the United States from Climate Change,” Environmental Research Letters, Vol. 5, No. 4, 2010, pp. 1-9. doi:10.1088/1748-9326/5/4/044012
- K. E. Taylor, R. J. Stouffer and G. A. Meehl, “An Overview of CMIP5 and the Experiment Design,” Bulletin of the American Meteorological Society, Vol. 93, No. 4, 2012, pp. 485-498. doi:10.1175/BAMS-D-11-00094.1
- C. Accadia, S. Mariani, M. Casaioli, A. Lavagnini and A. Speranza, “Sensitivity of Precipitation Forecast Skill Scores to Bilinear Interpolation and a Simple NearestNeightbor Average Method on High-Resolution Verification Grids,” Weather and Forecasting, Vol. 18, No. 5, 2003, pp. 918-932. doi:10.1175/1520-0434(2003)018<0918:SOPFSS>2.0.CO;2
- R. H. Moss, et al., “The Next Generation of Scenarios for Climate Change Research and Assessment,” Nature, Vol. 463, 2010, pp. 747-756. doi:10.1038/nature08823
- R. K. Chaturvedi, J. Joshi, M. Jayaraman, G. Bala and N. H. Ravindranath, “Multi-Model Climate Change Projections for India under Representative Concentration Pathways,” Current Science, Vol. 103, No. 7, 2012, pp. 791- 802.
- K. A. Hibbard, D. P. van Vuuren and J. Edmonds, “A Primer on the Representative Concentration Pathways (RCPs) and the Coordination Between the Climate and Integrated Assessment Modeling Communities,” CLIVAR Exchanges, Vol. 16, No. 2, 2011, pp. 12-15.
- B. Lloyd-Hughes and M. A. Saunders, “A Drought Climatology for Europe,” International Journal of Climatology, Vol. 22, No. 13, 2002, pp. 1571-1592. doi:10.1002/joc.846
- 21T. B. McKee, N. J. Doesken and J. Kleist, “The Relationship of Drought Frequency and Duration to Time Scales,” Proceedings of the 8th Conference on Applied Climatology, California, 17-22 January 1993, pp. 179-184.
- R. A. Seiler, M. Hayes and L. Bressan, “Using the Standardized Precipitation Index for Flood Risk Monitoring,” International Journal of Climatology, Vol. 22, No. 11, 2002, pp. 1365-1376. doi:10.1002/joc.799
- J. A. Rivera and O. C. Penalba, “How Temporal Changes in Gamma Distribution Parameters Influence the Standardized Precipitation Index Estimation? Error Analysis in Drought Categorization in Southeastern South America,” Proceedings of the XI Argentinean Meteorology Congress, Mendoza, 28 May-1 June 2012, CD-ROM.
- O. C. Penalba and J. A. Rivera, “Using the Gamma Distribution to Represent Monthly Rainfall in Southeastern South America. Spatio-Temporal Changes in its Parameters,” Proceedings of the XI Argentinean Meteorology Congress, Mendoza, 28 May-1 June 2012, CD-ROM.
- D. C. Edwards and T. B. McKee, “Characteristics of 20th Century Dorught in the United States at Multiple Time Scales,” Atmospheric Science Paper No. 634, Colorado State University, Fort Collins, Colorado, 1997.
- I. Bordi, K. Fraedrich, J.-M. Jiang and A. Sutera, “SpatioTemporal Variability of Dry and Wet Periods in Eastern China,” Theoretical and Applied Climatology, Vol. 79, No. 1-2, 2004, pp. 81-91. doi:10.1007/s00704-004-0053-8
- S. Morid, V. Smakhtin and M. Moghaddasi, “Comparison of Seven Meteorological Indices for Drought Monitoring in Iran,” International Journal of Climatology, Vol. 26, No. 7, 2006, pp. 971-985. doi:10.1002/joc.1264
- J. Blazquez and M. N. Nuñez, “Analysis of Uncertainties in Future Climate Projections for South America: Comparison of WCRP-CMIP3 and WCRP-CMIP5 Models,” Climate Dynamics, Vol. 41, No. 3-4, 2013, pp. 1039-1056. doi:10.1007/s00382-012-1489-7
- C. Gulizia and I. Camilloni, “Comparative analysis of the ability of a set of CMIP3 and CMIP5 global climate models to represent the precipitation in South America,” International Journal of Climatology, 2012, Unpublished.
- C. S. Vera, C. Junquas and L. Díaz, “Variability and Trends in Summer Precipitation in South Eastern South America through the WCRP/CMIP5 Models,” Proceedings of the XI Argentinean Meteorology Congress, Mendoza, 28 May-1 June 2012, CD-ROM.
- S. M. Vicente-Serrano, “Differences in Spatial Patterns of Drought on Different Time Scales: An Anamysis of the Iberian Peninsula,” Water Resources Management, Vol. 20, No. 1, 2006, pp. 37-60. doi:10.1007/s11269-006-2974-8
- H. J. Fowler and C. G. Kilsby, “Future Increases in UK Water Resource Drought Projected by a Regional Climate Model,” Proceedings of the BHS International Conference on Hydrology: Science & Practice for the 21st Century, London, 12-16 July 2004, pp. 15-21.
- J. Sheffield and E. F. Wood, “Projected Changes in Drought Occurrence Under Future Global Warming from Multi-Model, Multi-scenario, IPCC AR4 Simulations,” Climate Dynamics, Vol. 31, No. 1, 2008, pp. 79-105. doi:10.1007/s00382-007-0340-z