International Journal of Modern Nonlinear Theory and Application
Vol.3 No.3(2014), Article ID:47805,13 pages
DOI:10.4236/ijmnta.2014.33008
Maximum Power Point Tracking Control Using Neural Networks for Stand-Alone Photovoltaic Systems
Rihab Mahjoub Essefi, Mansour Souissi, Hsan Hadj Abdallah
Control and Energy Management Laboratory, National School of Engineering of Sfax, Sfax, Tunisia
Email: rihab.mahjoub@yahoo.fr
Copyright © 2014 by authors and Scientific Research Publishing Inc.
This work is licensed under the Creative Commons Attribution International License (CC BY).
http://creativecommons.org/licenses/by/4.0/
![]()
![]()

Received 18 May 2014; revised 25 June 2014; accepted 2 July 2014
ABSTRACT
The employment of maximum power point tracking techniques in the photovoltaic power systems is well known and even of immense importance. There are various techniques to track the maximum power point reported in several literatures. In such context, there is an increasing interest in developing a more appropriate and effective maximum power point tracking control methodology to ensure that the photovoltaic arrays guarantee as much of their available output power as possible to the load for any temperature and solar radiation levels. In this paper, theoretical details of the work, carried out to develop and implement a maximum power point tracking controller using neural networks for a stand-alone photovoltaic system, are presented. Attention has been also paid to the command of the power converter to achieve maximum power point tracking. Simulations results, using Matlab/Simulink software, presented for this approach under rapid variation of insolation and temperature conditions, confirm the effectiveness of the proposed method both in terms of efficiency and fast response time. Negligible oscillations around the maximum power point and easy implementation are the main advantages of the proposed maximum power point tracking (MPPT) control method.
Keywords:Maximum Power Point Tracking (MPPT), Photovoltaic (PV) System, Neural Network, Buck Converter

1. Introduction
In the last few decades, harnessing solar energy found its high usefulness as a way to solve the problems of the energy crisis, due to the continuously growth of the global energy demand, and the global warming from the wide spread utilization of fossil fuels [1] . Solar energy is directly convertible into electrical energy by means of photovoltaic arrays through semi-conductors [2] . However, solar photovoltaic energy, still presents a vast area of competition comparing to conventional energy resources due its high installation cost and the low energy conversion efficiency of PV cells [3] . Therefore, several studies are being developed in order to minimize these drawbacks by optimizing the performance of PV systems through the operation of conversion systems to increase the output efficiency of the overall system. This approach is commonly named as Maximum Power Point Tracking (MPPT) [4] . The MPPT is a controlled DC/DC converter inserted between the PV source and the load that monitors the photovoltaic array to operate at its maximum power point (MPP) depending on the load state, PV array generation, PV cell temperature and solar radiation variations [5] . In such a direction, previous researches have focused on different MPPT techniques and algorithms. They differ in many aspects such as complexity, sensors required, convergence speed, cost and range of effectiveness. The most encountered methods known as the hill-climbing techniques, examples include P&O method and incremental conductance method. Those methods are the most commonly applied in practice due to their simplicity and ease of implementation. However, the shortcomings are also well-known: oscillations around the MPP and they can get lost and track the MPP in the wrong direction under sudden atmospheric conditions changes [6] . More recently, intelligent methods as fuzzy logic and artificial neural networks are being adopted for photovoltaic applications, mainly because of their flexibility, symbolic reasoning and explanation capabilities that are useful to deal with strong nonlinearities and complex systems [6] . In all cases, the proposed MPPT techniques ensure MPP from PV array. However, since hill-climbing methods determine the MPP by moving the functioning along the P-V curve of the PV array, they cannot deliver fast decision face to climate disturbance or load fluctuation. Hence an overall system delay is consequently observed [5] . Many researches have estimated the MPPT by neural networks method and calculated the MPP of the PV array by the neural network controller. This work aims to simulate and control a stand-alone PV system in order to continuously harvest maximum power from the PV array. For that purpose, this paper proposes an effective MPPT technique for DC/DC converter connecting a PV array with a load stage. The structure of the proposed MPPT control method is based on the use of neural network controllers. This controller can track the MPP not only accurately but also its dynamic response is very fast in response to the change of climatic parameters in comparison with the conventional MPPT control methods. The benefits of using neural networks are that there is no requirement for knowledge on internal PV system parameters, less computational effort and they provide a compact solution for multivariable problems. The present paper will be organized as follows. Next section describes the photovoltaic system configuration. The photovoltaic array and the DC/DC converter modeling are exposed in Section 3. Section 4 presents the maximum power point tracking strategy, the validation of the proposed approach is provided in Section 5. In Section 6, conclusions end this paper.
2. Photovoltaic System Configuration
The model scheme of the studied stand-alone photovoltaic system and its control are as shown in Figure 1. It consists of a PV array, a DC bus capacitor, a DC/DC converter, a load stage and an MPPT control unit. When the sunlight strikes the photovoltaic array, this latter converts solar energy to electric energy. The electric energy is then fed to the DC power stage which is used to adjust the PV array output voltage to a value corresponding to the maximum power deliverable to the load. The MPPT control bloc, which is the key bloc of our system and necessary to obtain the maximum power from the PV array under any variation of irradiation and temperature, includes two main parts: first, the neural network controller which receives solar radiation and photovoltaic cell temperature as inputs and estimates the optimum PV array voltage corresponding to maximum power as output. Second, the power stage control which switches the power transistor ON and OFF to carry out the maximum power from the PV array, it is a dual-loop feedback control, the external loop is voltage loop, while the internal loop is output current loop, those loops are adjusted through PI control and then will be regarded as modulation wave to compare with high frequency triangular wave in PWM wave generator.
3. Photovoltaic System Modeling
For convenience and completeness of the paper, we will explain hereafter the plant modeling which is an essential step for the control analysis, so special care should be taken to ensure its accuracy. The modeling of the system can be divided into two parts: modeling of the PV array and the modeling of the buck type DC/DC converter.
3.1. PV Array Model
To design the model of the photovoltaic array, we should first focus on finding the electrical equivalent to that source. For that purpose, it is worthwhile to deduce the electrical model of a PV array from that of a single PV cell circuit. For accurate modeling, two diode circuits could have been used but our scope of work is limited to single diode model. This model is useful to simulate the PV array behavior with Matlab/Simulink software, it is a test bed of several works found in the literature [5] [7] [8] . A photovoltaic cell is basically a p-n junction semiconductor which converts solar light energy into electricity. Parameters of the solar cell are modeled as in Figure 2.
Conceptually, photovoltaic cells are grouped together in order to form photovoltaic
modules [9] . A photovoltaic array is composed
of
![]() parallel modules each one including
parallel modules each one including
 photovoltaic cell serial connected [5] . The
relationship between the PV array output current and voltage is given by:
photovoltaic cell serial connected [5] . The
relationship between the PV array output current and voltage is given by:
 (1)
(1)
where
![]() and
and
![]() are respectively the PV array output current and voltage,
are respectively the PV array output current and voltage,
![]() the generated photocurrent,
the generated photocurrent,
![]() and
and
![]() respectively the serial and the parallel resistances of the PV cell,
respectively the serial and the parallel resistances of the PV cell,
![]() is the electron charge,
is the electron charge,
![]() the Boltzman’s constant, A is the p-n junction ideality factor,
the Boltzman’s constant, A is the p-n junction ideality factor,
![]() is the cell temperature and
is the cell temperature and
![]() is related to the temperature
is related to the temperature
![]() as follows:
as follows:
 (2)
(2)
where
 is the cell reference temperature,
 is the reverse saturation current at
 and
and
![]() is the
is the
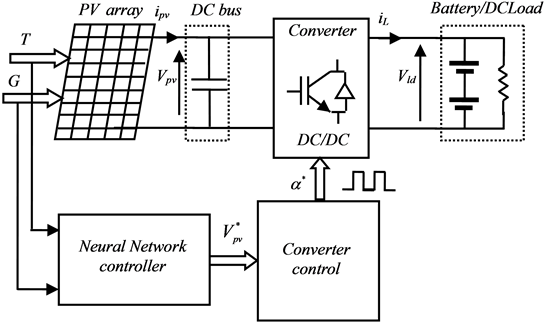
Figure 1. System configuration.

Figure 2. Equivalent circuit of a photovoltaic cell.
band-gap energy of the semiconductor used in the cell. Similarly, the photocurrent
![]() depends on the solar radiation and the cell temperature as follows:
depends on the solar radiation and the cell temperature as follows:
 (3)
(3)
where
 is the photovoltaic array short-circuit current at
 and reference radiation,
![]() is the solar radiation and
is the solar radiation and
 the temperature coefficient for short circuit current. The PV array power is then
calculated as,
the temperature coefficient for short circuit current. The PV array power is then
calculated as,
![]() (4)
(4)
3.2. Buck Converter Model
As previously mentioned, a step-down DC/DC converter is inserted between the PV array and the load stage in order to drive the operating point of the PV array to the maximum power point which is detected by the neural network controller. This is accomplished by varying the duty cycle of the DC/DC conveter and thus adjusting the PV array output voltage.
Referring to Figure 3, the buck converter transfer function is obtained by considering its steady state operation as follows:
![]() (5)
(5)
where
 is the duty cycle given by the power stage control,
 is the output voltage and
![]() the output PV array voltage. In current terms, the latter transfer function can
be rewritten as following:
the output PV array voltage. In current terms, the latter transfer function can
be rewritten as following:
 (6)
(6)
where
![]() and
and
![]() are the DC/DC input and output currents respectively. From the above equations,
we can deduce that;
are the DC/DC input and output currents respectively. From the above equations,
we can deduce that;
 and
and
 are the input-output voltage and current couples respectively across the DC/DC converter.
The differential equations that describe the input and the output of the DC/DC buck converter respectively are obtained through the direct application of Kirchoff’s current and voltage laws. They are expressed as follows:
 (7)
(7)
 (8)
(8)
where
![]() and is the capacitance of the DC-bus capacitor and
and is the capacitance of the DC-bus capacitor and
![]() its leakage resistance,
its leakage resistance,
![]() and
and
 represent respectively the inductance and the equivalent series resistance of the
output filter,
represent respectively the inductance and the equivalent series resistance of the
output filter,
 is the voltage of the load stage.
4. MPPT Control Strategy
As was previously explained, MPPT techniques are necessary in photovoltaic applications because the maximum
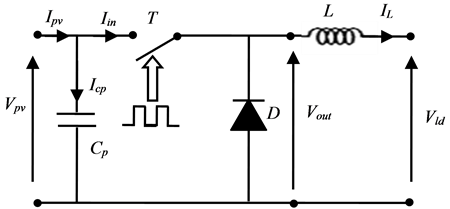
Figure 3. Equivalent circuit of the buck converter.
power point of photovoltaic arrays varies with irradiation and temperature so that,
the use of MPPT techniques is highly required in order to obtain the maximum power
from a solar array. Over the past decades, many methods to find MPP have been developed
and published. Among these techniques, the Perturb & Observe, an improvement
over perturb & observe algorithm, was suggested by using Incremental Conductance
algorithm, after this, a method based on evaluation of Parasitic Capacitance was
used, and so on [6] . In the present application,
a different kind of MPPT approach using artificial neural network has been employed.
In this technique two stages are achieved to track MPP of PV array. In the first
stage, by the acquisition of the weather parameters “![]() ” (irradiation) and “
” (irradiation) and “![]() ” (temperature), which are the inputs of the
neural network controller, we estimate the optimal voltage corresponding to the
MPP. In the second stage, the error between the optimal voltage, which is the output
of the neural network controller, and the measured output voltage of the PV array
is fed to the power stage control in order to generate the optimal duty cycle for
driving the DC/DC converter close to the MPP. The input and output data are from
the model based simulations results. This proposed structure depends on the PV array
characteristic curve.
” (temperature), which are the inputs of the
neural network controller, we estimate the optimal voltage corresponding to the
MPP. In the second stage, the error between the optimal voltage, which is the output
of the neural network controller, and the measured output voltage of the PV array
is fed to the power stage control in order to generate the optimal duty cycle for
driving the DC/DC converter close to the MPP. The input and output data are from
the model based simulations results. This proposed structure depends on the PV array
characteristic curve.
4.1. Neural Network MPPT Controller
Recently, neural network (NN) controllers have been strongly developed not only in theory but also in application [10] , they have attracted widespread interest in electrical engineering and they have been introduced in various fields of electro-technical applications, such as, in the tracking of the MPP in the PV systems. Those controllers have the advantage to be robust and relatively simple to design as they don’t require the knowledge of physical definitions with exact model for PV array and have self adapting capabilities [11] .
NN can generally be thought of as black box device that accepts inputs and generates outputs [5] . In our application, it is used to estimate the optimum voltage which corresponds to the MPP at any given solar radiation and PV array temperature. For that purpose, we elaborated a linear network that, when presented with a set of given input vectors, produces output of corresponding target vectors. For each input vector we can calculate the network’s output vector. The difference between an output vector and its target vector is the error. Unlike most other network architectures, NNs can be designed directly if input/target vector pairs are known. The main goal of linear NN is to find values for the network weights and biases such that the sum of the squares of the errors is minimized or below a specific value by using the function “newlind”. The following formula expresses the average of the sum of these errors [11] :
 (9)
(9)
where
 is the number of elements in the input vector read by the network,
 is the target vector and
![]() is the output vector.
is the output vector.
As shown in Figure 4, the NN controller consists
of three layers. The input layer is composed of two nodes in inputs that are, the
PV array temperature
![]() and the solar radiation
and the solar radiation![]() . The hidden layer composed of one hundred nodes
whose function of activation is “purelin”. The output layer is composed of one node
that the optimum voltage which corresponds to MPP.
. The hidden layer composed of one hundred nodes
whose function of activation is “purelin”. The output layer is composed of one node
that the optimum voltage which corresponds to MPP.
4.2. Power Stage Control
Referring to Figure 1 and Figure 4, the output of the power stage control is used as a driver signal to turn ON and OFF the power transistor to carry out the maximum power from the PV source. When the transistor is switched ON, the current in the buck inductor increases linearly, so that the diode is turned OFF. However, when the transistor is switched OFF, the energy stored in the inductor is released through the diode to the load.
The power stage control is depicted in Figure 5.
As it can be seen, it is designed with a cascade of two PI control loops, the first
one is implemented at the DC link capacitor for the optimum output PV array voltage
regulation, the second, is placed at the output
![]() filter to regulate the current injected to the load. The choice of proportional
integral corrector provides the precision of the system and does not have any impact
on stability and damping. Indeed, the presence of the integrator increase the degree
of the system but the zero allows maintaining system stability.
filter to regulate the current injected to the load. The choice of proportional
integral corrector provides the precision of the system and does not have any impact
on stability and damping. Indeed, the presence of the integrator increase the degree
of the system but the zero allows maintaining system stability.
The development of the PI controllers is as follows: by applying Laplace transformation for Equation (7), we get:
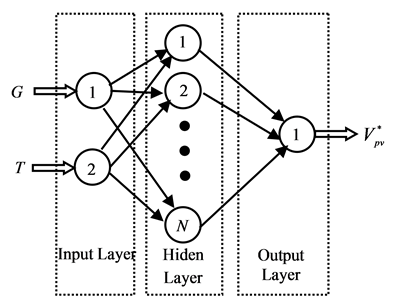
Figure 4. The neural network architecture.
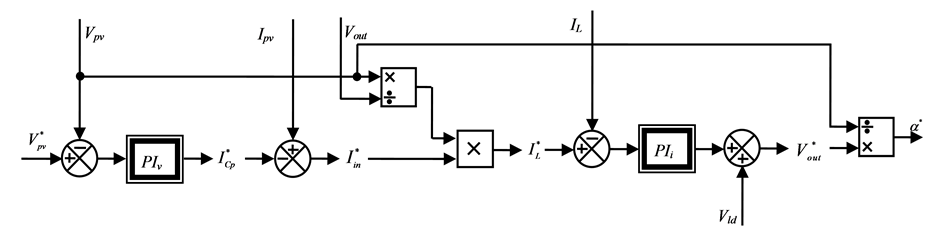
Figure 5. Structure of the proposed power stage control.
![]() (10)
(10)
where,
 (11)
(11)
A closed loop for Equation (10) gives us the following equation:
 (12)
(12)
 denotes the PI voltage controller which is developed by poles
placement for stabilization of Equation (10). Then we can deduce the equation of
the reference output current of the converter as following according to Equation
(5):
denotes the PI voltage controller which is developed by poles
placement for stabilization of Equation (10). Then we can deduce the equation of
the reference output current of the converter as following according to Equation
(5):
 (13)
(13)
This term will be incorporated in the current control loop of the inductance. Laplace transformation for Equation (8) gives us the following equation:
 (14)
(14)
where,
 (15)
(15)
A closed loop current control for Equation (14) gives us the following equation:
 (16)
(16)
![]() denotes the PI current controller. Substituting the term
denotes the PI current controller. Substituting the term
 in Equation (5) yields the optimal duty cycle which is used to pilot the DC/DC converter.
5. Simulation Results
The proposed electrical power system was simulated with the software package Matlab/Simulink. In detail Sim Power Systems, toolbox was used to guarantee the electrical behaviors of the PV system. The parameters of the photovoltaic array and the electrical power system which were simulated are given in Table 1 and Table 2 respectively.
Based on the fact that the PV array outputs depend on solar radiation and ambient temperature as in Equations (1) and (3), Figure 6 give the power-voltage (P-V) and the current-voltage (I-V) characteristics for different values of solar radiation G and with constant ambient temperature T = 25˚C.
Figure 7 presents the same parameter curves for
different ambient temperature T but with constant solar radiation
 W/m2.
W/m2.
From these characteristics, it can be concluded that the increase in solar radiation leads to an increase of the operating point for maximum power generated. We can also observe that the current due the cut-off circuit is positively varying with solar radiation variations, whereas the voltage in the open circuit remains quasi constant. Figure 7 shows that the effect of temperature is slightly significant. The temperature has a negligible effect on the cut-off circuit current. However, the open circuit voltage decays as the temperature increases.
In a first step, in order to evaluate the proposed neural network controller, three statistical parameters have been calculated for the test sets, the average percentage absolute error APAE, the mean bias error MBE and the root mean square error RMSE. The APAE is defined as follows [12] :

Table 1. PV array parameters at STC (25˚C and 1 KW/m2).
Table 2. Electrical power system parameters.
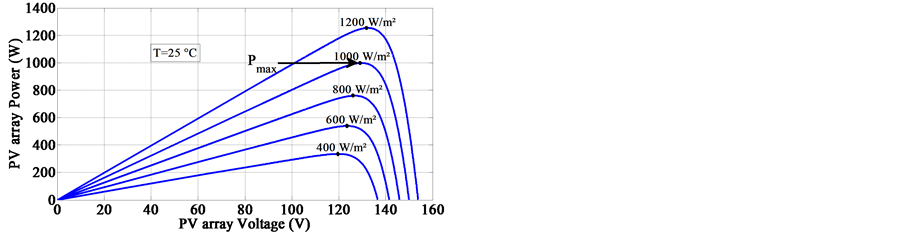
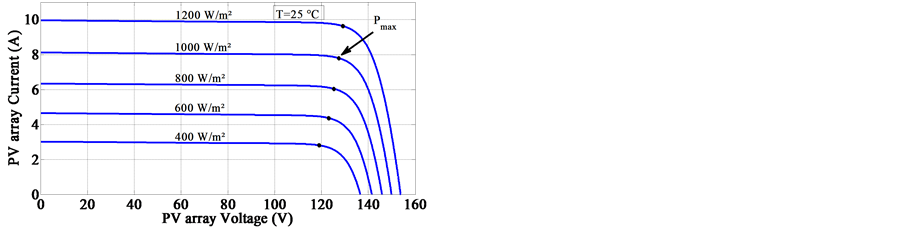
Figure 6. Simulated P-V and I-V characteristics of the PV array at constant temperature.
 (17)
(17)
where
![]() is the number of patterns,
is the number of patterns,
 is the
![]() measured optimum voltage by true MPPT of the PV array; and
measured optimum voltage by true MPPT of the PV array; and
![]() is the
is the
![]() estimated optimum voltage with NN of the PV array. The MBE gives an indication of
the average deviation of the estimated values from the corresponding measured data.
A positive MBE value indicates the amount of overestimation in the estimated data
and vice versa. Finally, the RMSE represents a measure of the variation of estimated
values around the measured data [10] . The expressions
of MBE and RMSE are expressed as follows [13]
:
estimated optimum voltage with NN of the PV array. The MBE gives an indication of
the average deviation of the estimated values from the corresponding measured data.
A positive MBE value indicates the amount of overestimation in the estimated data
and vice versa. Finally, the RMSE represents a measure of the variation of estimated
values around the measured data [10] . The expressions
of MBE and RMSE are expressed as follows [13]
:
 (18)
(18)
 (19)
(19)
In our work, 800 couples of solar radiation and ambient temperature were used during the training process of the ANN; however, the test set (175 couples) is made up of data that the network has never seen. The obtained values of the statistical parameters are 0.32% (APAE), 0.085% (MBE) and 0.38% (RMSE). It can be concluded that once the ANN has been trained, it is able to estimate the maximum voltage corresponding to the MPP even for the data not used during the training process with an acceptable accuracy. Figure 8 shows the measured optimum voltage with true MPPT and the NN estimated optimum voltage for 175 solar radiation and ambient temperature records, as can be seen; there is a good fit between measured data and estimated data.
The next simulation aim is to present the electrical behavior of the photovoltaic system; this latter is composed of a PV array, a buck converter and a battery connected in parallel with a constant resistance load as defined above in Figure 1. We carried out a first series of tests in which the PV array is exposed to illumination varying from 550 to 1050 W/m2 and then to 550 W/m2. We show in Figure 9 the illumination profile considered in this test. The temperature is maintained constant at T = 25˚C.

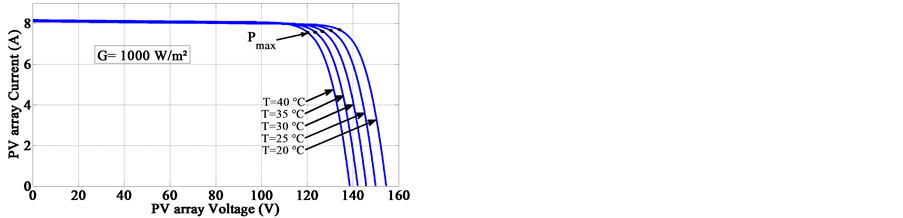
Figure 7. Simulated P-V and I-V characteristics of the PV array at constant solar radiation.
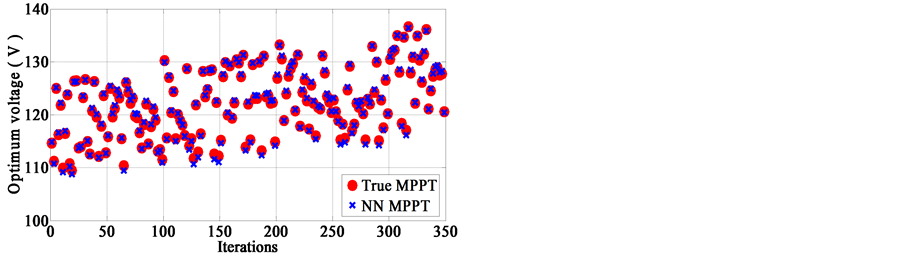
Figure 8. The neural network response and the corresponding targets for the test set.
We show in Figures 10-12 the dynamic responses of the PV system driven by the MPPT algorithm in terms of generated output power, voltage and current.
With reference to Figures 10-12, we observe that the obtained response curves show a fast response time (less than 0.1 sec.) offered by proposed MPPT control unit to irradiance changes, to track accurately and maintains the real MPP after each step of irradiation variation, thus a good stabilization is obtained. We can also conclude
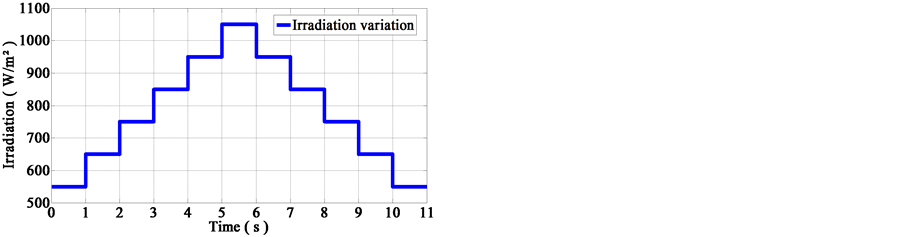
Figure 9. Irradiation profile.
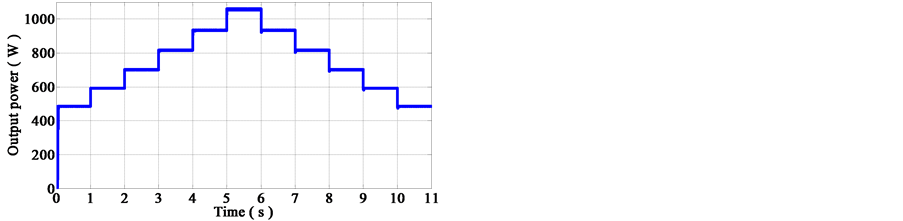
Figure 10. The output power of PV array based on MPPT control.
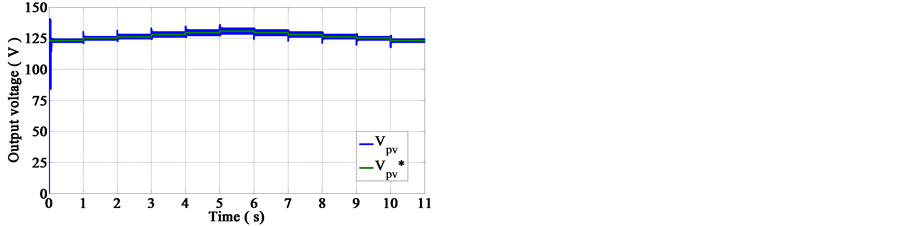
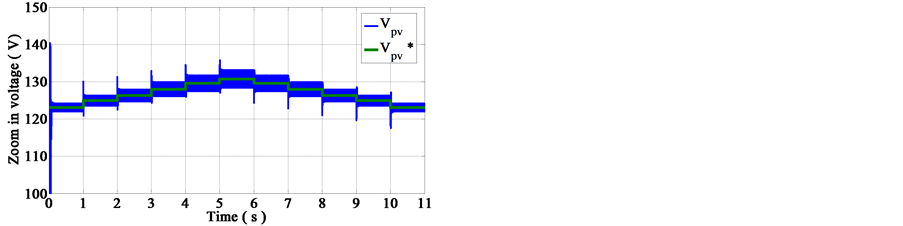
Figure 11. The output voltage of PV array based on MPPT control.
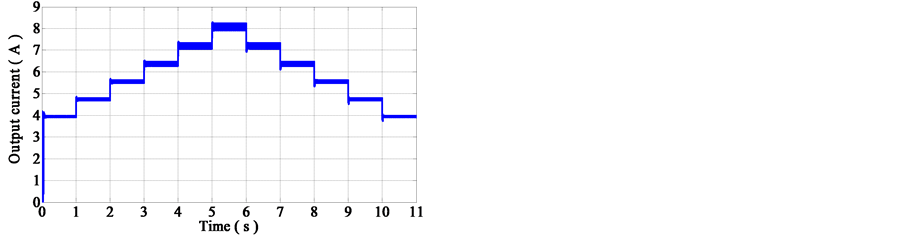
Figure 12. The output current of PV array based on MPPT control.
from Figure 11 that the relevant measured voltage signal is closely regulated; it reaches its expected reference through the action of the voltage control loop. Furthermore, the system response curves, as can be seen, exhibit minimum degree of overshoot, undershoot and steady state error.
It is also worthwhile to show the power-voltage (P-V) and the current-voltage (I-V) characteristic responses to better understand the behavior of the PV array when controlled by the proposed MPPT control technique. Figure 13 exhibits those characteristics. Under the irradiation conditions considered, six peaks have been observed at 486.3 W, 592.4 W, 702.9 W, 817.7 W, 936.9 W and 1060 W.
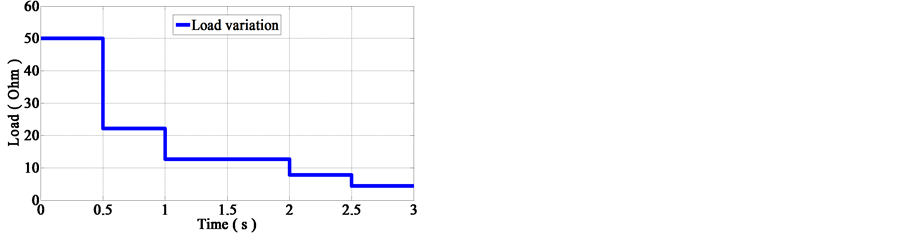
In the same way, the next test to carry out is the verification of the proposed MPPT control method when the system is associated to a dynamic load, changing with time as in real cases, e.g. when a photovoltaic system is connected to a grid, simulated in Figure 14(a). During this test, we also consider a solar irradiation that increases from 650 W/m2 to 750 W/m2 as shown in Figure 14(b), whereas, the temperature is maintained at a fixed value equal to 25˚C. We report in Figures 15-17 the response curve of the PV array to the variation of the resistive load, in practice this variation is observed, for example when a photovoltaic system injects active power to the utility network in case of grid connected photovoltaic system.
These curves, Figures 15-17, show that the MPPT control method tends directly towards the MPP, the operating point always follows the maximum power point very fast and does not depend on the load variations. It depends only of the input factors linked to illumination. We note also that the PV voltage is stable due to action of the MPPT driver.
As shown above, the maximum power point is achieved even at presence of load variation, to better understand the behavior of the PV system at MPPT; Figure 18 shows the P-V and the I-V characteristics of the PV array.
Finally, the performance of the MPPT control technique can be detected according to the efficiency. Table 3 summarizes some simulated results of the proposed system under different irradiation conditions; the temperature is still set to the value 25˚C. The tracking efficiency hPV is defined as [5] -[9] [14] :
 (20)
(20)
where
 is the averaged output power obtained under steady state operation with MPPT and
 is the maximum available power of the PV array under certain irradiation conditions
at true MPPT.
is the maximum available power of the PV array under certain irradiation conditions
at true MPPT.
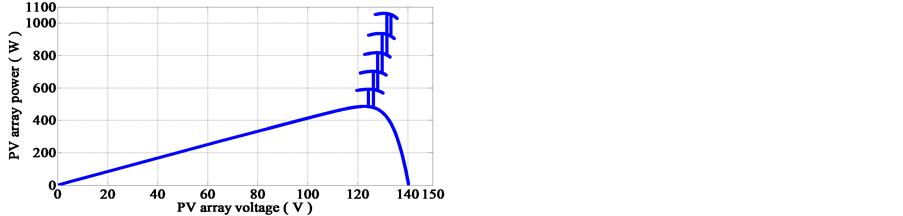
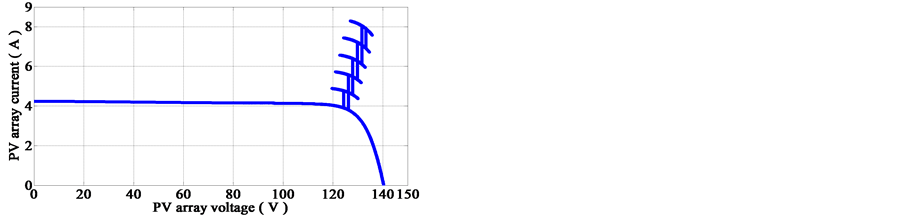
Figure 13. P-V and I-V characteristics with the proposed MPPT control method under irradiation changes.
 (a)
(a)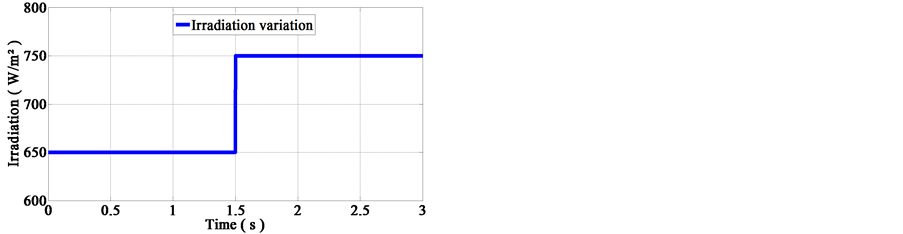 (b)
(b)
Figure 14. (a) Simulation of the resistive load variation according to time; (b) Irradiation profile.
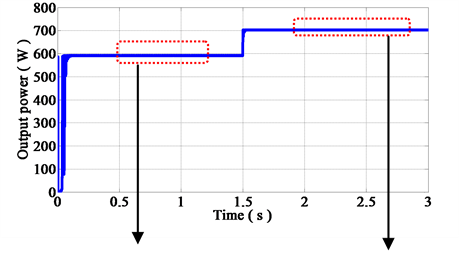
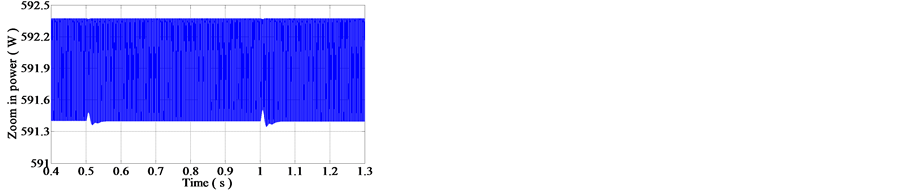
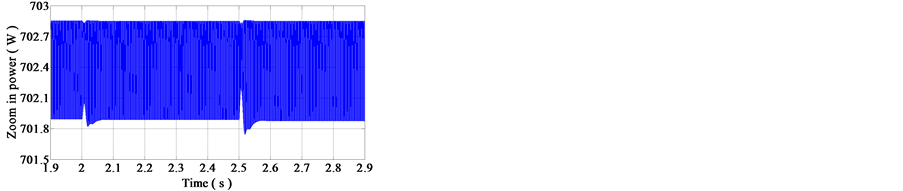
Figure 15. Influence of the load behavior on power.
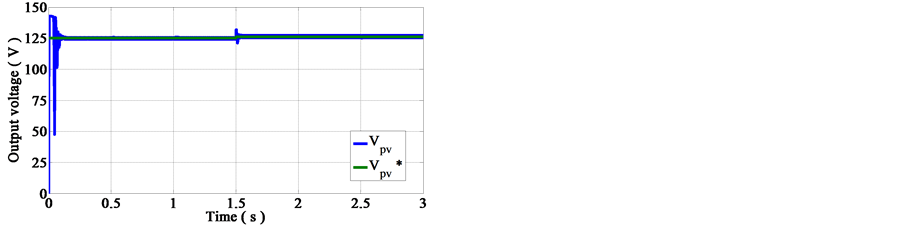
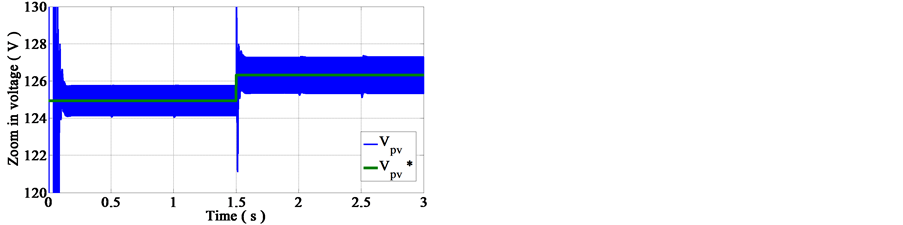
Figure 16. Influence of the load behavior on voltage.
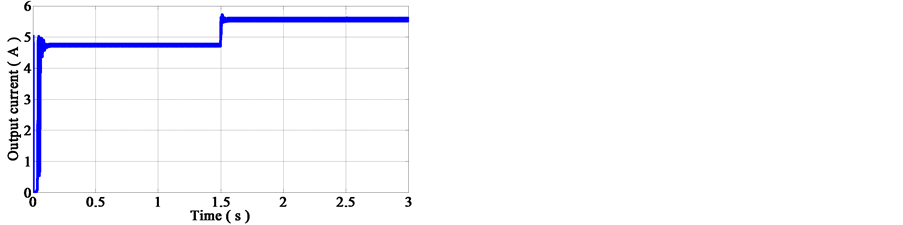
Figure 17. Influence of the load behavior on current.
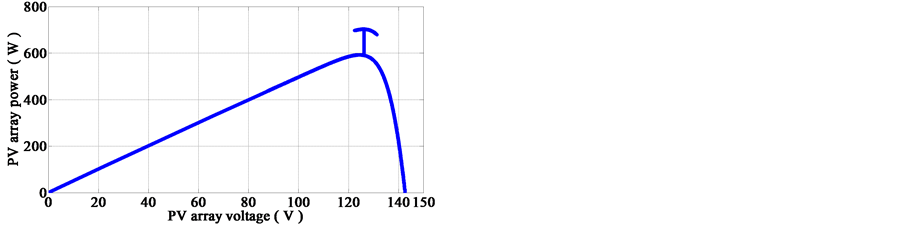
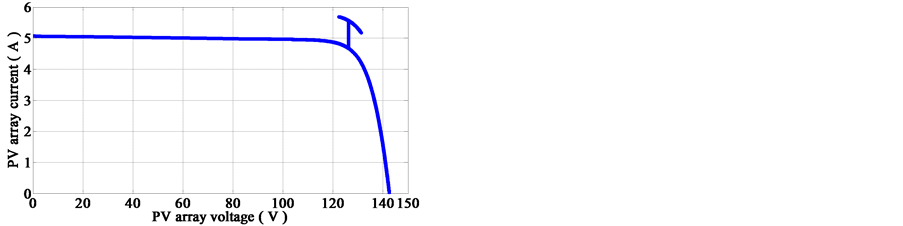
Figure 18. P-V and I-V characteristics with the proposed MPPT control method under load and irradiation variations.
Table 3. Tracking efficiency of the proposed system.
From Table 3, we can deduce that the overall tracking efficiency of the proposed MPPT system is greater than 99.63% for both high and low irradiation conditions, hence the effectiveness of the proposed MPPT control method is highly ensured as required.
6. Conclusions and Perspective
In this paper, an intelligent method to track the maximum power point under rapid changes of climatic conditions was developed and tested. A Matlab/Simulink based simulation of a stand-alone photovoltaic system with a dc load stage was carried out to validate the proposed MPPT method. The results demonstrate that the proposed MPPT method track very fast the MPP with negligible oscillations. It has been also observed that the performance of the proposed method is not influenced by the load variations. A slight variation is observed when the load varies, but after a very small amount of time the system moves smoothly to the MPP. The main advantages of the developed MPPT control method are fast convergence to the MPP, high efficiency, robustness and its possibility to implement easily. Further work is being conducted on the overall system design and experimental implementation.
References
- Yang, D. and Dylan Dah-Chuan, L. (2011) Battery-Integrated Boost Converter Utilizing Distributed MPPT Configuration for Photovoltaic Systems. Solar Energy, 85, 1992-2002. http://dx.doi.org/10.1016/j.solener.2011.05.008
- Heydari-Doostabad, H., Keypour, R., Khalghani, M.R. and Khooban, M.H. (2013) A New Approach in MPPT for Photovoltaic Array Based on Extremum Seeking Control under Uniform and Non-Uniform Irradiances. Solar Energy, 94, 28-36. http://dx.doi.org/10.1016/j.solener.2013.04.025
- Chaouachi, A., Kamel, R.M. and Nagasaka, K. (2010) A Novel Multi-Model Neuro-Fuzzy-Based MPPT for Three-Phase Grid-Connected Photovoltaic System. Solar Energy, 84, 2219-2229.http://dx.doi.org/10.1016/j.solener.2010.08.004
- Mahjoub-Essefi, R., Souissi, M. and Hadj-Abdallah, H. (2014) Maximum Power Point Tracking Control Technique for Photovoltaic Systems Using Neural Networks. Proceedings of the 5th Annual International Renewable Energy Congress IREC’2014, Hammamet, 25-27 March 2014, 422-427.
- Ben-Saleh, C. and Ouali, M. (2011) Comparison of Fuzzy Logic and Neural Network in Maximum Power Point Tracker for PV Systems. Electric Power Systems Research, 81, 43-50. http://dx.doi.org/10.1016/j.epsr.2010.07.005
- Morales, D.S. (2010) Maximum Power Point Tracking Algorithms for Photovoltaic Applications. Master’s Thesis, Aalto University, Espoo and Helsinki.
- Liu, Y., Liu, C., Huang, J. and Chen, J. (2013) Neural-Network-Based Maximum Power Point Tracking Methods for Photovoltaic Systems Operating under Fast Changing Environments. Solar Energy, 89, 42-53.http://dx.doi.org/10.1016/j.solener.2012.11.017
- Gao, X.W., Li, S.W. and Gong, R.F. (2013) Maximum Power Point Tracking Control Strategies with Variable Weather Parameters for Photovoltaic Generation Systems. Solar Energy, 93, 357-367.http://dx.doi.org/10.1016/j.solener.2013.04.023
- Bouilouta, A., Mellit, A. and Kalogirou, S.A. (2013) New MPPT Method for Stand-Alone Photovoltaic Systems Operating under Partially Shaded Conditions. Energy, 55, 1972-1185. http://dx.doi.org/10.1016/j.energy.2013.03.038
- Almonacid, F., Fernandez, E.F., Rodrigo, P., Pérez-Higueras, P.J. and Rus-Cascas, C. (2013) Estimating the Maximum Power of a High Concentrator Photovoltaic (HCPV) Module Using an Artificial Neural Network. Energy, 53, 165-172.http://dx.doi.org/10.1016/j.energy.2013.02.024
- Hudson Beale, M., T. Hagan, M. and B. Demuth, H. (2013) Neural Network ToolboxTM: User’s Guide. Matlab-MathWorks.
- Chiung-Chou, L. (2010) Genetik k-Means Algorithm Based Network for Photovoltaic MPP Prediction. Energy, 35, 529-536.http://dx.doi.org/10.1016/j.energy.2009.10.021
- Cimbala, J.M. (2011) Basic Statistics Course. https://www.mne.psu.edu/me345/Lectures/Basic_Statistics.pdf
- Liu, Y. and Huang, J. (2011) A Fast and Low Cost Analog Maximum Power Point Tracking Method for Low Power Photovoltaic Systems. Solar Energy, 85, 2771-2780. http://dx.doi.org/10.1016/j.solener.2011.08.019