Open Journal of Fluid Dynamics
Vol.2 No.3(2012), Article ID:22535,11 pages DOI:10.4236/ojfd.2012.23005
Computational Analysis of Mixing Guide Vane Effects on Performance of the Supersonic Ejector-Diffuser System
1School of Mechanical Engineering, Andong National University, Andong, Korea
2College of Mechanical Engineering & Automation, Zhejiang Sci-Tech University, Hangzhou, China
3Department of Mechanical Engineering, Saga University, Saga, Japan
Email: *kimhd@andong.ac.kr
Received June 5, 2012; revised July 8, 2012; accepted August 2, 2012
Keywords: Ejector-Diffuser System; Mixing Guide Vane; Shock Wave; Compressible Flow; Supersonic Flow
ABSTRACT
The flow field in the ejector-diffuser system and its optimal operation condition are hardly complicated due to the complicated turbulent mixing, compressibility effects and even flow unsteadiness which are generated inside the ejectordiffuser system. This paper aims at the improvement in ejector-diffuser system by focusing attention on entrainment ratio and pressure recovery. Several mixing guide vanes were installed at the inlet of the secondary stream for the purpose of the performance improvement of the ejector system. A Computational Fluid Dynamics (CFD) method based on Fluent has been applied to simulate the supersonic flows and shock waves inside the ejector. A finite volume scheme and density-based solver with coupled scheme were applied in the computational process. Standard k-ω turbulent model, implicit formulations were used considering the accuracy and stability. Previous experimental results showed that more flow vortexes were generated and more vertical flow was introduced into the stream under a mixing guide vane influence. Besides these effects on the secondary stream, the mixing guide vane effects on the shock system of the primary stream were also investigated in this paper. Optimal analysis results of the mixing guide vane effects were also carried out in detail in terms of the positions, lengths and numbers to achieve the best operation condition. The comparison of ejector performance with and without the mixing guide vane was obtained. The ejector-diffuser system performance is discussed in terms of the entrainment ratio, pressure recovery as well as total pressure loss.
1. Introduction
Supersonic ejector-diffuser system makes use of high pressure primary stream to propel the secondary stream through pure shear action for the purposes of transport or compression of fluid. Since the first ejector was invented at 1900s, the supersonic ejector-diffuser system was rapidly developed and widely used in many industrial applications. It has many advantages compared with other mechanical devices, such as no moving parts, structural simplicity, and even increasing pressure without mechanical energy [1]. Indeed, it can be used in many complex progresses as a compressor, a fluid transport component or a vacuum pump [2-4]. Along the development of solar industry, the ejector application in solar refrigeration and solar desalination was growing rapidly. At the same time, the ejector-diffuser system was increasingly considered as the most important equipment in these energy industries [1,5-7].
At the inlet of the supersonic ejector-diffuser system, the primary stream with high pressure and high speed flowed out from the supersonic nozzle exit. Secondary stream was entrained by the primary stream and mixed up in the mixing chamber. At the end of the mixing chamber, two streams were completely mixed and the pressure was assumed to be constant until they reached the diffuser section [8,9]. The mixing stream pressure was elevated again and exhausted with a higher pressure than the previous secondary stream. Two important coefficients were used to describe the performance: mass flow ratio of two streams and the pressure recovery between inlet and outlet [9]. Low efficiency and complex turbulent flow are like big obstacles restrict the studies on the ejector. Many researching works have been done to increase the performance of the ejector, but results were still unsatisfactory, compared with other industrial machineries [4,6]. Considering the complexity and difficulty on the researching, how to enhance the performance of ejector effectively became a significant task.
In the past decades, many researchers have done many significant works based on ejector geometry, nozzle design, and fluid selection. Huang et al. [10] carried out a 1-Dimensional axis analysis for the performance of the ejector and the working fluid is an ideal gas. Similar method was used by Rogdakis et al. [11], who studied the possibility for mixing and supersonic compression in the mixing chamber. Aphornratana and Eames [12] performed an experiment to study refrigerator using a small scale steam ejector with a supersonic nozzle. Similar experiment has also been performed by [1,9,13] based on nozzle design. Ouzzane and Aidoun [14] invented a new mathematical model of the ejector; detailed structure was analyzed using 1-Dimensional compressible flow. At the same time, a series of experimental works have been carried out to study the effect of ejector performance, especially in the effect of working fluids [15]. In the present works, the modeling technique based on numerical software has been used to investigate the flow factors inside the ejector. Bartosiewicz et al. [16] compared static pressure distribution between experimental results and numerical simulation in different turbulence models. Many recent studies [16, 17] showed that computational results were expected to provide a reasonable cost and a visual display of local flow filed.
Researchers got a lot of good results based on geometrical optimization, but the study of internal structure has got little attention [18,19]. In the Texas A & M University, a researching team put forward a good optimal method with a mixing guide vane installed at the inlet of ejector [20]. A productive experimental work of this ejector has been made by Manohar [21], and Somsak W. [22,23] has finished the basic computational analysis in his doctoral dissertation. The geometrical model they were used was widely applied in the solar desalination industrial. The schematic of supersonic ejector-diffuser system in a solar desalination circulation was illustrated in the Figure 1. In the solar desalination process, the ejector-diffuser system can be used in reducing the pressure of evaporator and propelling incondensable gas into the condenser. From their experimental and numerical results, the mass flow rate of secondary stream was decreased under the negative influence of guide vanes. That’s why optimal works of mixing guide vane were urgently needed in the following researching.
In the present work, a numerical method based on Fluent has been applied to simulate supersonic flows and shock waves of the ejector internal flow. The geometry model of supersonic ejector-diffuser system was used in the Manohar and Somsak’s work [21-23]. Exactly same geometrical model was created to validate the results of experimental data. Several new mixing guide vanes were designed and installed at the inlet of the secondary stream for the purpose of the performance improvement
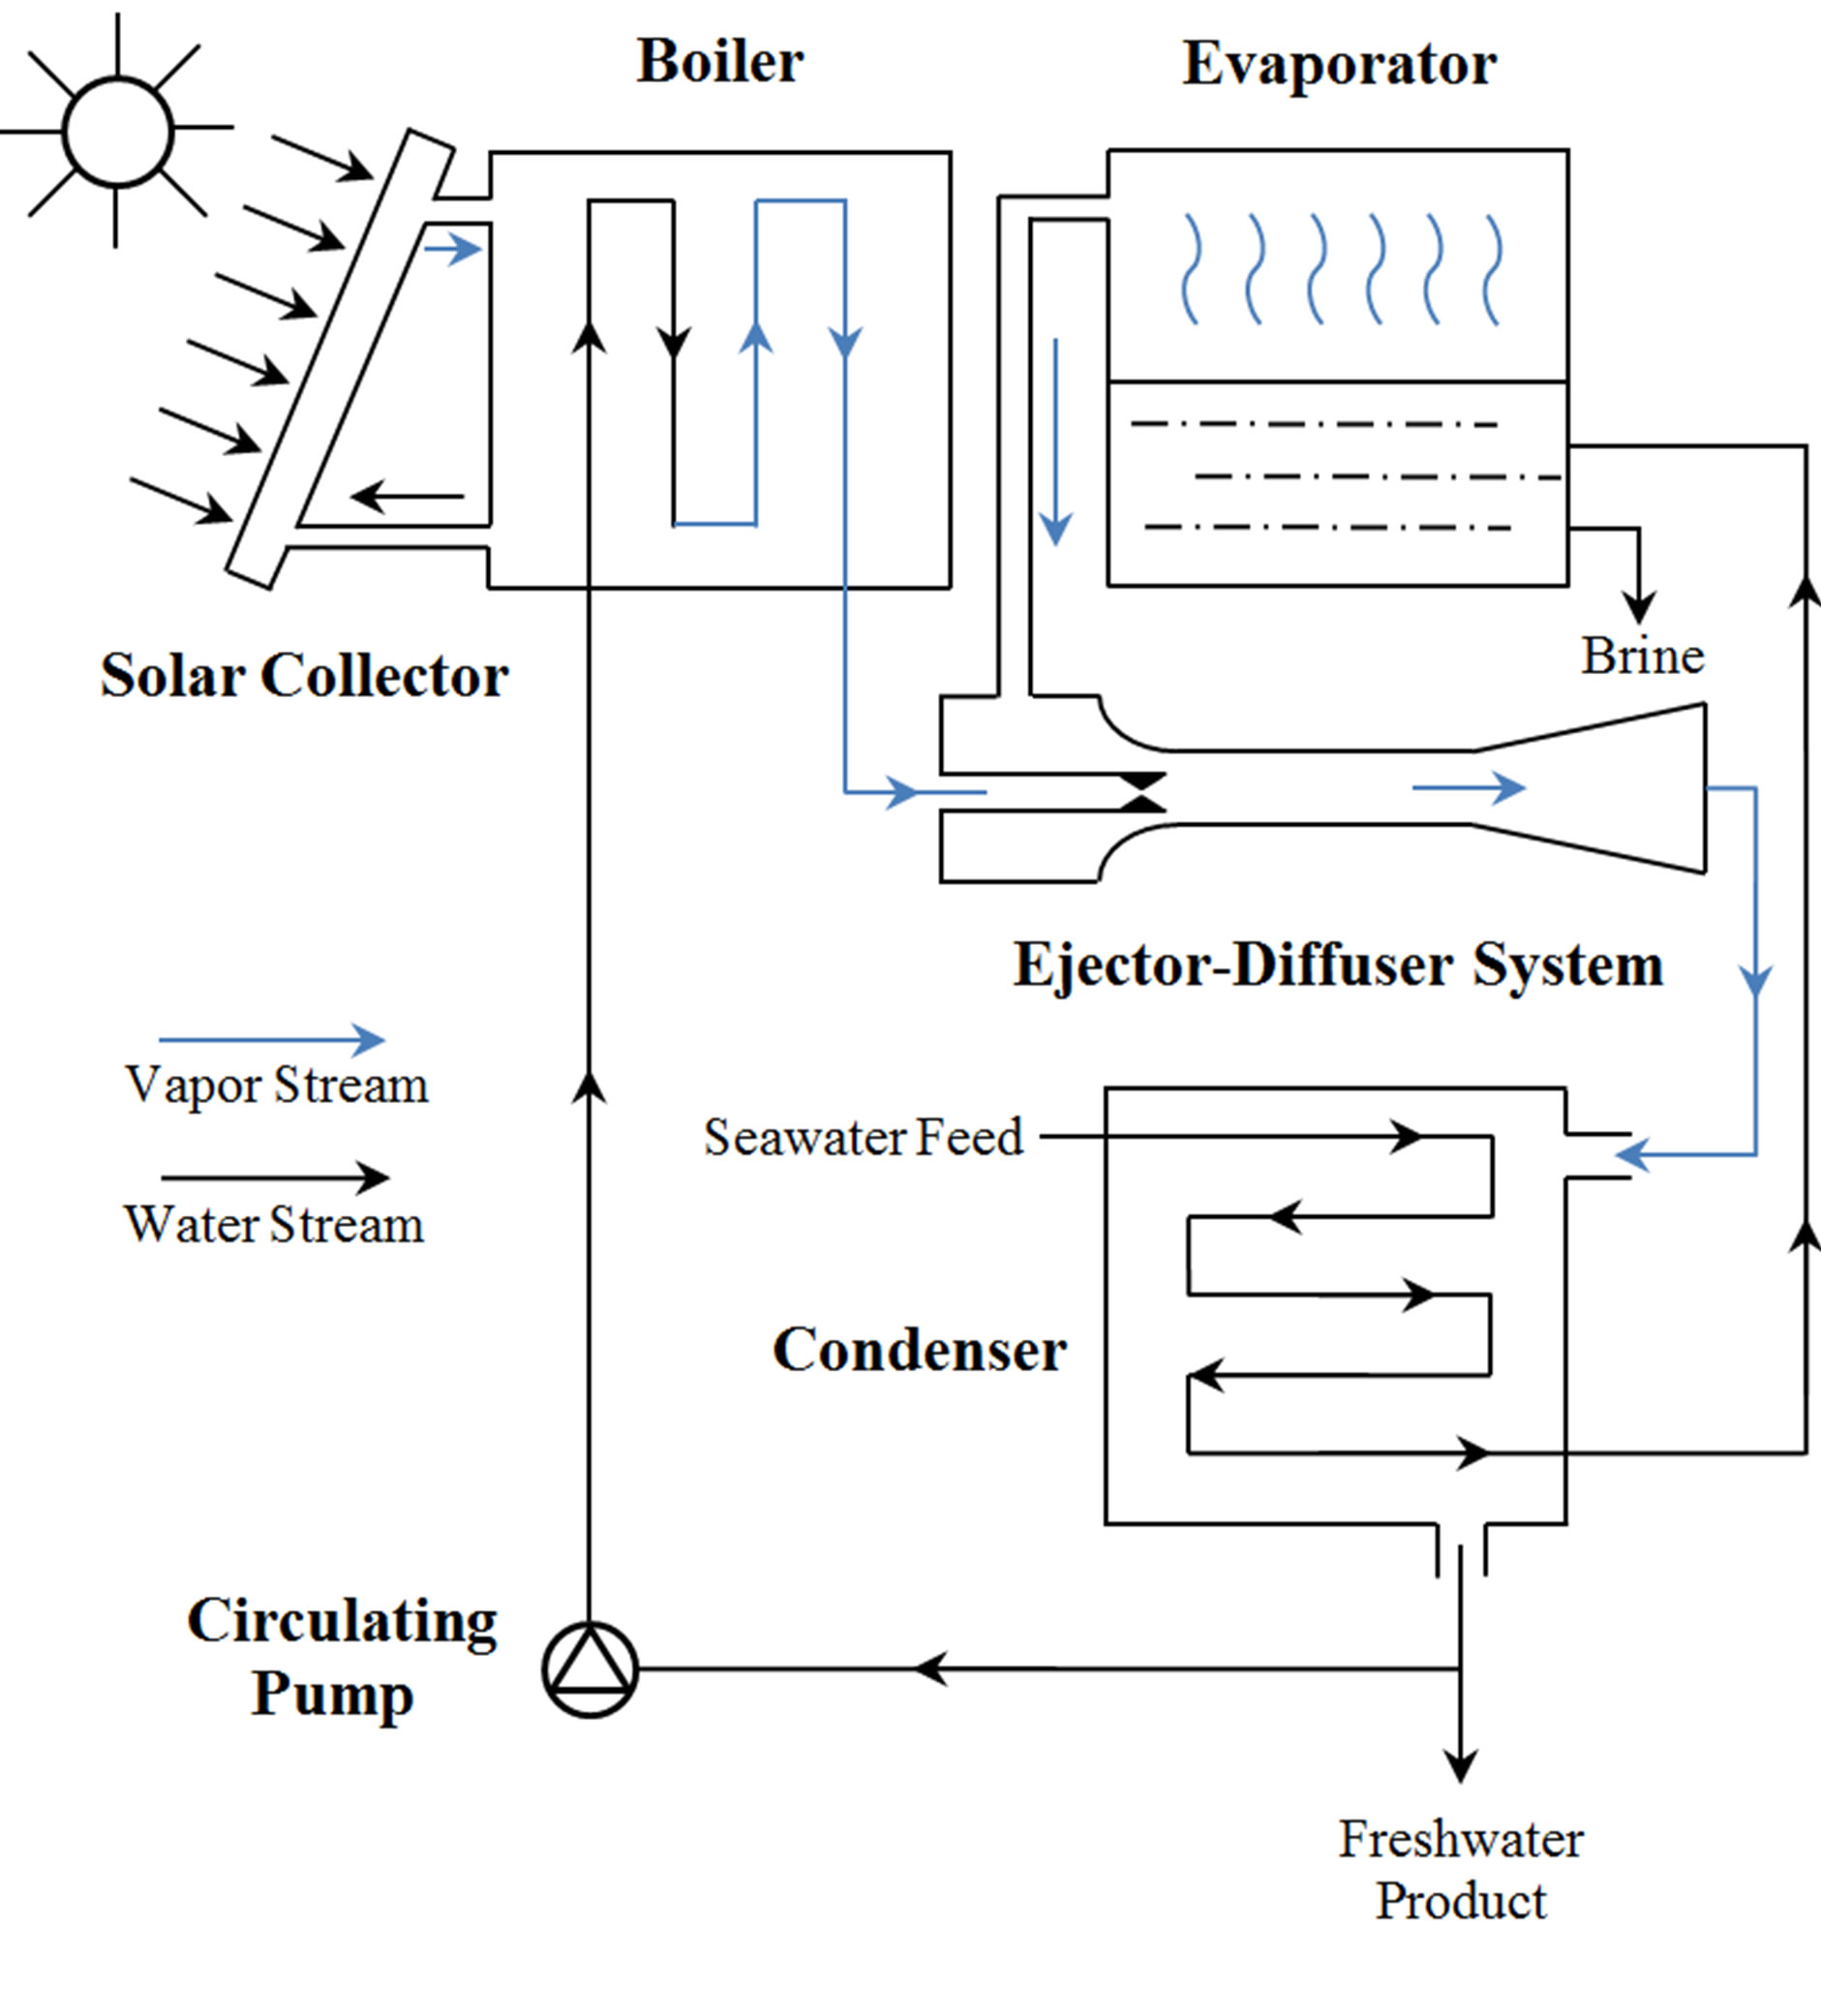
Figure 1. The supersonic ejector-diffuser system in a solar desalination circulation (Ref. [21]).
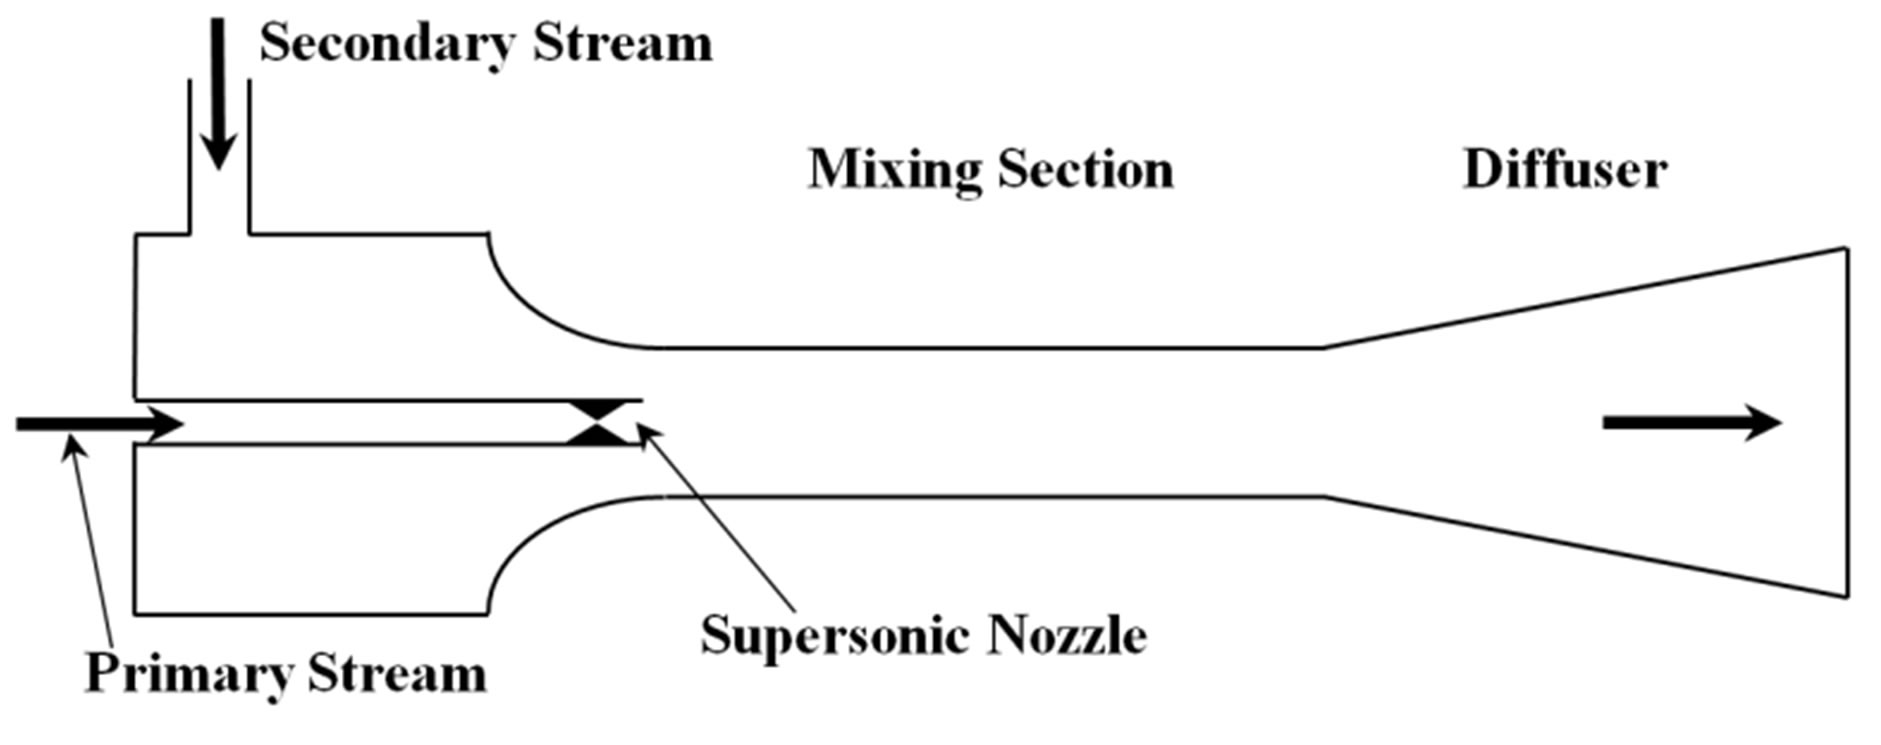
of the ejector system, especially entrainment ratio. Experimental appliance model was illustrated schematically in the Figure 2. A typical ejector system (Figure 2(a)) and the position of mixing guide vane (Figure 2(b)) were illustrated.
Optimal analyses were put into use to improve the performance of the supersonic ejector-diffuser system: the optimized position and length of the mixing guide vane are discussed to increase the performance of the ejector; the operation characteristics of the ejector system with different numbers of inlet guide vanes are analyzed in detail. Then, the mixing guide vane effects on performance of the ejector were investigated in detail based on the optimal geometry. In these all cases, the ejector-diffuser system performance is discussed in terms of the entrainment ratio, pressure recovery as well as total pressure loss.
2. Numerical Analysis
2.1. Computational Flow Model
As a mixing chamber, two different types were widely used in the solar desalination process: constant mixing chamber area and constant pressure mixing. In this paper, the ejector with a constant mixing area chamber was used, which can be deemed to achieve a higher entrainment ratio. The ejector-diffuser system was shown schematically in the Figure 3. A two-dimensional axis-symmetric model was applied in the present works. The diameters of supersonic nozzle (D1), secondary stream inlet (D2)
 (a)
(a)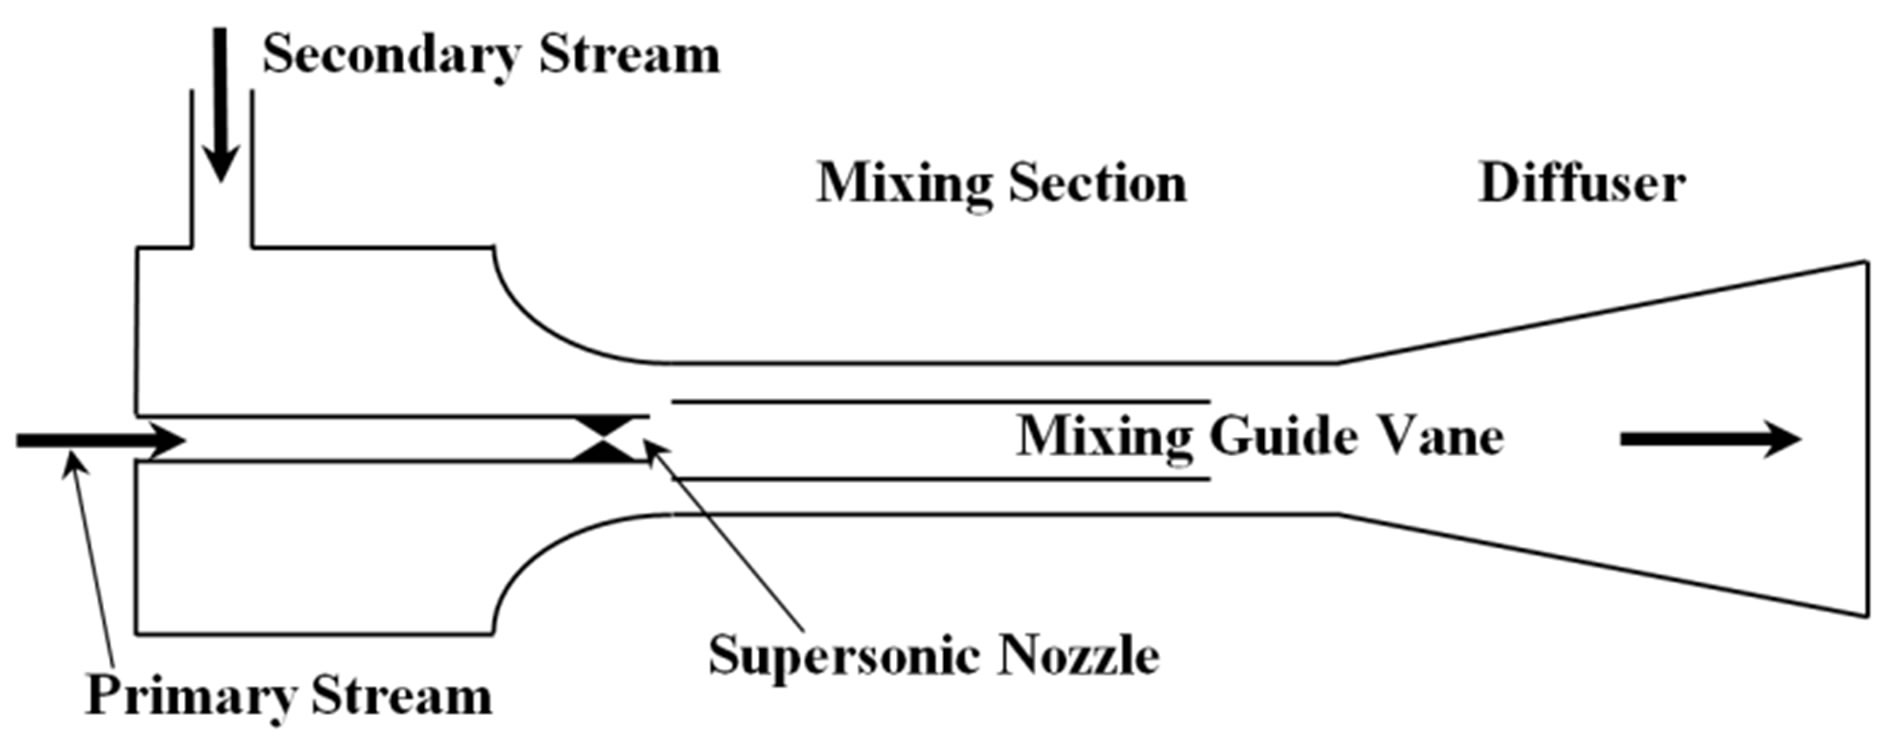 (b)
(b)
Figure 2. Geometrical schematic of supersonic ejector-diffuser system. (a) Without mixing guide vane; (b) With mixing guide vane.
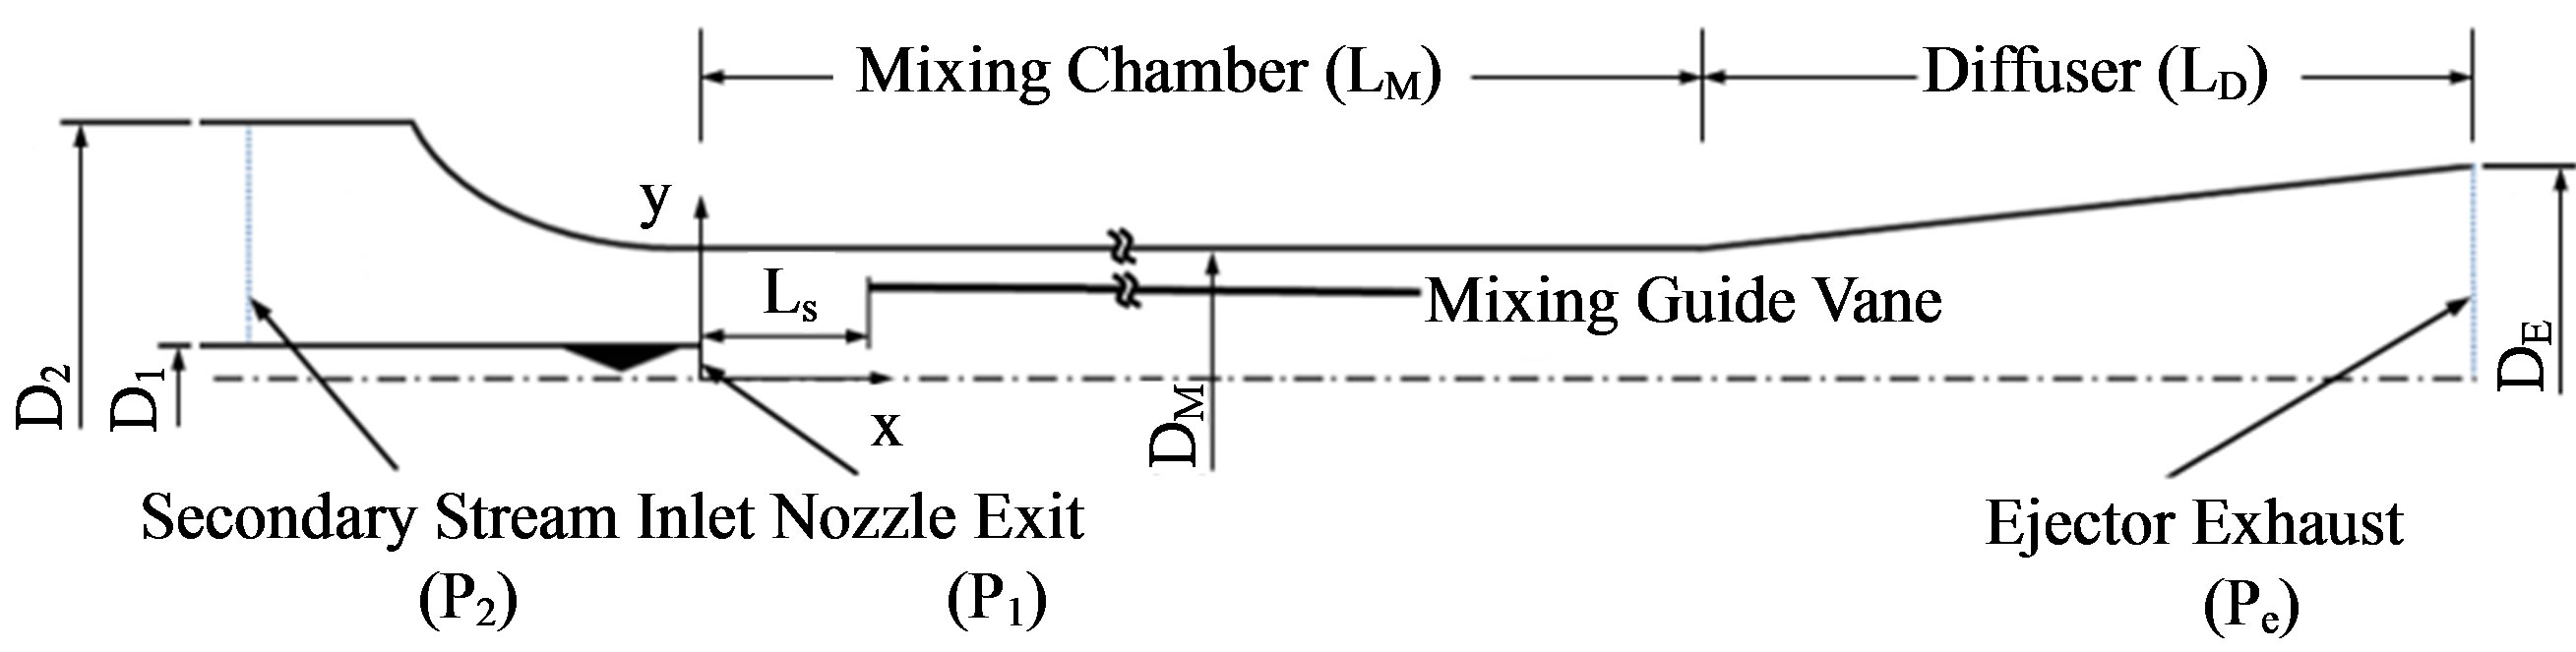
Figure 3. Schematics of the supersonic ejector with mixing guide vane.
and mixing section (DM) were kept constant as shown in Table 1. At the same time, length of mixing chamber (LM) and diffuser (LD) were also fixed.
Figure 4 represents the geometrical model of mixing guide vane. Initially, the mixing guide vane was built as a circular truncated cone, while diameters of front end and after end of the mixing guide vane were not equal (DV1 > DV2). As the innovation of the optimal works, the mixing guide vane effects on performance of the ejector were discussed in terms of positions (Ls), lengths (LV) and numbers, as shown in Table 2. While LV represents the length of mixing guide vane, and Ls is the distance between mixing guide vane and supersonic nozzle exit. According to these adjustable parameters in different models, the effects of positions (from model ABCDE), lengths (from model CHI) and numbers (from model ACFG) will be discussed.
2.2. Numerical Method
For the CFD software, ANSYS Fluent 13.0 was chosen to simulate internal flows of ejector. Ideal gas was used as the working fluid in all cases. A finite volume scheme and density-based solver with coupled scheme were applied in the computational process. Standard k-ω turbulent model, implicit formulations were used considering the accuracy and stability.
Second-order upwind scheme was used for turbulent kinetic energy as well as spatial discretizations. Generally speaking, the working fluid used in the solar desalination process was vapor only, but ideal gas was used in the present computational works. Because they can get a similar result after simulation progress, and less computational time is needed with ideal gas fluid.
Commercial software Gambit was used in the present research to create mesh domain. A structure mesh was employed in this case and quadrilateral cells were used in the mesh creation. Boundary layer effects were considered by making finer grid densely clustered close to the walls. The solutions of grid-independent were shown in the Table 1. All these cases were simulated based on the model a, without mixing guide vane installed. The percentage deviation was the difference of total mass flow rates between the CFD analysis and experimental results. The first (coarse) grid with y+ of about 4.6 has 156,527 cells. The second (medium) grid set has 232,325 cells with a y+ of about 2.7. The third (fine) set grid is generated using the same minimum space as the second set has 345,235 cells. From Table 3 of Grid-independence check list, the difference between CFD analysis and experimental results was less than 4%. Hence, the grid independence was also checked. The computational domain with 232,325 cells was chosen because of its less computational time and more accurate result.
Boundary conditions and operating pressures of inlet and exit were illustrated in the Figure 5. A two-dimensional axis-symmetric model was applied in the present

Figure 4. Geometry model of the mixing guide vane.
Table 1. Geometrical parameters used in simulations.
Table 2. Adjustable parameters in different models.

Table 3. Grid-independence investigation.
Figure 5. Boundary conditions applied in the present study.
numerical simulation works. Pressure inlet boundary condition was set at nozzle exit of the ejector. Values of computational boundary condition of primary inlet were given in the Table 4. Totally 5 different cases were involved in the numerical simulation. All models in Table 2 were calculated based on these conditions only. The secondary inlet and outlet of ejector were extended to stabilize the computational results. Pressure outlet boundary conditions with 1 bar were used at both secondary inlet and outlet of the ejector. Therefore, the secondary stream inlet and ejector exit were taken from ambient conditions of an atmospheric pressure.
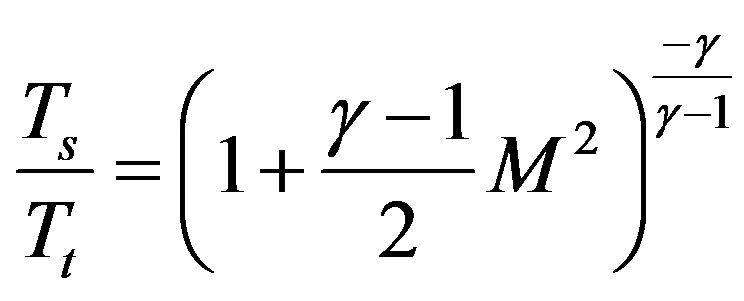
The total pressure at nozzle exit (Pt) and static pressure (Ps) can be calculated isentropically to give the Mach number. As shown in the Table 4, related initial values can be calculated in these equations:
 (1)
(1)
 (2)
(2)
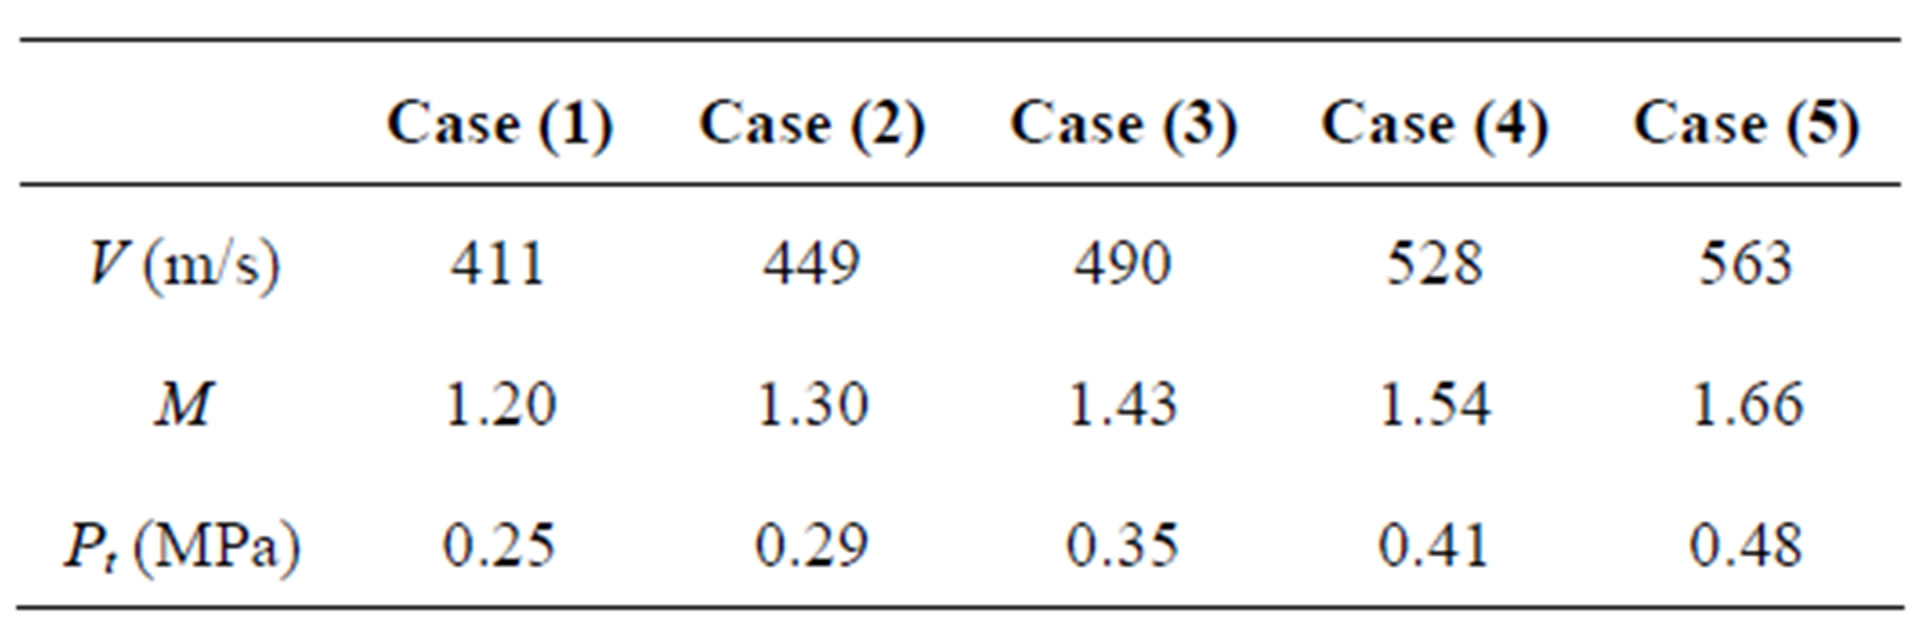
Table 4. Computational boundary conditions.
 (3)
(3)
Mass flow rate  is so important to compare with the experimental data. As one of the indispensable values to describe the ejector-diffuser system performance, the entrainment ratio (Rm) is also obtained from mass flow rate. entrainment ratio is a ratio between the mass flow rate of secondary flow
  and primary flow
 . The calculation method of these values can be represented by the following equations:
 (4)
(4)
 (5)
(5)
Pressure recovery (ΔP) can be defined as the difference between static pressure at the secondary stream inlet (Ps2) and static pressure at the outlet of ejector-diffuser system (Pse). Sometimes, the pressure recovery ratio  will be used as a non-dimensional value to describe it.
 (6)
(6)
 (7)
(7)
Total pressure loss ratio (η) can be considered as the difference between total pressure at the nozzle exit (Pt1) and total pressure at the outlet of ejector-diffuser system (Pte). The calculation of the total pressure loss ratio (η) can be represented by the following equation:
 (8)
(8)
2.3. Validation
The comparisons between computational and experimental results of entrainment ratio & pressure recovery were shown in the Figure 6. Good agreements were found between CFD and experimental data. The deviations in entrainment ratio were less than 4.6%. The same values of pressure recovery were less than 8.2%. Along the Mach number increasing, Pressure recovery was elevated smoothly. A trend of rising can be found even at the point of maximum Mach number. However, entrainment ratios were decreased along the pressure recovery
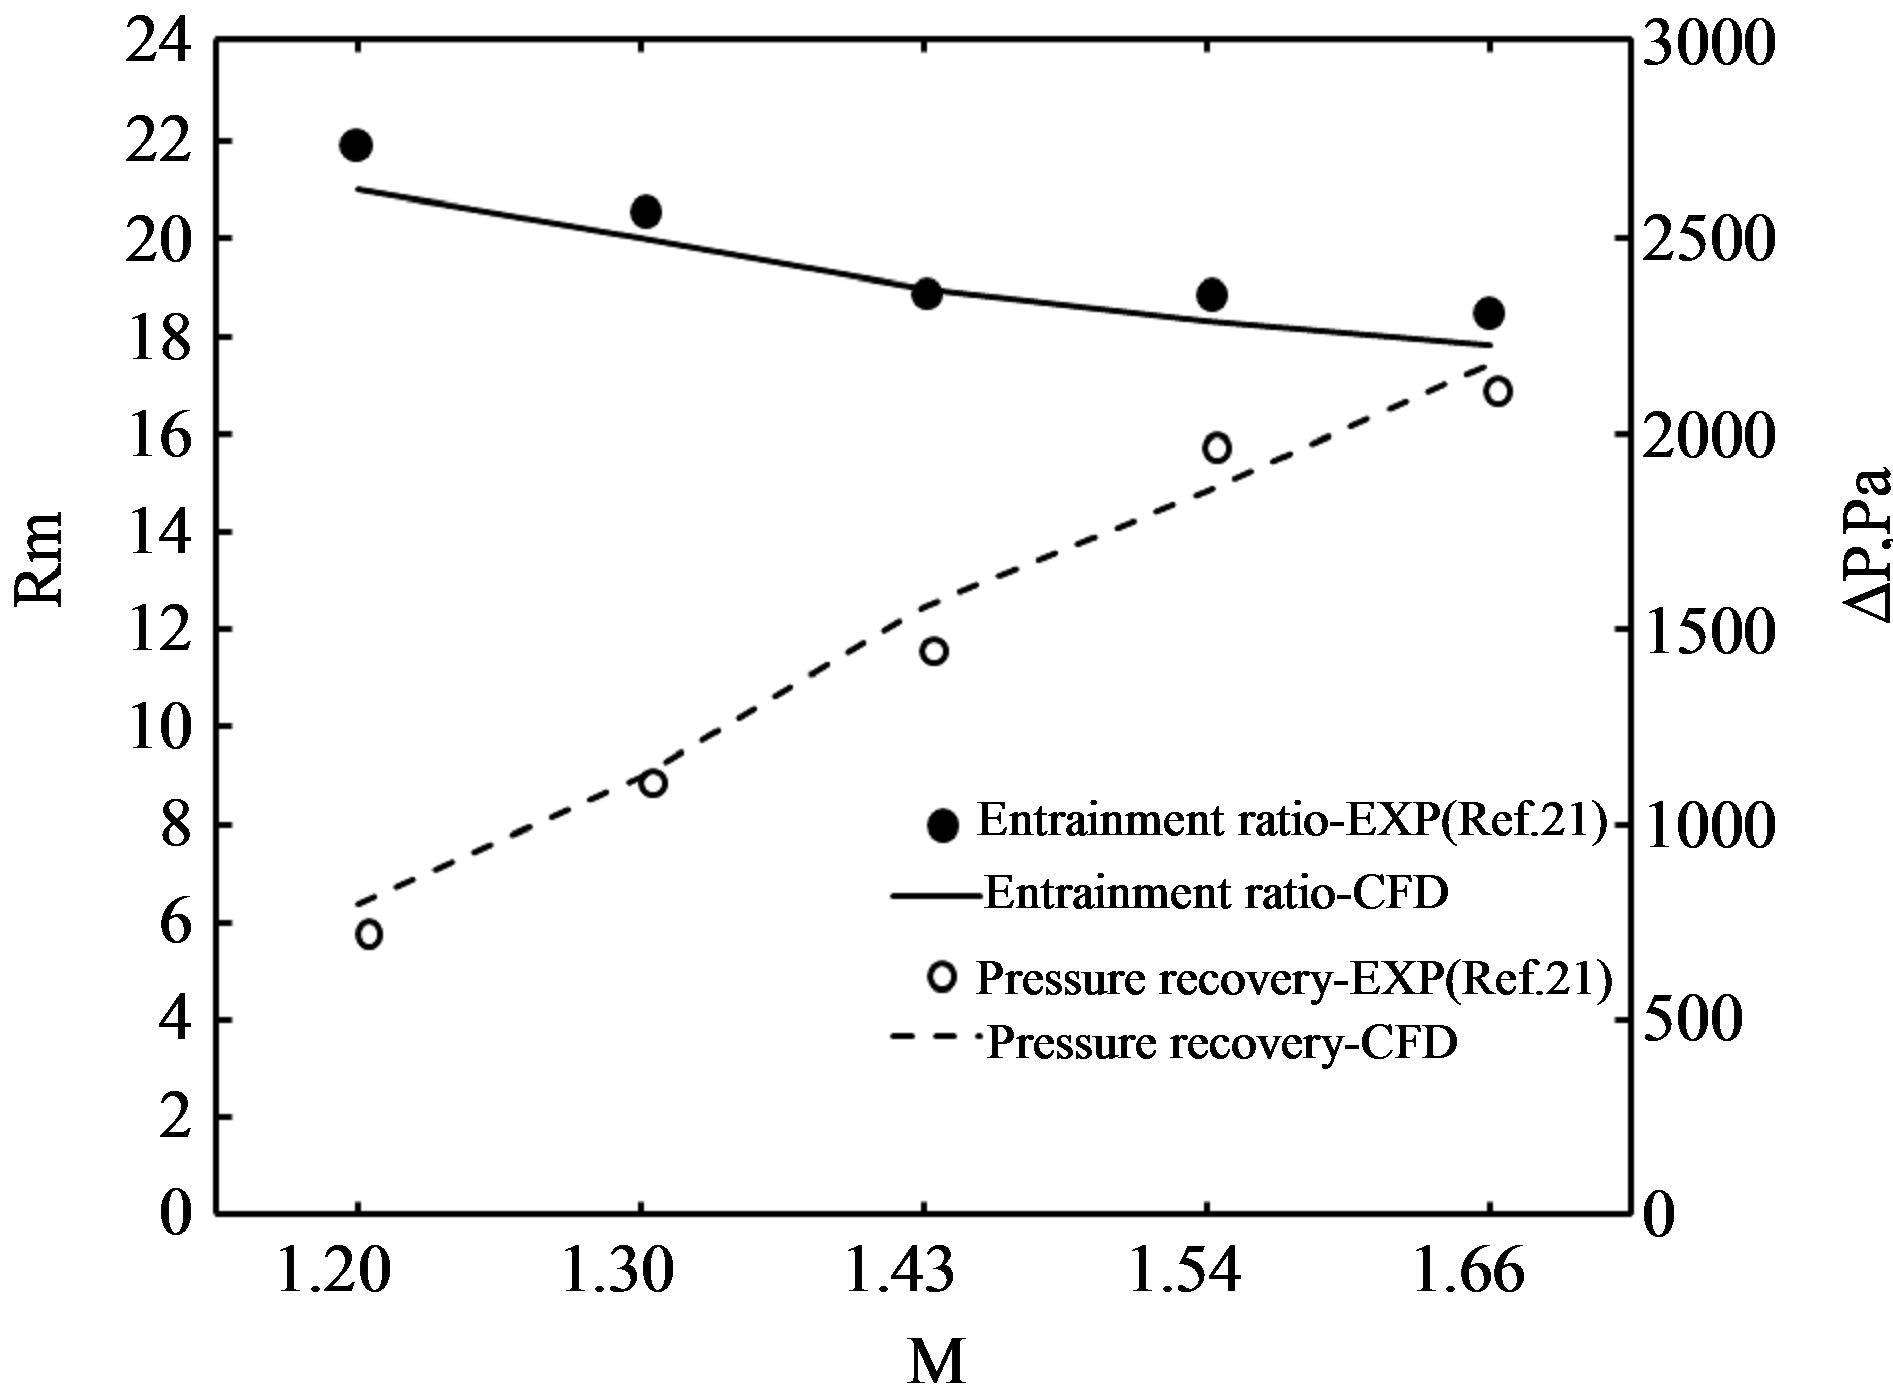
Figure 6. Comparisons between CFD and experimental results of entrainment ratio & pressure recovery (Model A).
increasing from the figure. Since accurate prediction of numerical solution was obtained obviously, the data of CFD results of Model A was used to compare with other models. The ejector geometrical model without mixing guide vane was validated to the experimental results. Several new mixing guide vanes would be designed and installed at the inlet of the ejector. Optimal works have been done based on new mixing guide vane. The CFD and Experimental data of the model without guide vane used in following contents can be obtained from Figure 6.
3. Results and Discussion
As mentioned in the section 2.3, the ejector geometrical model without mixing guide vane (Model A) was validated to the experimental results Figure 6. In the results and discussion, Mixing guide vanes were designed newly to achieve a better performance of the ejector. The effects of the mixing guide vane were divided into 3 parts, such as the effects of positions (from model ABCDE), lengths (from model CHI) and guide vane numbers (from model ACFG). The performance of the ejector-diffuser was discussed in terms of entrainment ratio, pressure recovery and total pressure loss ratio. Then, detail discussion and analysis of mixing guide vane effects were investigated based on the flow physics.
3.1. Effects of Positions of Mixing Guide Vane
In the present study of effects of positions, the entrainment ratio for 4 different positions of mixing guide vane is shown in Figure 7 where the Mach number ranges from 1.20 to 1.66. Firstly, the model B with Ls = 0DM has a negative influence on the entrainment ratio, in a percentage decrease of 3.3%. Model D and model E with Ls = 2DM and 3DM have very little influence on the entrainment ratio. Both models are similar with the model
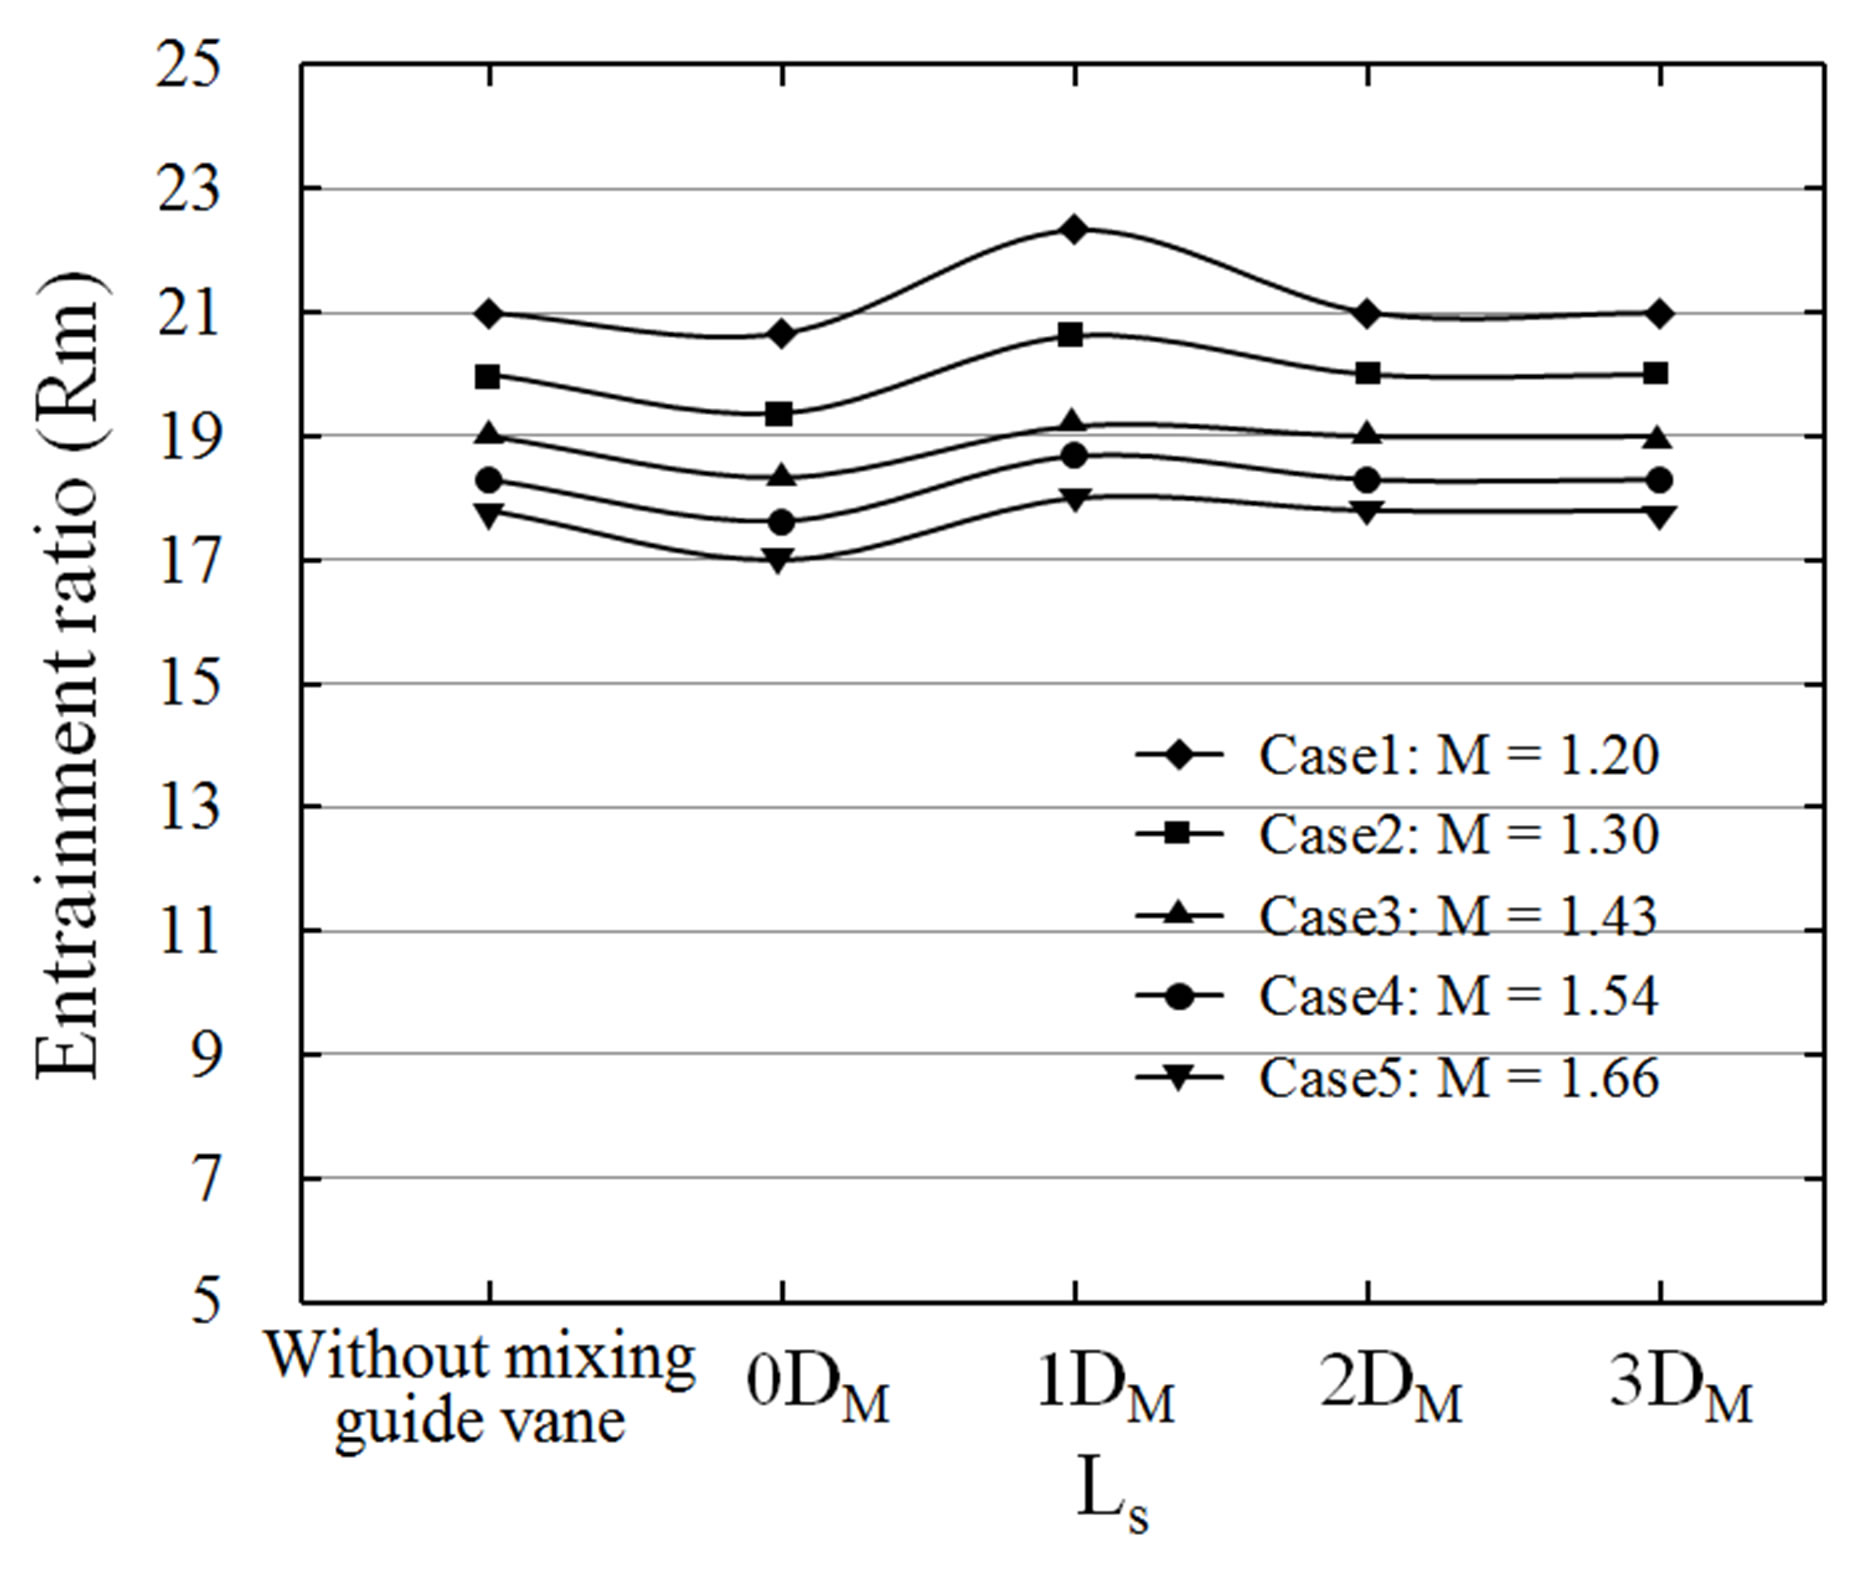
Figure 7. Entrainment ratio vs. position of mixing guide vane.
without mixing guide vane. Meanwhile, the model C with Ls = 1DM shows better result of entrainment ratio than the model without mixing guide vane. Indeed, the percentage increase of average entrainment ratio is about 2.7%, and the maximum amplitude of increase achieved is 6.3% in case 1. The increase amplitude in entrainment ratio becomes larger when the primary stream Mach numbers decrease.
The pressure recovery of the ejector-diffuser system for different cases is showed in Figure 8. With the inlet stream Mach number increasing, the pressures recovery gradually becomes larger in all 5 models. The mixing guide vane effects show better results of pressure recovery in almost all cases except some points such as Ls = 2DM and 3DM. Model C shows best pressure recovery than other models. When the Ls equal 1DM, The difference of pressure recovery compared with the model without mixing guide vane is about 21.6%, and the maximum value of increase achieved is 27.0% when M = 1.66. The increase in amplitude of pressure recovery becomes larger when the primary stream Mach number increased. Results of all the models announce that mixing guide vane has a positive influence on pressure recovery. The average value of increase achieves 6.7%.
Figure 9 shows the comparison of total pressure loss between with and without mixing guide vane for different Mach numbers of primary stream. When the Mach number of primary stream increases from 1.20 to 1.66, the increase in amplitude of total pressure loss becomes larger. The ejector-diffuser system without mixing guide vane (model A) shows better results in the total pressure loss ratio for all 5 cases. Total pressure loss is decreased along the Ls increasing, but still larger than the model without mixing guide vane. Compared all the models in the previous researching, the model C with Ls = 1DM
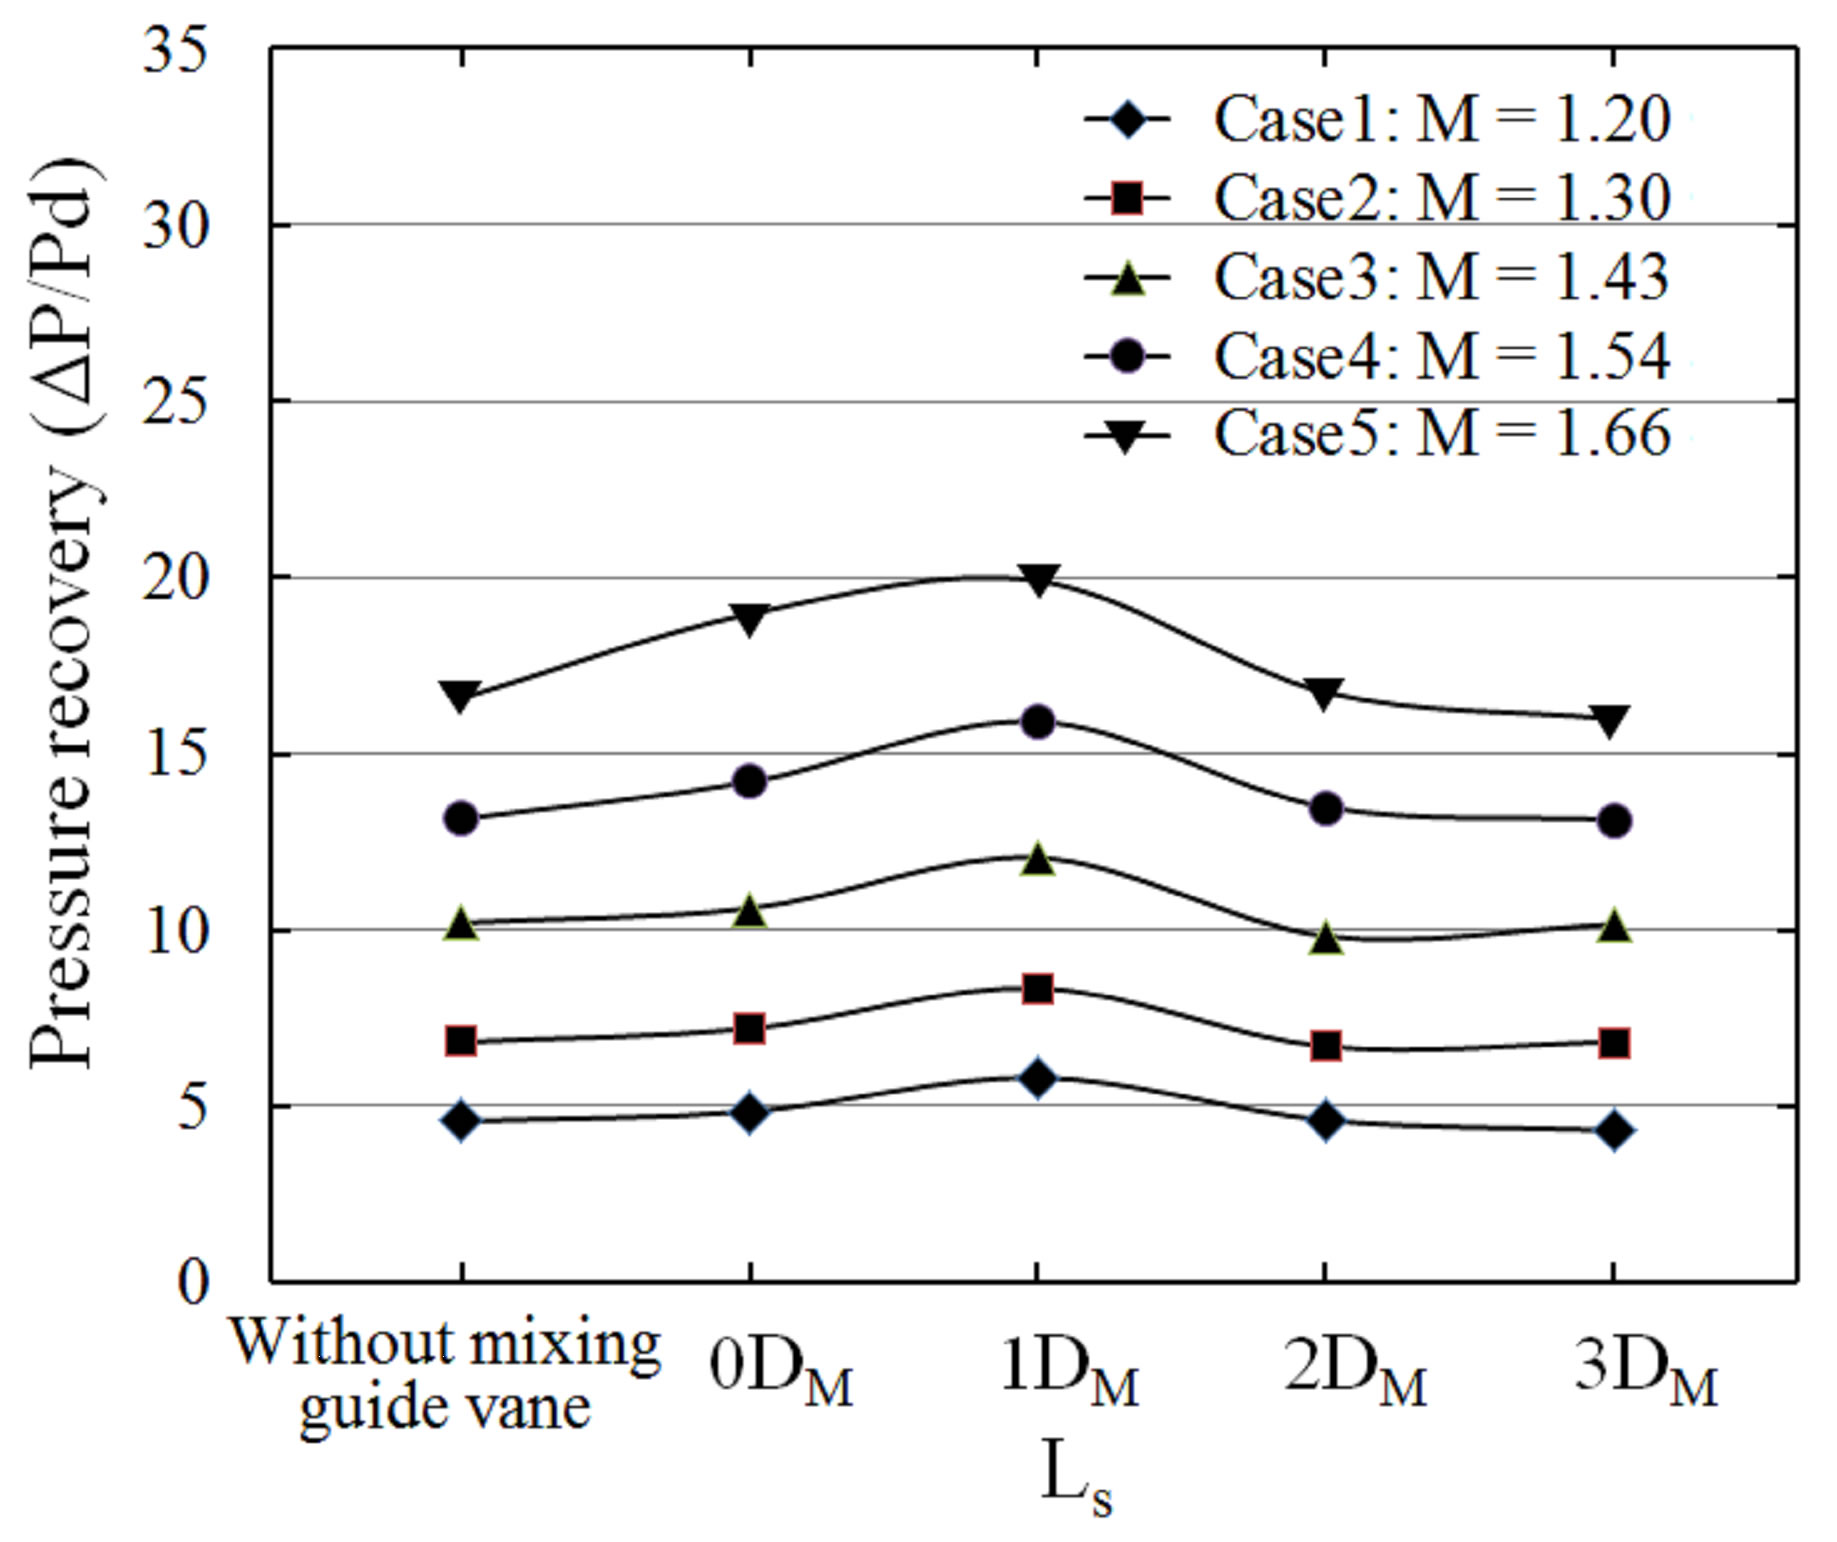
Figure 8. Pressure recovery vs. position of mixing guide vane.
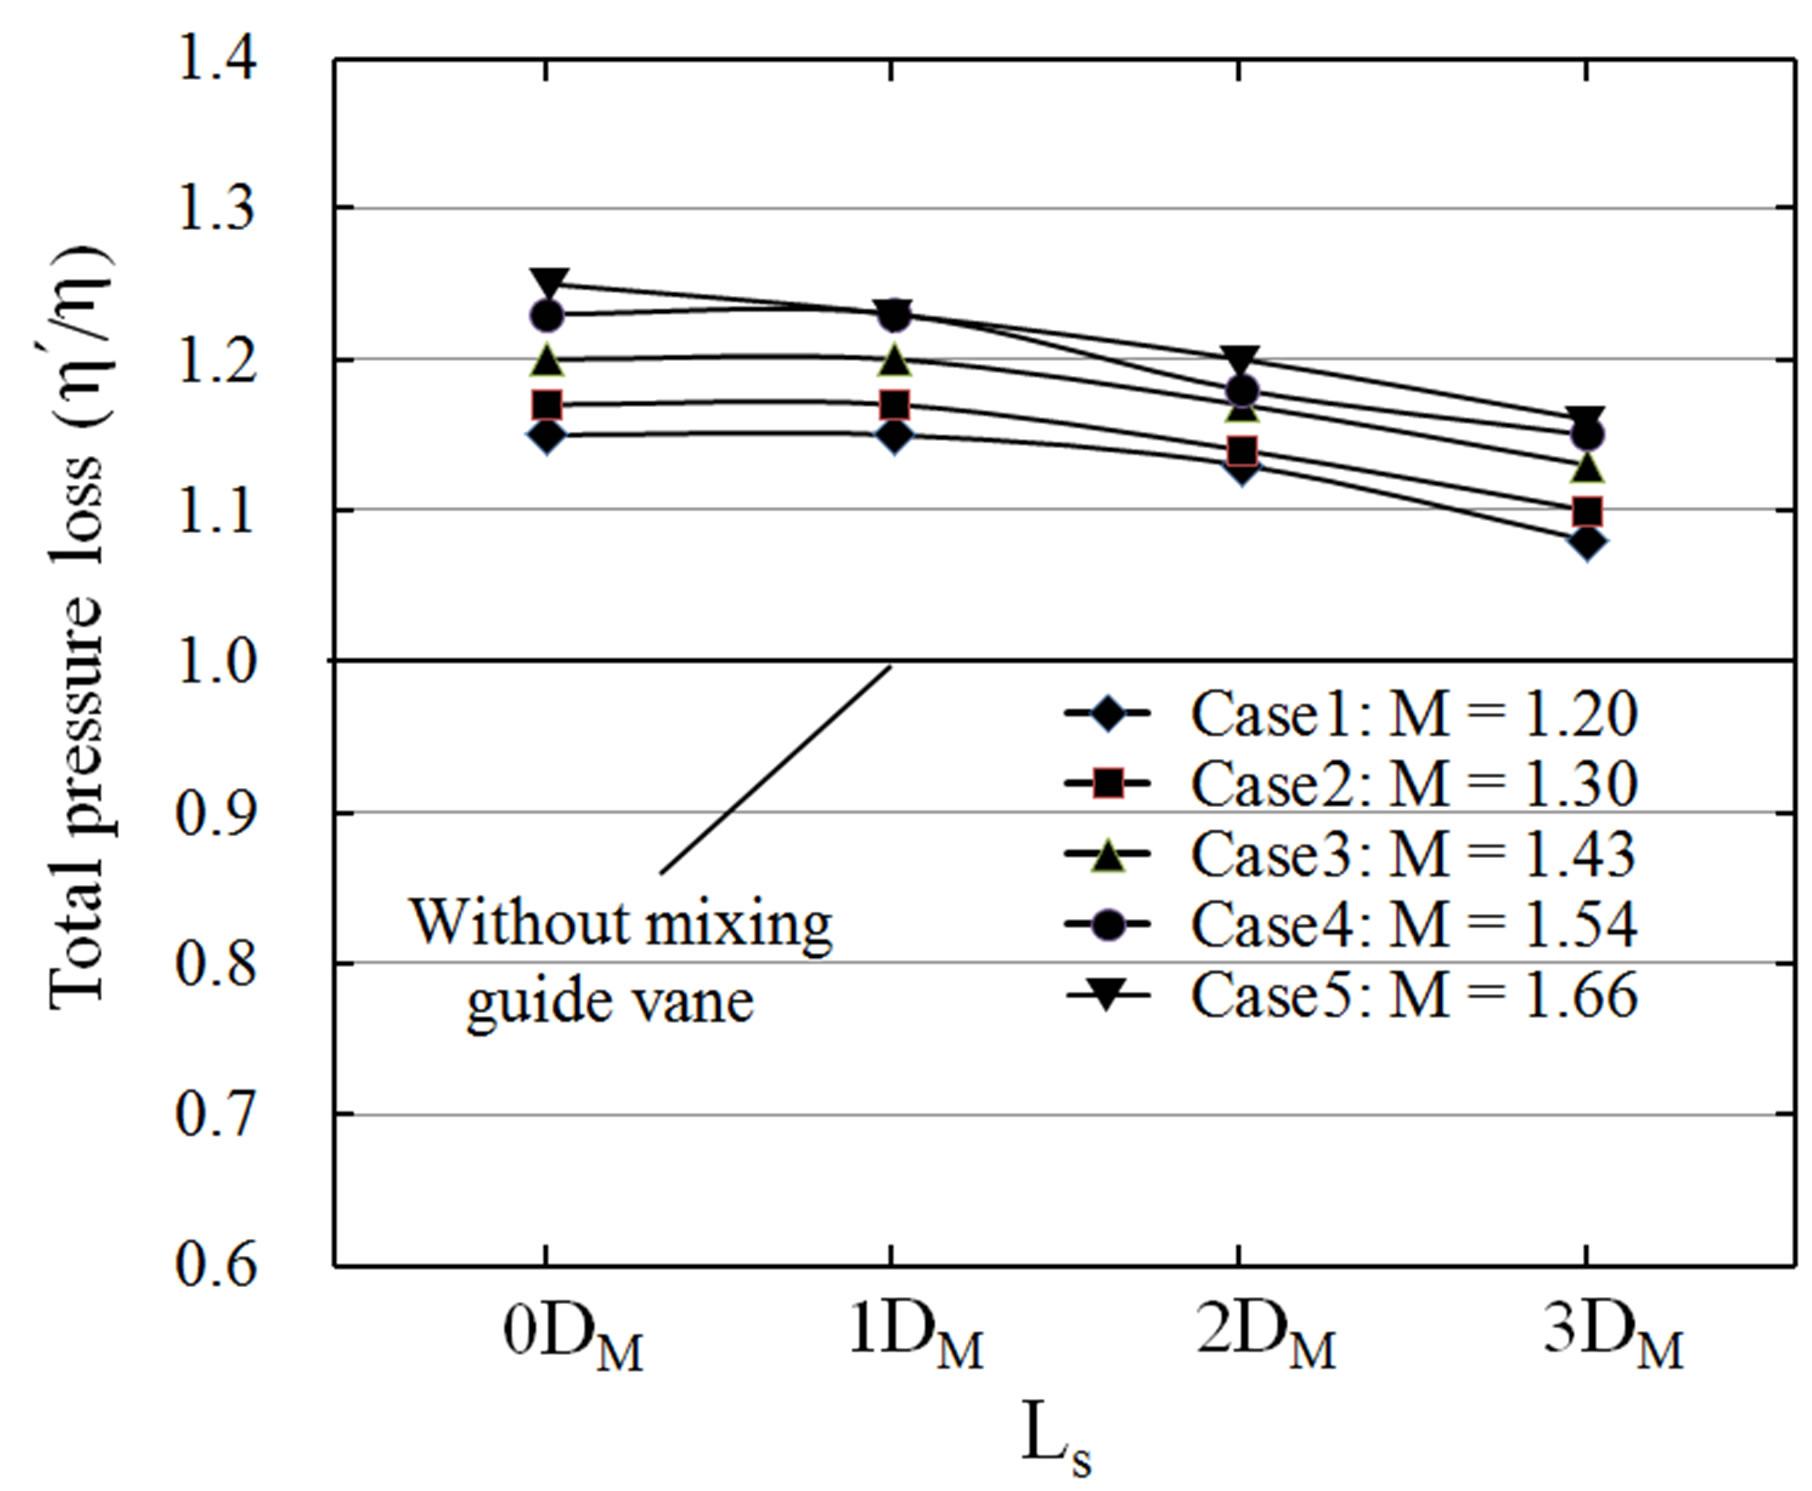
Figure 9. Comparison of total pressure loss between with and without mixing guide vane.
shows optimal results, which will be used in the following geometries.
3.2. Effects of Lengths of Mixing Guide Vane
In this part, the performance of the ejector-diffuser and effects of the mixing guide vane were discussed in effects of lengths. The distance to nozzle exit was stabled to a constant of 1DM while lengths of mixing guide vane were changed.
The entrainment ratio under lengths effects is illustrated in Figure 10. Following the position moving, the models with LV = 14DM/4 (model H) and LV = 14DM/2 (model I) show similar results, and the model with LV = 14DM/2 show better results compared with another model. In model I, The increment of entrainment ratio is 6.8%, and the maximum value of increase achieved 7.5% when Mach number equaled 1.43. Following the lengths changing, the mixing guide vane effects are found in different trends.
Figure 11 represents the pressure recovery under LV effects. All the models show resemble results compared with the model A. Along the length increases, the pressure recovery is increasing in all the models. The average value of increase achieves 20.33%. Compared all the 3 cases, the model with LV = 14DM shows better results compared with another model. The increment of pressure ratio is 21.6% in average, and the maximum value of increase achieves 27% when Mach number equal 1.66. The increase amplitude in pressure recovery becomes larger when the primary stream Mach numbers decrease.
Figure 12 shows the comparison of total pressure loss between with and without mixing guide vane. Along the LV decreasing, the negative influence on frictional force becomes weaker. That’s why the total pressure loss is decreased along the LV decreasing, but still larger than the model without mixing guide vane. Although the mixing guide vane really helps to mix the primary &
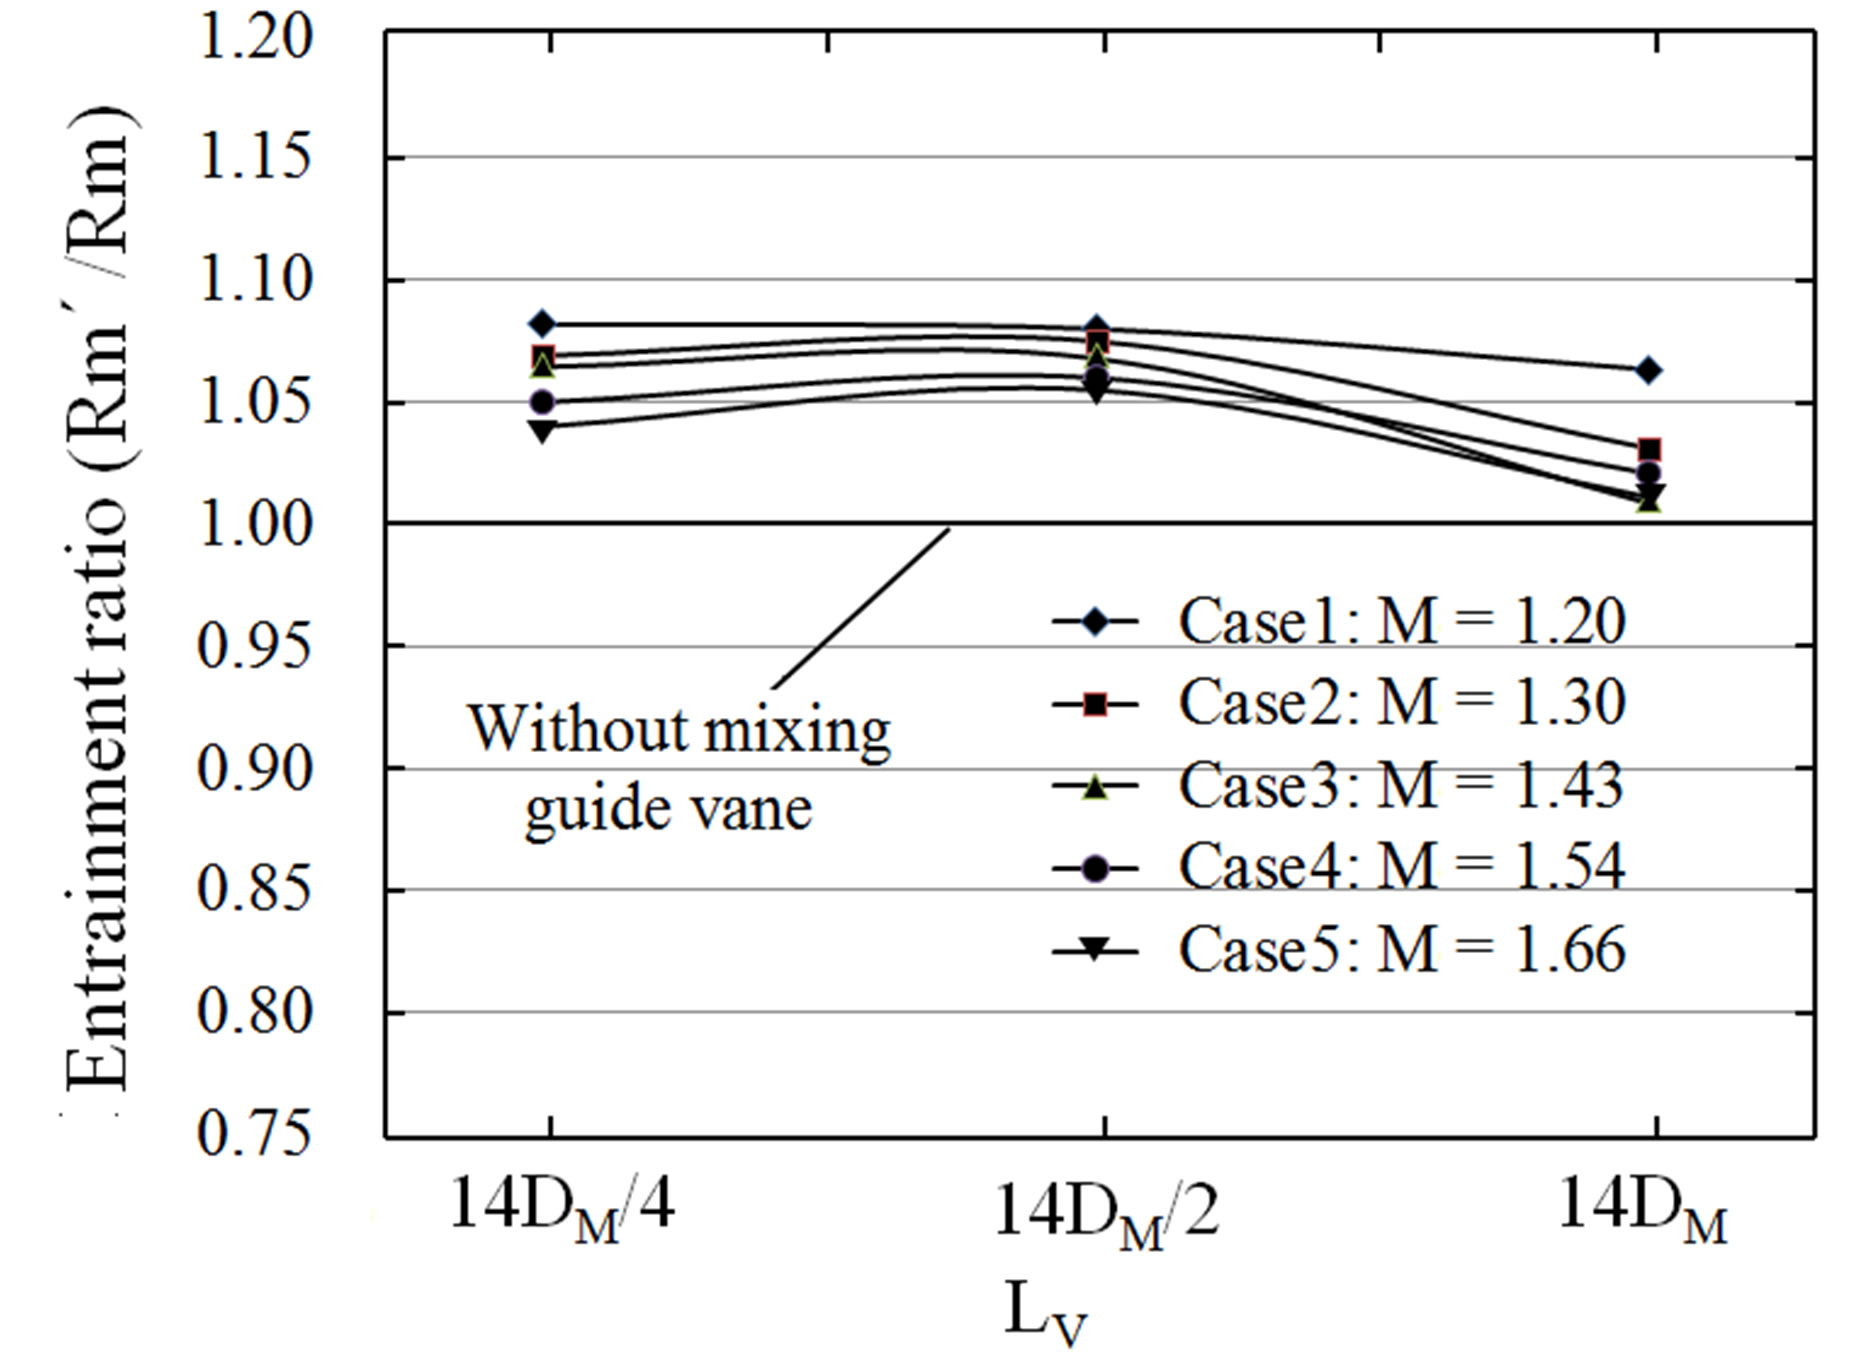
Figure 10. Entrainment ratios under lengths effects.
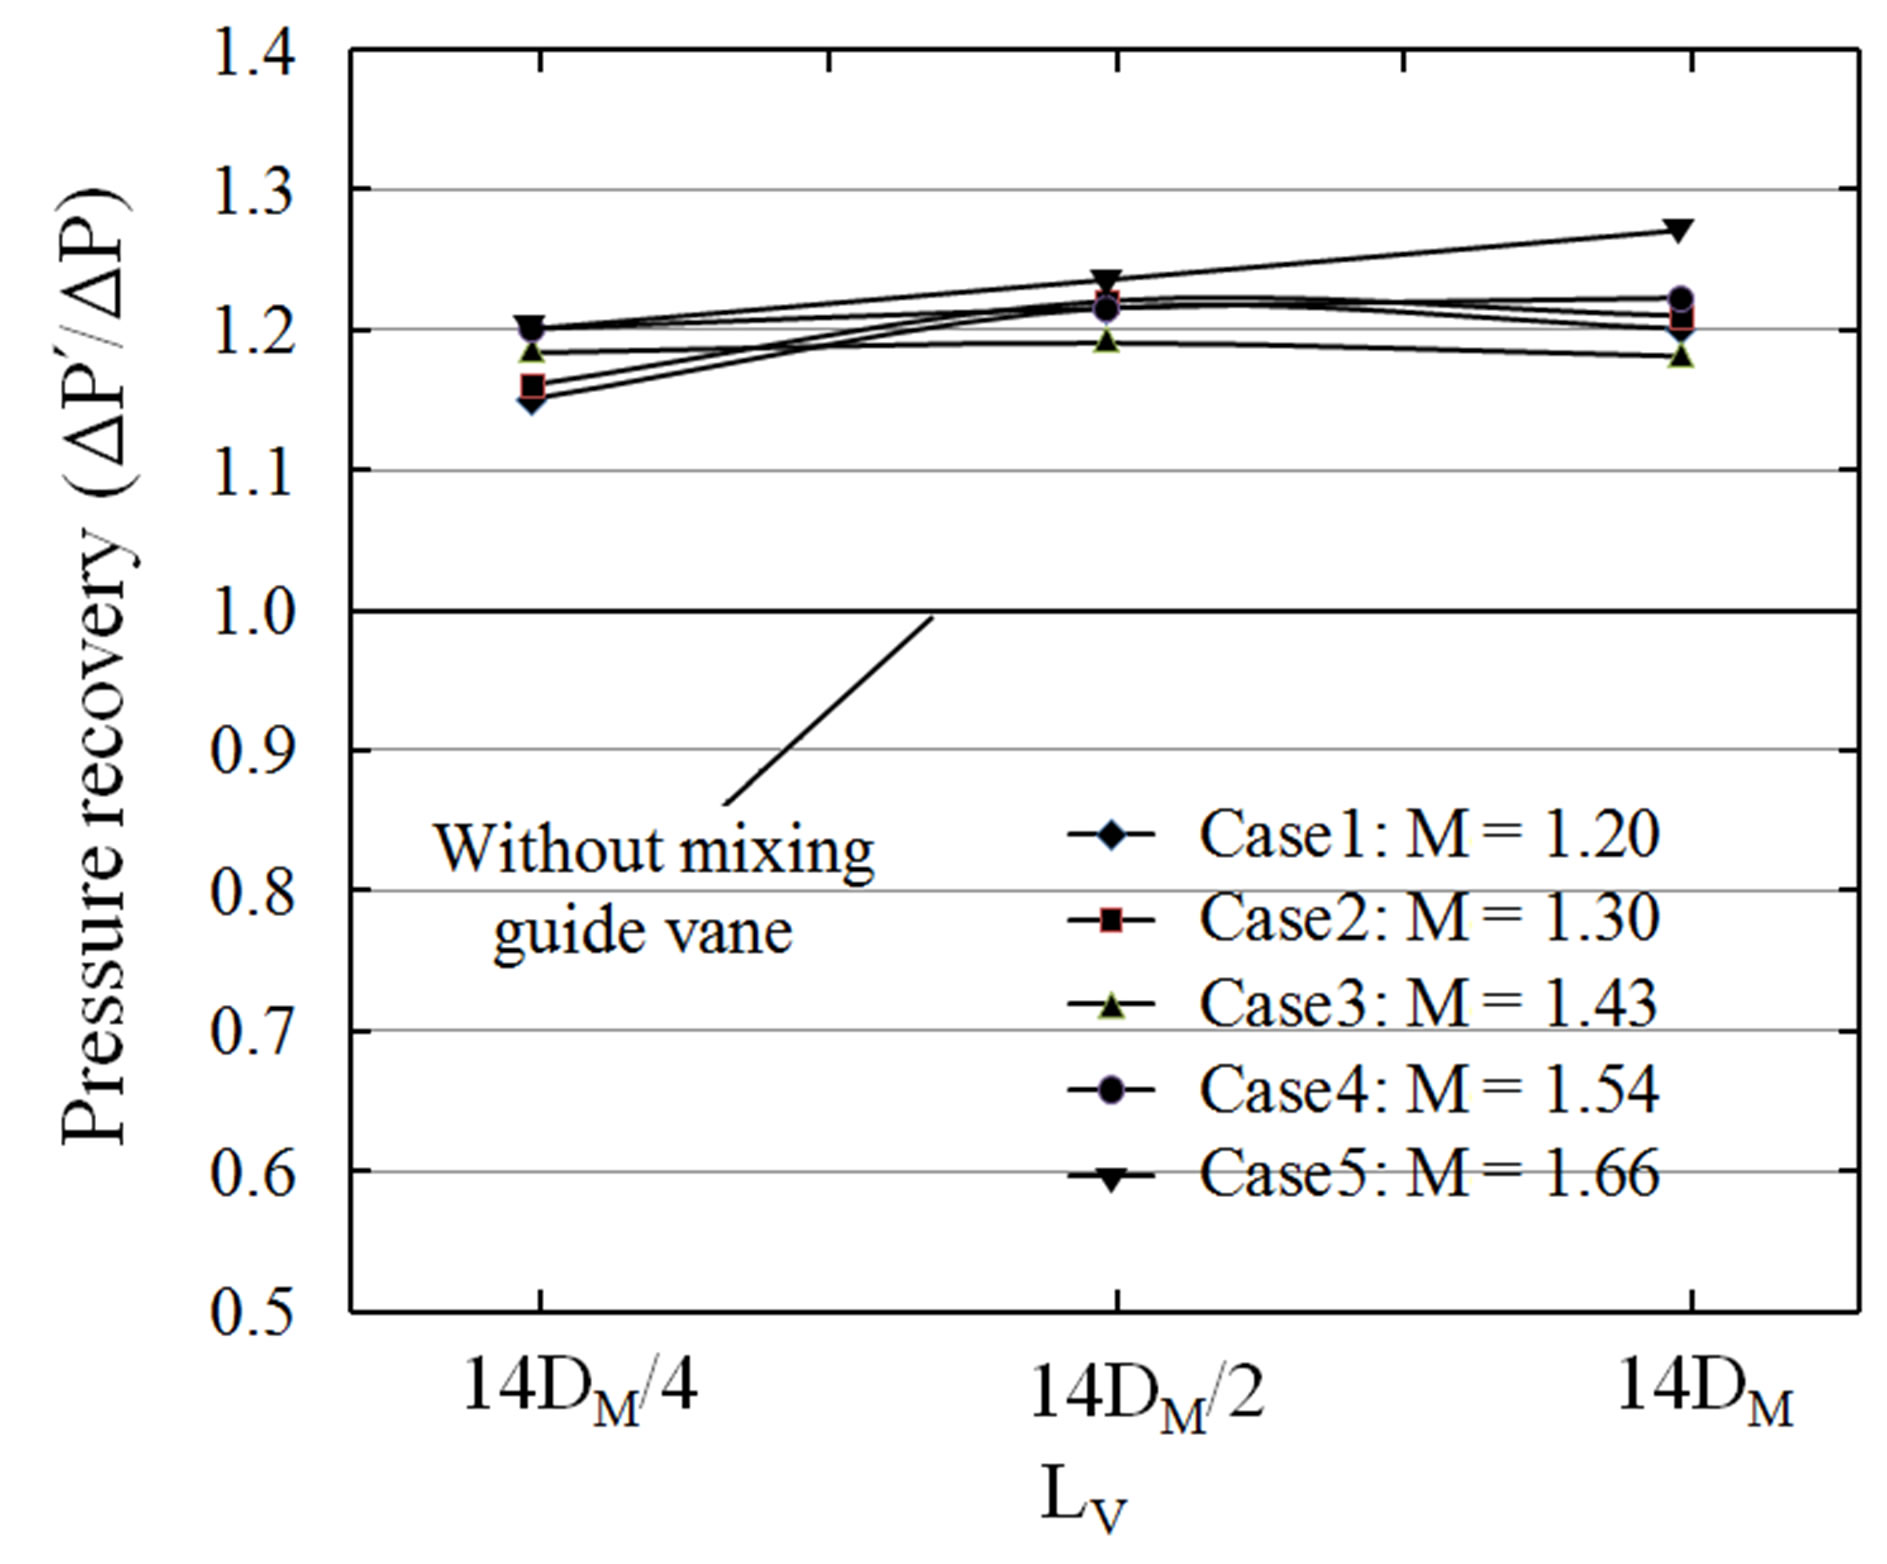
Figure 11. Pressure recoveries under lengths effects.
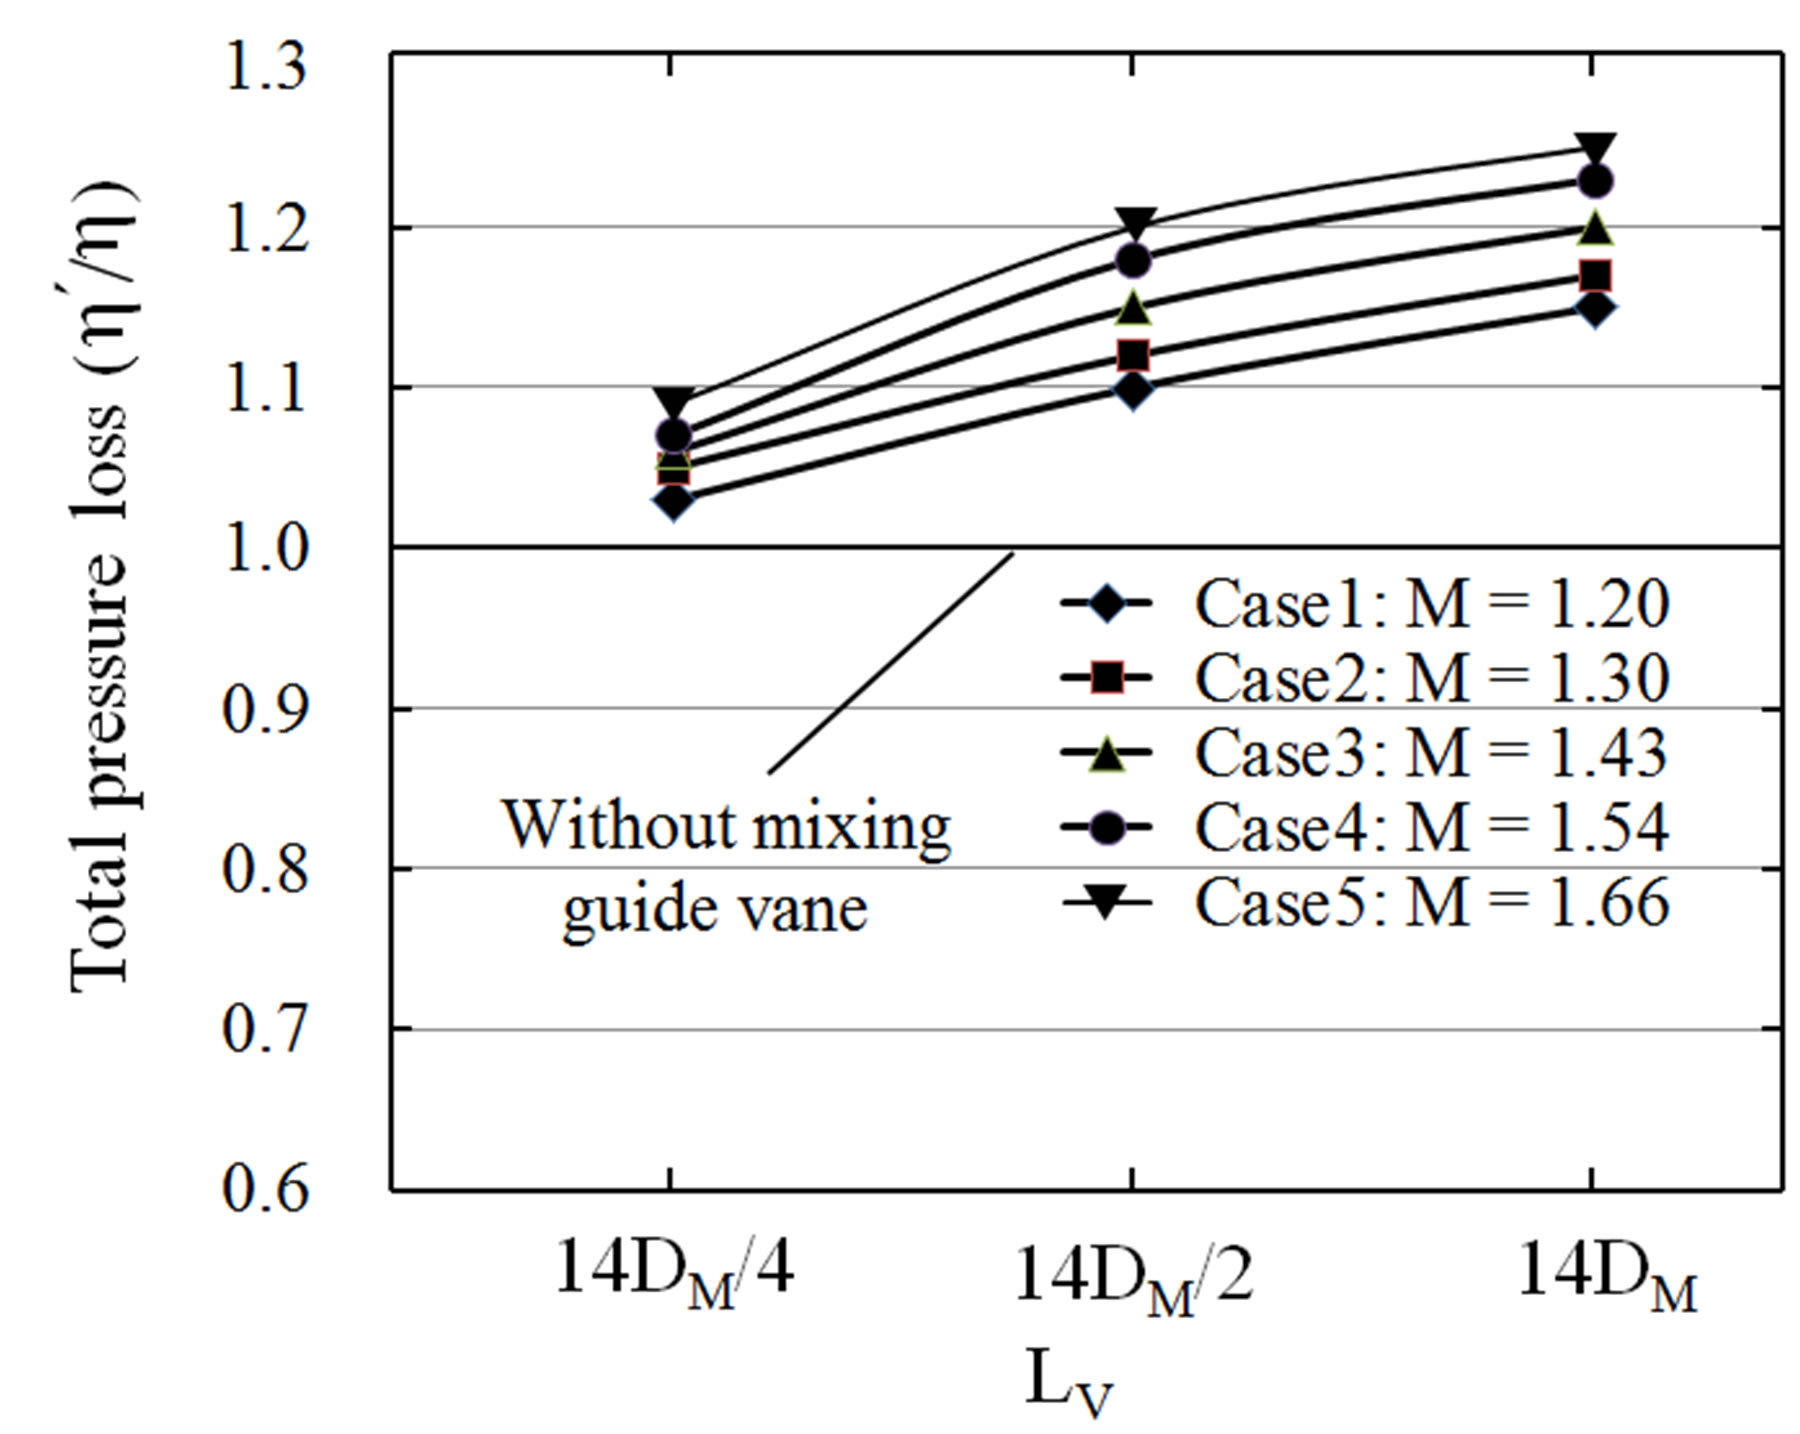
Figure 12. Total pressure loss under lengths effects.
secondary stream, but the frictional force will be increased. When the Mach number of primary stream increases from 1.20 to 1.66, the increase in amplitude of total pressure loss becomes larger.
With a mixing guide vane, the energy transfer of mixing between two streams is increased effectively, which enhances the performance of the ejector-diffuser system to higher level. Compared all the results in the previous researching, the model I with 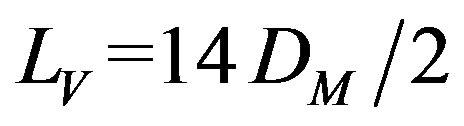 gets higher entrainment ratio, and model C with LV = 14DM gets higher pressure recovery. The model C with LV = 14DM is chosen in the following geometries.
3.3. Effects of Numbers of Mixing Guide Vane
In the present study, the entrainment ratio under number effects was shown in Figure 13. The effects of mixing guide vanes and the influence on the system can be easily found. All computational results based on 5 different Mach numbers of nozzle exit were compared. The geometry of each mixing guide vane was created exactly same with the model C, while Ls = 1DM and LV = 14DM.
In the Figure 13, the entrainment ratio under number effects is shown. Along the number increase, different effects of mixing guide vane are shown as follows: the model with 1 mixing guide vane has a positive influence on the ejector, the average increment is 2.7% and maximum value is 6.3%. In the model F with 2 mixing guide vanes and model G with 3 mixing guide vanes, they get a negative influence on the entrainment ratio, in a percentage decrease of 4.0% and 9.4%. At the same time, when M ranges from 1.20 to 1.66, it is found that the difference of entrainment ratio tends to decrease. Compared with all 4 models, the model C shows optimal results. The maximum increment of entrainment ratio in the model C is 6.3%, when the Mach number equals 1.20.
In the Figure 14, the pressure recovery under number effects is illustrated. The effects of mixing guide vane
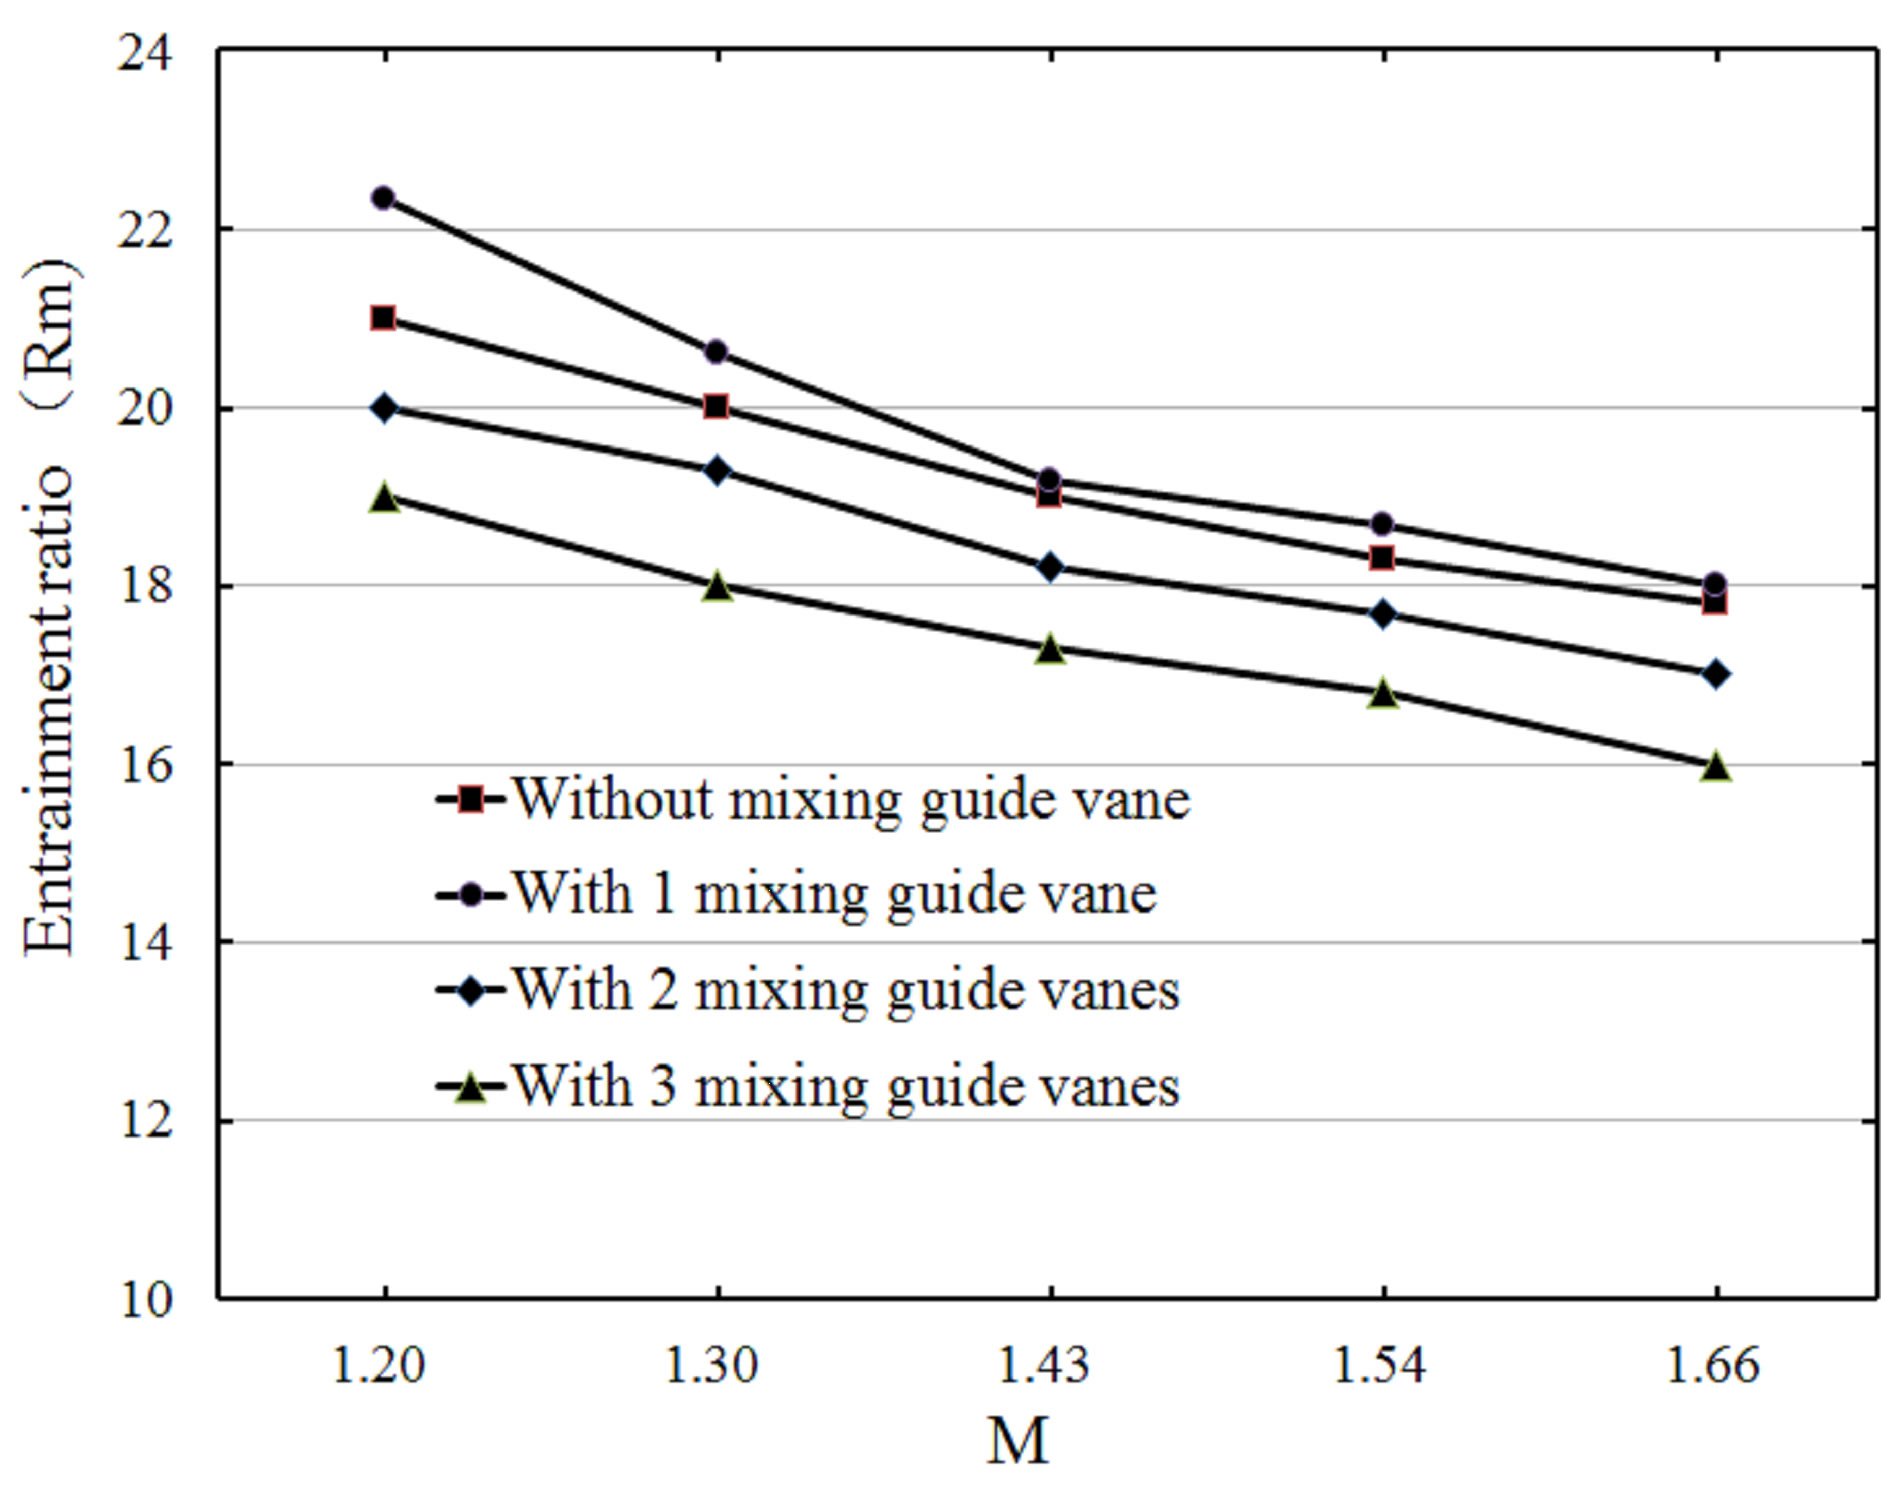
Figure 13. Entrainment ratio vs. numbers of mixing guide vane.
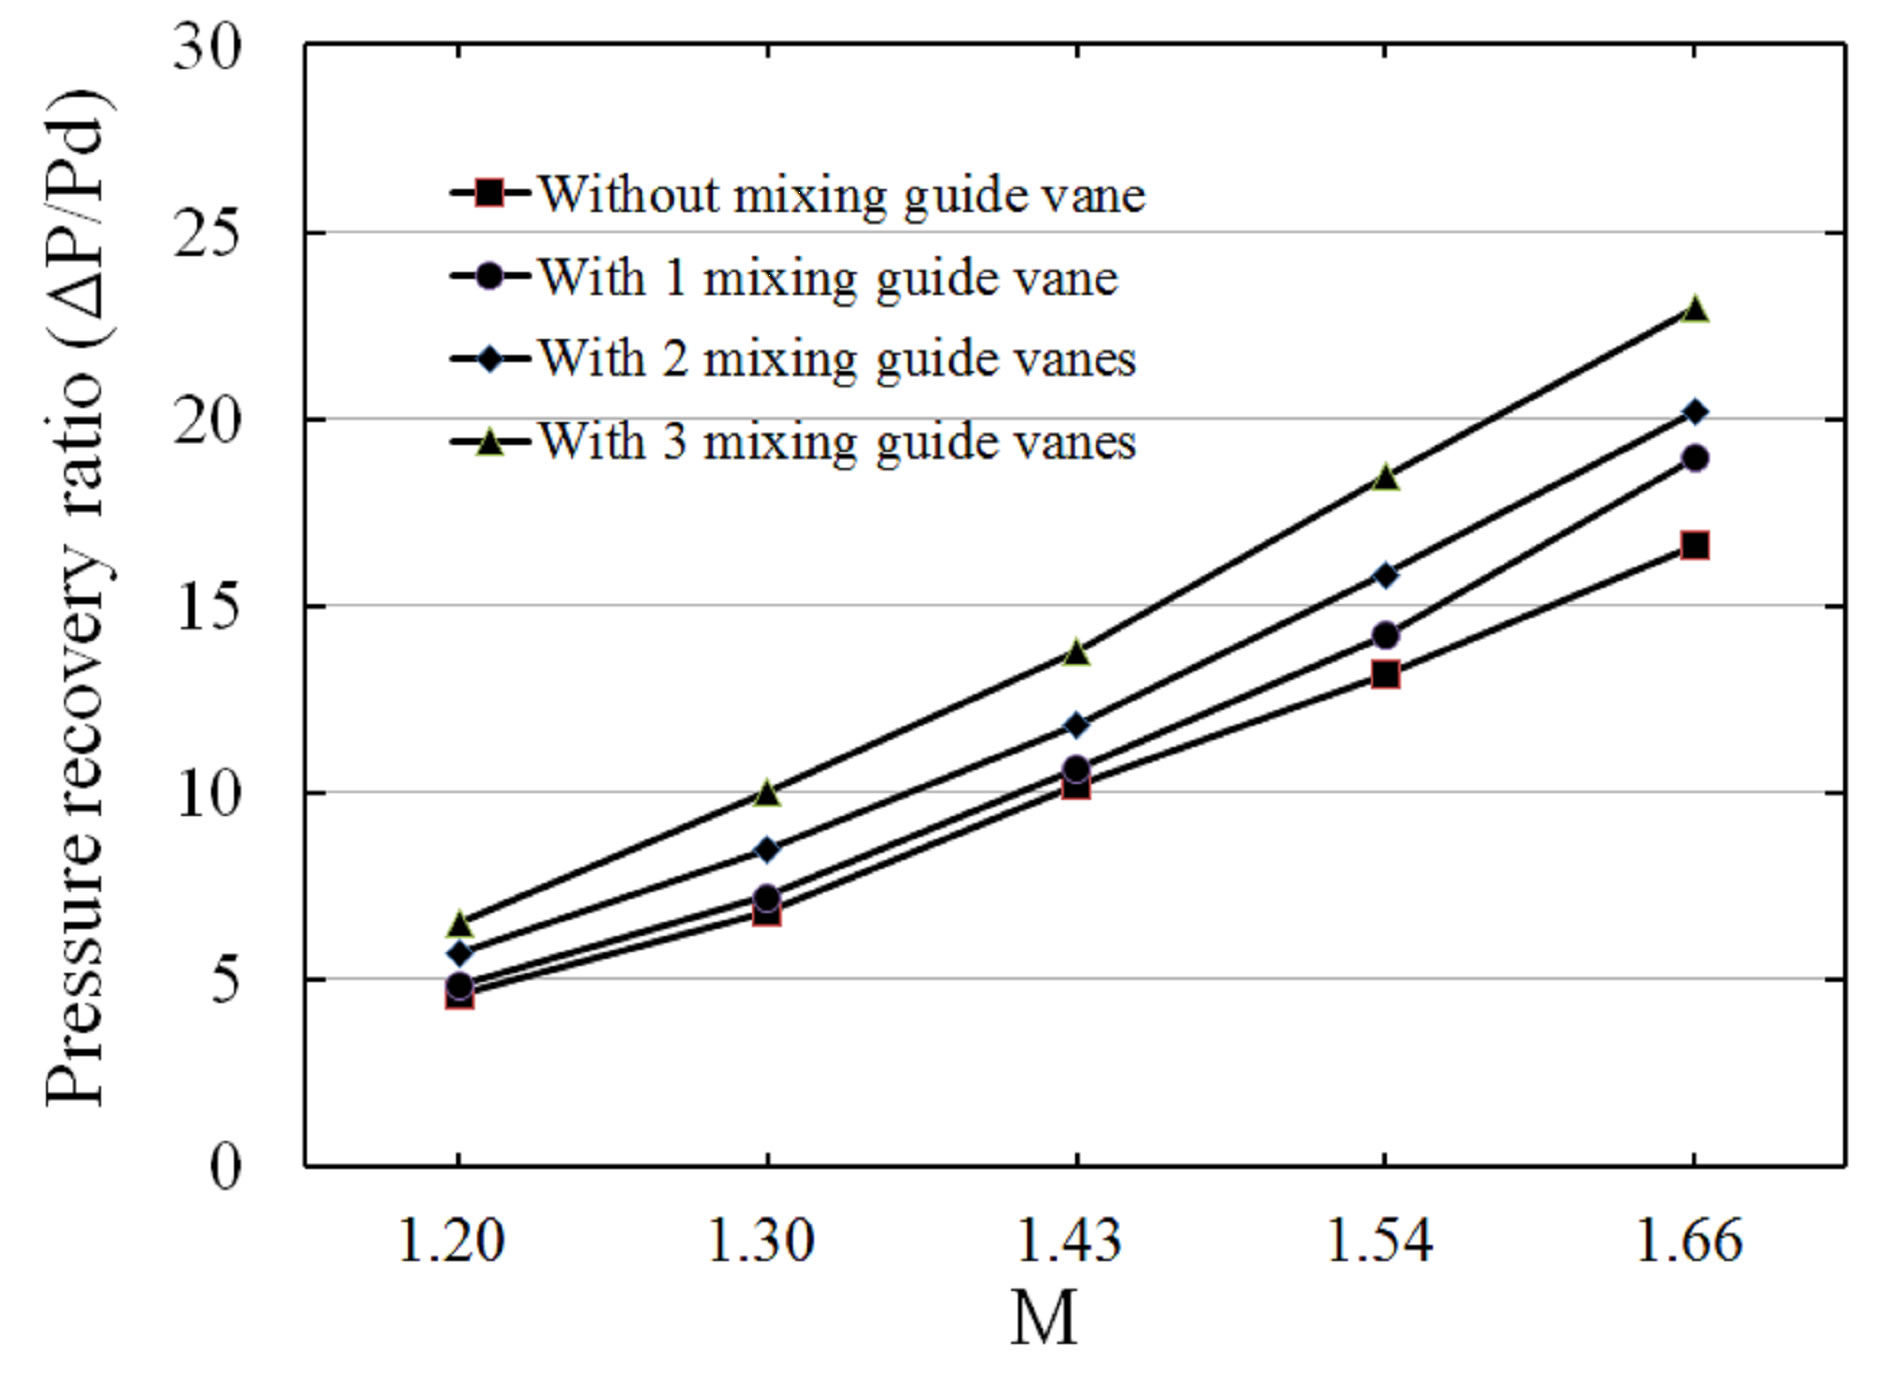
Figure 14. Pressure recovery ratio vs. numbers of mixing guide vane.
geometry are also investigated in these graphics. Along the Mach number increasing, the pressure recovery becomes larger gradually. With the number increase, effects of mixing guide vane are shown in resemble ways, all 3 models with mixing guide vanes show better results in pressure recovery than the model without mixing guide vane. Among them, the model with 3 mixing guide vanes has a best influence on the ejector, with an average increment of 30.5%, and the maximum amplitude is 36.3%.
The comparisons of total pressure loss with and without mixing guide vane are illustrated in Figure 15. Along the number increasing, the negative influence on frictional force becomes stronger. That’s why the total pressure loss was increased along the number increasing, similar trend can be found in the Mach number influence. Although the mixing guide vane really helps to mix the primary & secondary stream, but the frictional force will be increased.
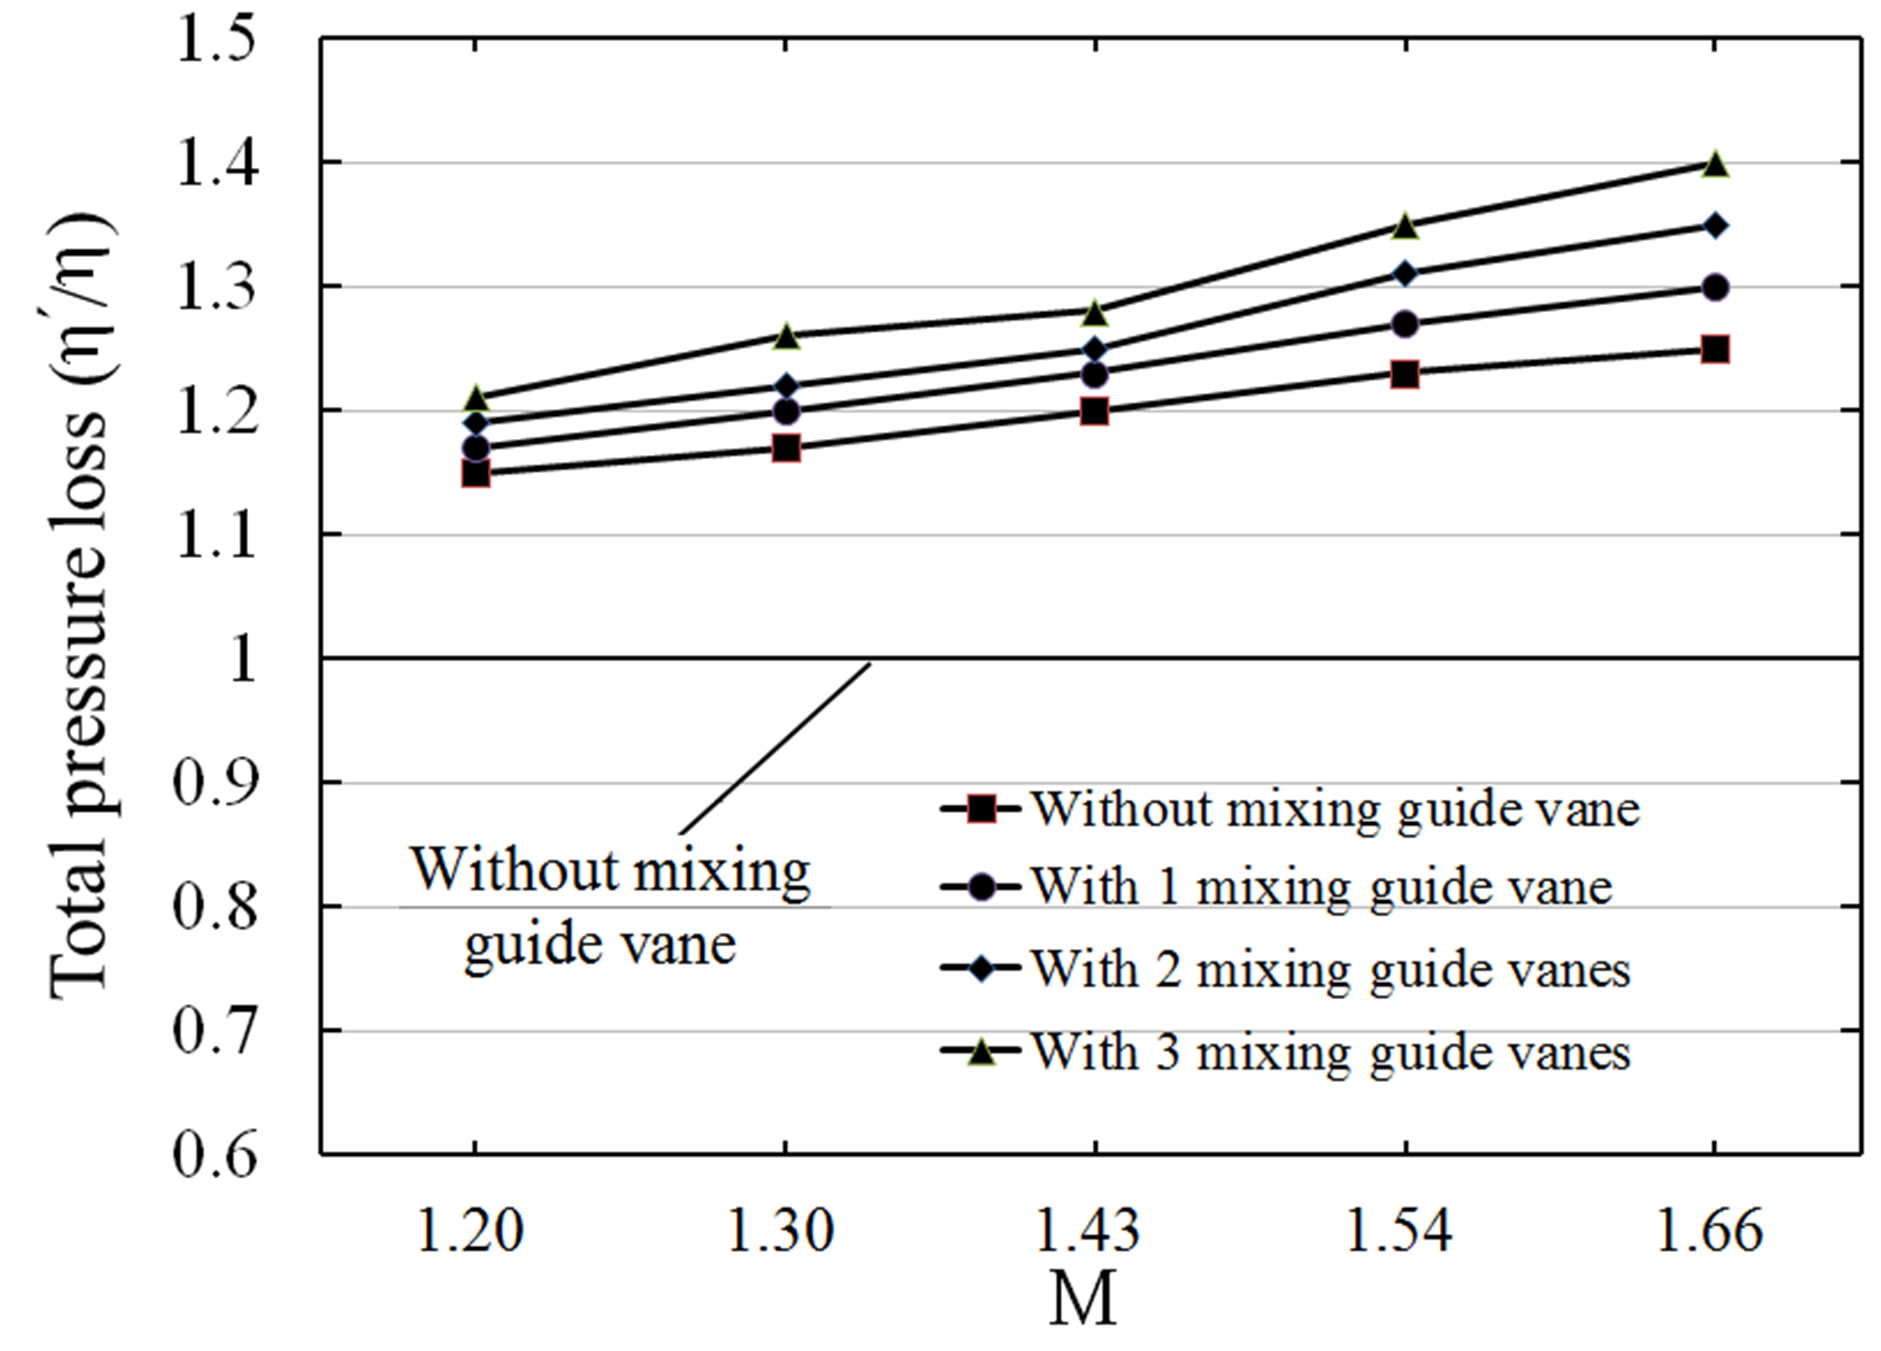
Figure 15. Comparisons of total pressure loss ratio with and without mixing guide vane.
3.4. The Ejector Performance with an Optimal Mixing Guide Vane
From the comparison of these models (Table 2) under different cases (Table 4), the area of the mixing section and the productive capacity of primary stream were changed. Generally speaking, with a mixing guide vane, more flow vortexes were generated and more vertical flow was introduced into the stream [21,23]. Therefore, rotary stream passed through the mixing chamber and introduced more shear stress to propel the secondary stream into the ejector-diffuser system, which effectively enhanced the performance of the ejector-diffuser system. Furthermore, more researching works were needed to investigate the deeper effects of mixing guide vane.
Due to the characteristics of compression flow, shock wave should occur in the internal flow section when the Mach number is larger than 1. In this paper, the ejector has a special feature that the length-diameter ratio is very high, the total length of mixing section is almost 15DM, and the total length of ejector is nearly 30DM. That is a typical ejector structure which has a shorter mixing process compared with the long geometrical model. Primary stream and secondary stream were mixed up fully in the early beginning in the mixing chamber. Furthermore, a very small diameter of supersonic nozzle can be found in the geometrical model.
Considering all these features and characteristics of the supersonic ejector-diffuser system, the researching upon the shock system are more significant and meaningful, especially the shocks around the nozzle exit of primary stream. Besides, after compared all different contours graphics, contours of Mach number show more obvious results of shock system. The contours of Mach number compared model A (without mixing guide vane) and model C (optimal mixing guide vane) were illustrated in the Figure 16. All these figures were based on case 5 with a Mach number of 1.66, which showed more obvious results. Model C got the highest in the entrainment ratio, mixing guide vane effects will be more significant to compare the model A and model C.
In the Figure 16, the upper figures show the position of the Mach number variation, marked in a red quadrilateral. For lower figures, the first field represents the
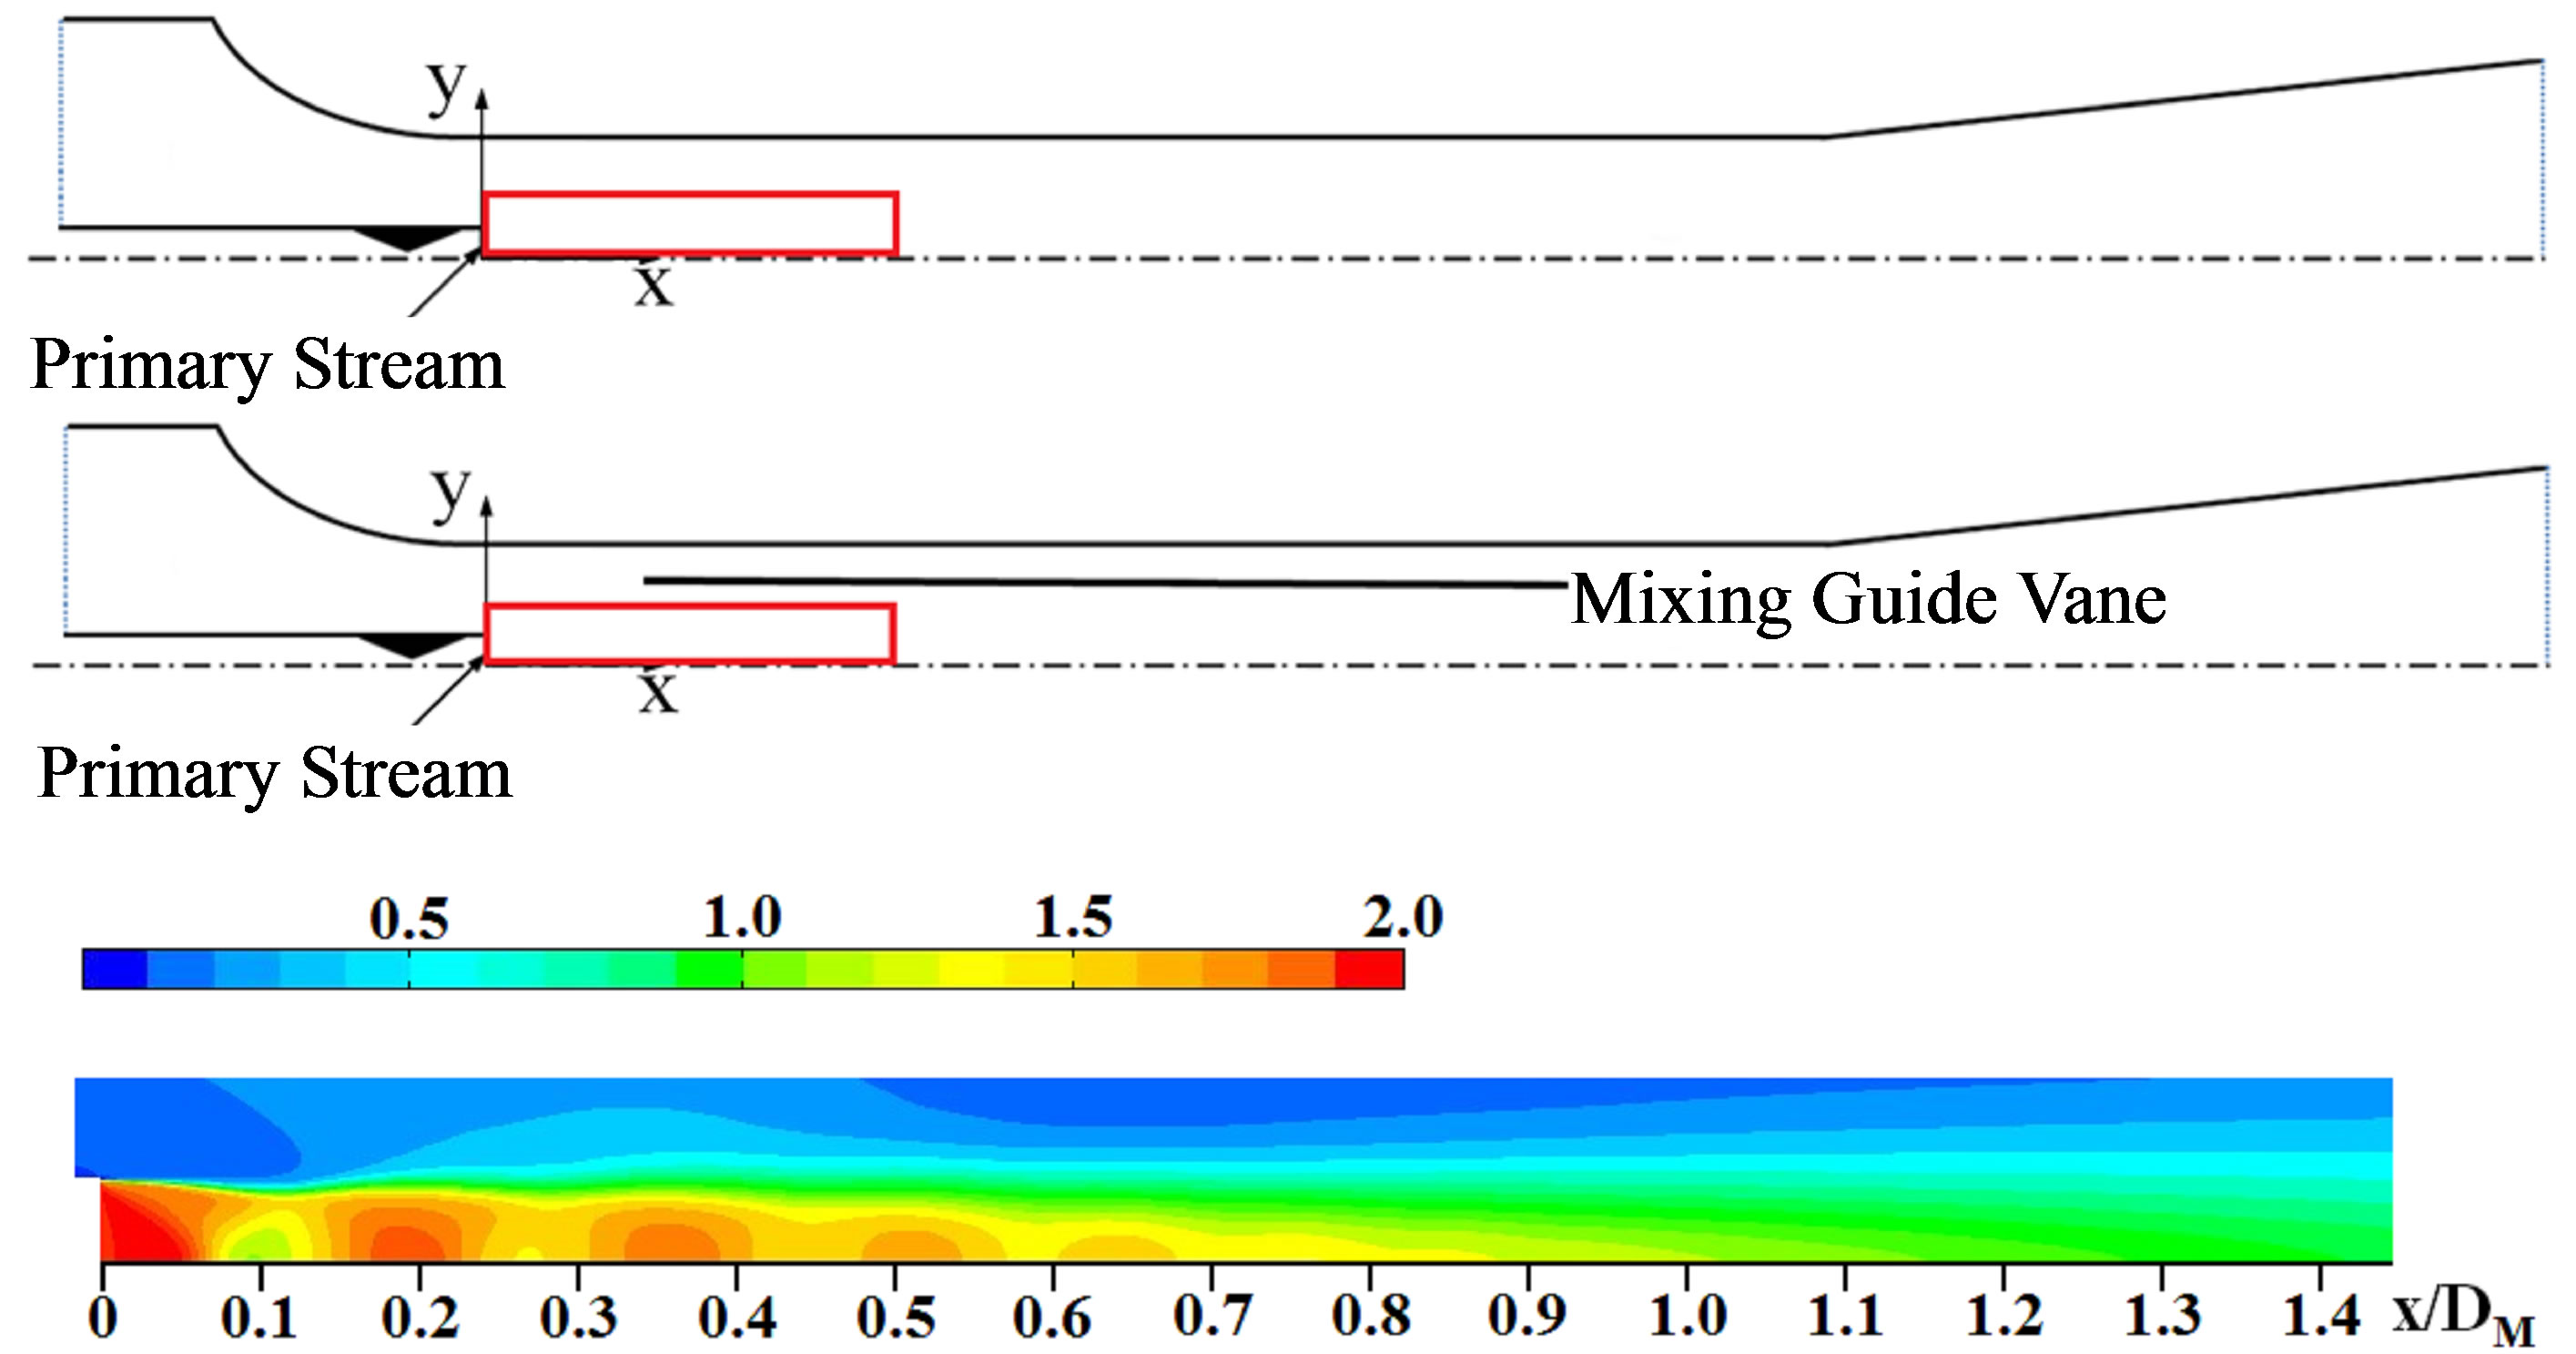 (a)
(a) 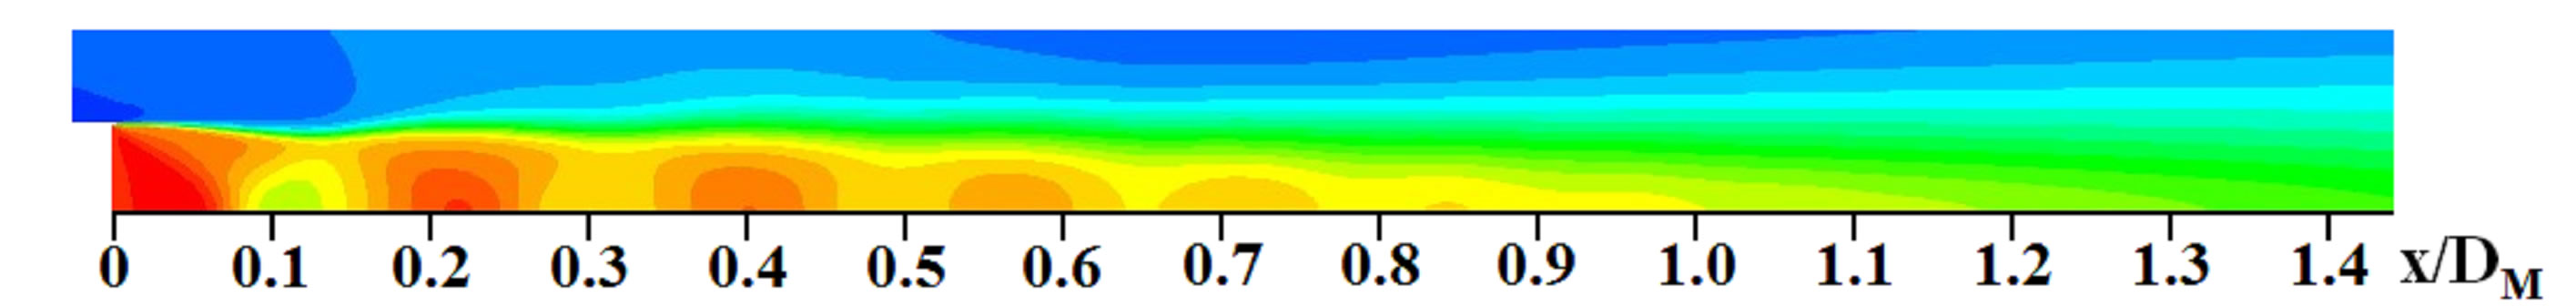 (b)
(b)
Figure 16. Contours of Mach number for case 5. (a) Without mixing guide vane (Model A); (b) With mixing guide vane (Model C).
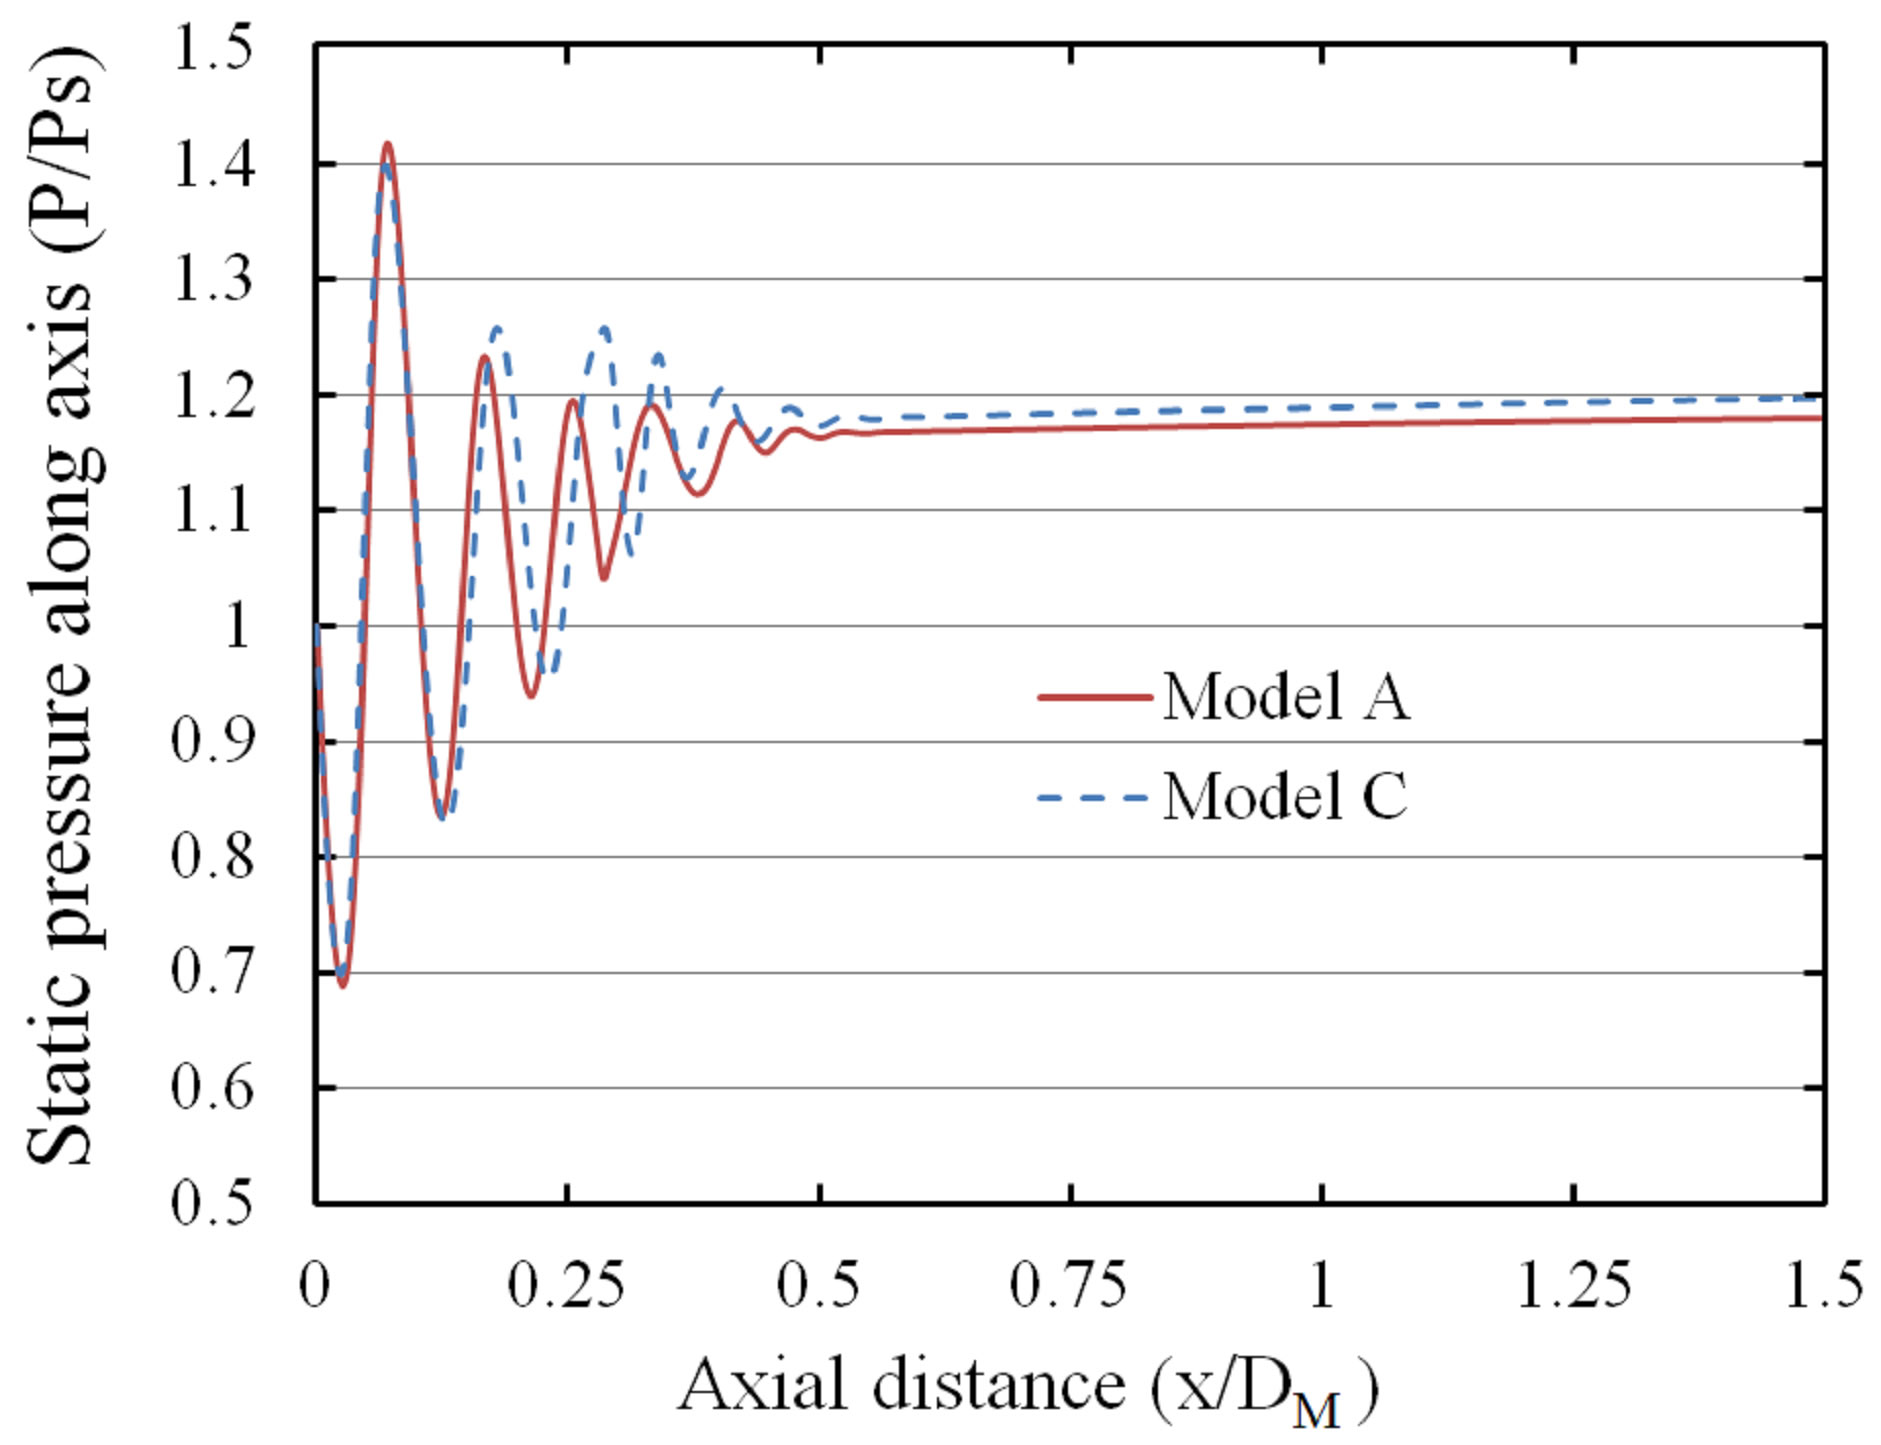
Figure 17. Static pressure distributions along the ejector axis.
computational results for the model A without mixing guide vane. The scales of these contours are exactly same to each other, in order to compare in a same standard. Both figures are illustrated in a same continuous variation of the distance begin from the supersonic nozzle exit, from 0DM to 1.4DM. Figure 17 shows the flow structures from other hand of distributions of static pressure. Analogous conclusions also can be found in the figure. As the results of energy exchange between both streams, shock systems are influenced and elevated by mixing guide vanes compared with the model without mixing guide vane.
From these figures, a strong first shock can be found. Continuous shock cells were created as following. The differences were concentrated on the mixing guide vane effects of shock waves. The model C with a distance of 1DM showed better influence on the shock system, and more shock cells can be found in this model. Hence, it should be easy to get an opinion that a longer sub-critical area created a better promotion in the entrainment ratio [18].
4. Conclusions
In the present paper, a computational method was carried to simulate the internal flow of an ejector-diffuser system. The mixing guide vane effects on the performance of the ejector were investigated. The optimal position and length of mixing guide vane were given. The effects of mixing guide vane numbers were studied. Both models with and without guide vane were compared. Numerical results were confirmed by previous experimental data.
4 different positions, 3 lengths, 3 numbers of mixing guide vane were involved in the present research. As the conclusion of an optimal model, the entrainment ratio was improved 7.5% as the maximum value, and the maximum increment of pressure recovery achieved 36.6%. The effects on performance of the supersonic ejectordiffuser system were obvious. At the same time, all the models with mixing guide vane showed better results to increase the pressure recovery. On the other hand, total pressure loss ratio was increased under the mixing guide vane influence.
Actually, according to the research from W. Somsak and etc. [22,23], the mixing guide vane effects on seconddary inlet was investigated in the experimental research. From present computational analysis of mixing guide vane effects, the guide vane influence on shock system was also obvious, which involve more secondary stream as a consequence.
REFERENCES
- K. Chunnanond and S. Aphornratana, “Ejectors: Applications in Refrigeration Technology,” Renewable and Sustainable Energy Reviews, Vol. 8, No. 2, 2004, pp. 129- 155. doi:10.1016/j.rser.2003.10.001
- Z. Aidoun and M. Ouzzane, “The Effect of Operating Conditions on the Performance of a Supersonic Ejector for Refrigeration,” International Journal of Refrigeration, Vol. 27, No. 8, 2004, pp. 974-984. doi:10.1016/j.ijrefrig.2004.05.006
- Y. Bartosiewicz, Z. Aidoun and Y. Mercadier, “Numerical Assessment of Ejector Operation for Refrigeration Applications Based on CFD,” Applied Thermal Engineering, Vol. 26, No. 5-6, 2006, pp. 604-612. doi:10.1016/j.applthermaleng.2005.07.003
- J. Yan, S. Shao, J. Liu and Z. Zhang, “Experiment and Analysis on Performance of Steam-Driven Jet Injector for District-Heating System,” Applied Thermal Engineering, Vol. 25, No. 8-9, 2005, pp. 1153-1167. doi:10.1016/j.applthermaleng.2004.09.001
- C. J. Korresa, A. T. Papaioannoub, V. Lygeroub and N. G. Koumoutsosb, “Solar Cooling by Thermal Compression: the Dependence of the Jet Thermal Compressor Efficiency on the Compression Ratio,” Energy, Vol. 27, No. 8, 2002, pp. 795-805.
- M. Ouzzane and Z. Aidoun, “Model Development and Numerical Procedure for Detailed Ejector Analysis and Design,” Applied Thermal Engineering, Vol. 23, No. 18, 2003, pp. 2337-2351. doi:10.1016/S1359-4311(03)00208-4
- A. Selvaraju and A. Mani, “Analysis of an Ejector with Environment Friendly Refrigerants,” Applied Thermal Engineering, Vol. 24, No. 5-6, 2004, pp. 827-838. doi:10.1016/j.applthermaleng.2003.08.016
- Y. M. Chen and C. Y. Sun, “Experimental Study of the Performance Characteristics of a Steam-Ejector Refrigeration System,” Experimental Thermal and Fluid Science, Vol. 15, No. 4, 1997, pp. 384-394. doi:10.1016/S0894-1777(97)00006-X
- B. J. Huang and J. M. Chang, “Empirical Correlation for Ejector Design,” International Journal of Refrigeration, Vol. 22, No. 5, 1999, pp. 379-388. doi:10.1016/S0140-7007(99)00002-X
- B. J. Huang, J. M. Chang, C. P. Wang and V. A. Petrenko, “A 1-D Analysis of Ejector Performance,” International Journal of Refrigeration, Vol. 22, No. 5, 1999, pp. 354- 364. doi:10.1016/S0140-7007(99)00004-3
- E. D. Rogdakis and G. K. Alexis, “Design and Parametric Investigation of an Ejector in an Air-Conditioning System,” Applied Thermal Engineering, Vol. 20, No. 2, 2000, pp. 213-226. doi:10.1016/S1359-4311(99)00013-7
- S. Aphornratana and I. W. Eames, “A Small Capacity Steam-Ejector Refrigerator: Experimental Investigation of a System using Ejector with Movable Primary Nozzle,” International Journal of Refrigeration, Vol. 20, No. 5, 1997, pp. 352-358. doi:10.1016/S0140-7007(97)00008-X
- Y. J. Chang and Y. M. Chen, “Enhancement of a SteamJet Refrigerator using a Novel Application of the Petal Nozzle,” Experimental Thermal and Fluid Science, Vol. 22, No. 3-4, 2000, pp. 203-211. doi:10.1016/S0894-1777(00)00028-5
- R. Yapıcı and H. K. Ersoy, “Performance Characteristics of the Ejector Refrigeration System Based on the Constant Area Ejector Flow Model,” Energy Conversion and Management, Vol. 46, No. 18-19, 2005, pp. 3117-3135. doi:10.1016/j.enconman.2005.01.010
- I. W. Eames, “A New Prescription for the Design of Supersonic Jet-Pumps: The Constant Rate of Momentum Change Method,” Applied Thermal Engineering, Vol. 22, No. 2, 2002, pp. 121-131. doi:10.1016/S1359-4311(01)00079-5
- Y. Bartosiewicza, Z. Aidouna, P. Desevauxb and Y. Mercadierc, “Numerical and Experimental Investigations on Supersonic Ejectors,” International Journal of Heat and Fluid Flow, Vol. 26, No. 1, 2005, pp. 56-70. doi:10.1016/j.ijheatfluidflow.2004.07.003
- V. Lijo, H. D. Kim, S. Matsuo and T. Setoguchi, “A Study of the Supersonic Ejector-Diffuser System with an Inlet Orifice,” Aerospace Science and Technology, 2011.
- N. H. Aly, A. Karameldina and M. M. Shamloulb, “Modelling and Simulation of Steam Jet Ejectors,” Desalination, Vol. 123, No. 1, 1999, pp. 1-8. doi:10.1016/S0011-9164(99)00053-3
- M. T. Kandakure, V. G. Gaikar and A. W. Patwardhan, “Hydrodynamic Aspects of Ejectors,” Chemical Engineering Scien`ce, Vol. 60, No. 22, 2005, pp. 6391-6402. doi:10.1016/j.ces.2005.04.055
- M. T. Holtzapple, “High-Efficiency Jet Ejector,” Texas A & M University, College Station, 2001.
- D. V. Manohar, “Desalination of Seawater using a HighEfficiency Jet Ejector,” Master Thesis, Texas A & M University, College Station, 2005.
- W. Somsak, “Optimization of a High-Efficiency Jet Ejector by Computational Fluid Dynamics Software,” Master Thesis, Texas A & M University, College Station, 2005.
- W. Somsak, “CFD Optimization Study of High-Efficiency Jet Ejector,” Ph.D. Thesis, Texas A & M University, College Station, 2008.
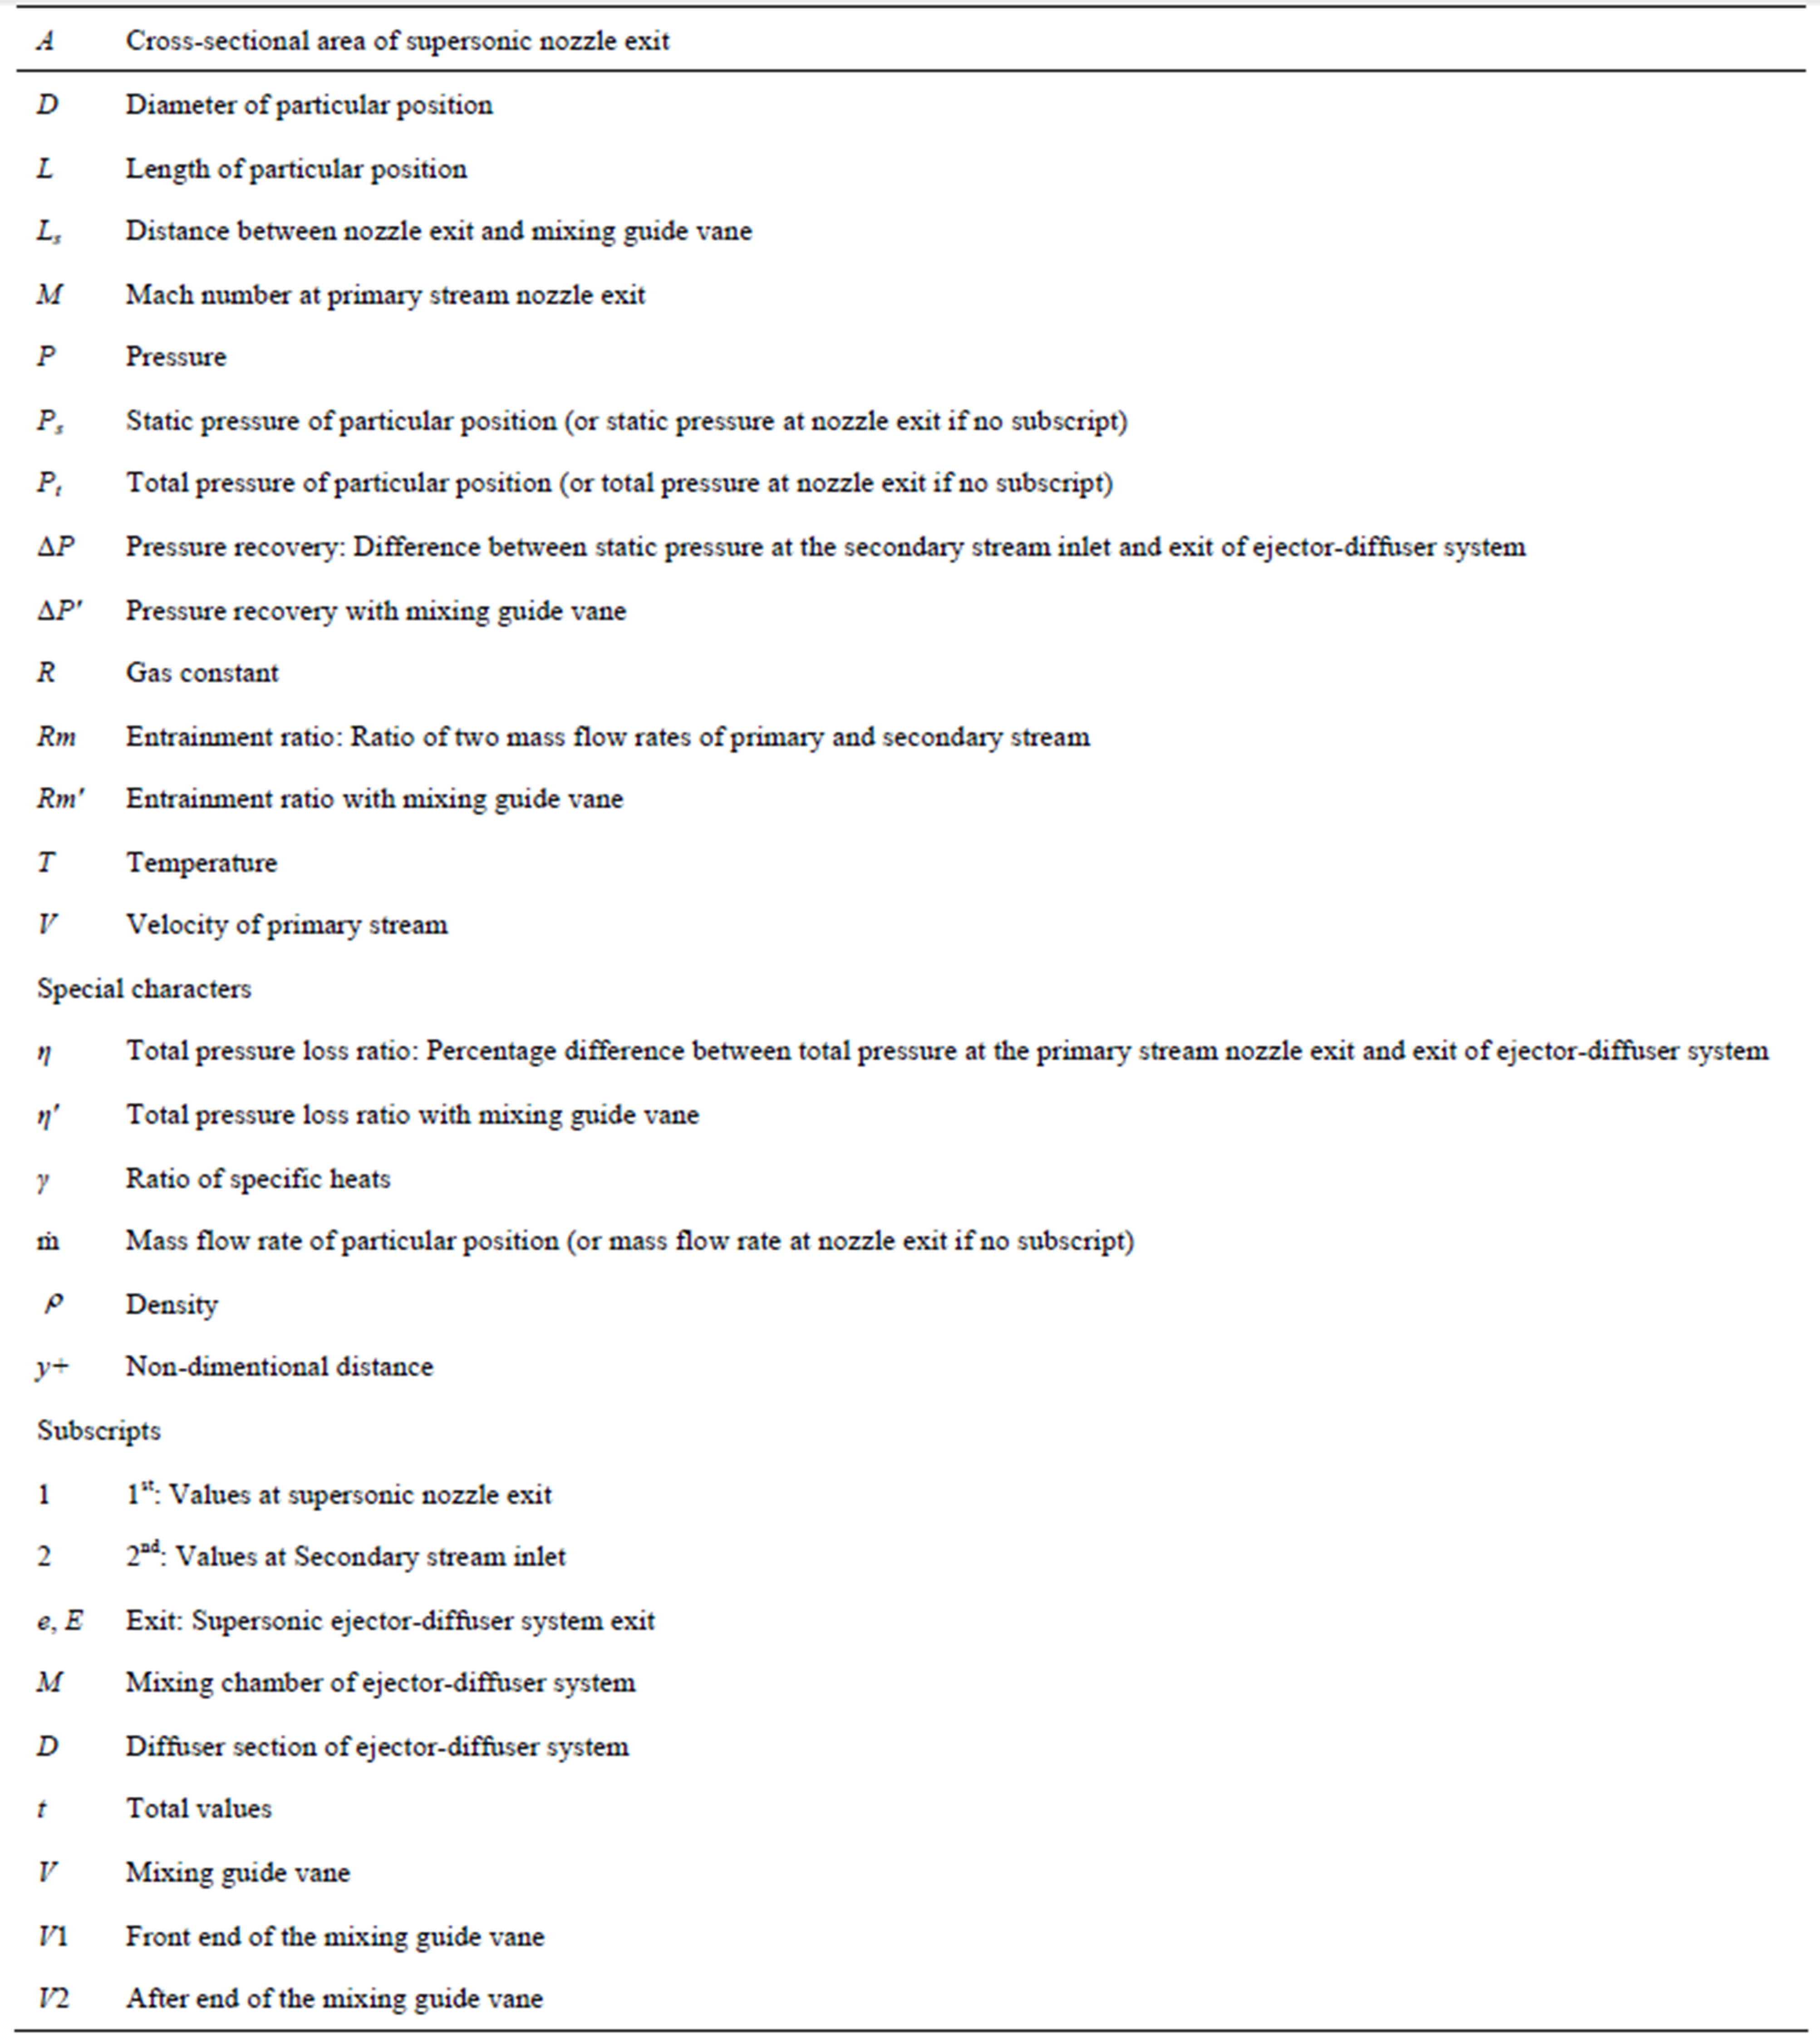
Nomenclature
NOTES
*Corresponding author.