Open Journal of Fluid Dynamics
Vol.2 No.2(2012), Article ID:20291,6 pages DOI:10.4236/ojfd.2012.22003
Effect of Liquid and Gas Velocities on Magnitude and Location of Maximum Erosion in U-Bend
Department of Computer Science, Engineering and Physics, University of Michigan-Flint, Flint, USA
Email: qmazumde@umflint.edu
Received March 21, 2012; revised May 2, 2012; accepted May 25, 2012
Keywords: U-Bend; Erosion; Multiphase Flow; Wear; CFD
ABSTRACT
Solid particle erosion is a micromechanical process that is influenced by flow geometry, material of the impacting surface, impact angle, particle size and shape, particle velocity, flow condition and fluid properties. Among the various factors, particle size and velocity have been considered to be the most important parameters that cause erosion. Particle size and velocity are influenced by surrounding flow velocities and carrying fluid properties. Higher erosion rates have been observed in gas-solid flow in geometries where the flow direction changes rapidly, such as elbows, tees, valves, etc, due to local turbulence and unsteady flow behaviors. This paper presents the results of a Computational fluid dynamic (CFD) simulation of dilute gas-solid flow through a U-Bend and the dynamics behavior of entrained solid particles in the flow. The effect of liquid and gas velocities on location of erosion were investigated for 50, 100, 150, 200, 250 and 300 microns sand particles. Three different fluid velocities of 15, 30.48 and 45 m/s were used in the CFD analysis. The magnitude and location of erosion presented in the paper can be used to determine the areas susceptible to maximum erosive wear in elbows and U-bends, along with corresponding rate of metal loss in these areas.
1. Introduction
Investigations of erosion require consideration of fluids, flow conditions, composition of the wall materials, characteristics of the system and temperature. Multiphase flows exhibit the additional challenge of requiring further phase composition parameters with their respective physical and modeling descriptors. Furthermore, conducting experiments in these complex conditions are extremely difficult to a point that may not be economically feasible. The contribution of Computational Fluid Dynamic (CFD) in simulating realistic flow patterns and in data reduction has been helpful in understanding flow phenomena.
Damage due to erosion has been observed in oil and gas pipe lines, aircraft, cyclone separators, boilers, fluidized beds, gas turbines and coal gasification processes. During the fluid flow, entrained sand particles are transported through the entire fluid handling system. Severe damage and component failures have been associated with material deterioration resulting from erosion due to impingement of these entrained solid particles. Erosion has been recognized as a leading factor in pipeline failures as it may cause hazardous spills and/or complete shutdown of systems. The result is equipment or system downtime causing significant economic impacts throughout the entire production and operation processes.
Solid particle (such as sand) erosion phenomena is complicated due to a wide range of factors that contribute to the erosion severity. These parameters include fluid flow rate, sand rate, properties of the fluid, properties of sand particles, wall material of equipment or fitting, and the characteristics of geometries such as size and shape. In order to combat the erosion caused by solid particles, a variety of erosion prediction methods have been developed. Most models are based on a limited amount of experimental data that limits their applicability to specific conditions. Due to the unavailability of an accurate and general erosion prediction model, “rule of thumb” design guidelines are adopted for many industrial practices, which usually lead to conservative and unrealistic designs. The most well-known guideline in the oil and gas industry is the American Petroleum Institute Recommended Practice 14E [1].
Generalized models such as computational fluid dynamic (CFD)-based erosion models take into account details of flow and pipe geometry, but require a significant computational effort to simulate the particles’ trajectories, impingement angles and speeds. A mechanistic model has been developed for predicting the maximum penetration rate in geometries, such as elbows and tees, which was based on a CFD-based erosion model [2]. The wall wears rates, obtained by gravimetric measurements, as a function of time have been used to describe erosion rates. Circumferential erosion penetration and mechanisms at discrete locations have been measured by surface profile geometry on replicas and scanning electron microscopy has been used after sectioning the pipe. The erosion rates and patterns are compared to those predicted by erosion models linked to computational models for the impact velocity and impact angle in bend and straight sections. The erosion rates, expressed as volume loss per impact (determined gravimetrically and via computer models) in bends agreed with simple laboratory-scale water-sand jet impingement tests on planar stainless steel samples. The pipe loss data alone represents a significant resource for future erosion researchers to reference.
A Computational Fluid Dynamic (CFD)-based erosion prediction model developed by Wang [3] showed lower erosion in long radius elbows with r/D > 1.5 (r is the turning radius of the centerline of the elbow and D is the inside diameter of the elbow). Field experience also showed long radius elbows and plugged Tees having lower erosion than the standard elbow with r/D = 1.5. A more generalized mechanistic model was developed to predict erosion in both single-phase and multiphase gasliquid flows with solid particles [2,4]. The model was based on erosion equations, numerical and experimental results, where particle impact velocity has been used as the highest contributing factor.
The particle impact velocity and corresponding impact angle are important factors in the erosive wear damage process. Impact tests performed using 250 microns fluidized bed material on 1018 carbon steel showed higher metal loss at shallower angles than the steep angles with maximum metal loss at 450 degrees impact angle [5]. CFD has been used by several investigators to predict erosion behavior at different flow conditions, different fluids, geometry and particles with good results showing promise for potential future use of computational methods for erosion study [6-8]. CFD can provide valuable insight into important characteristics of erosive wear behavior due to solid particle impact. Experimental investigation has been conducted to characterize the location and magnitude of erosion in an elbow specimen in single and multiphase flows, and at different fluid velocities to identify the location of maximum erosion. Experimental results showed different erosion behavior and location of maximum erosion in single and multiphase flows at 55 degrees from the inlet of the elbow for single phase gas at 15.24 and 34.1 m/s for both 150 and 300 microns sand sizes [9].
For fluid handling system designers and engineers, identification of the location of maximum erosion is as equally important as the magnitude of the erosion of the equipment for safe and reliable design. Improved reliability provides not only greater safety but also helps prevent unpredicted premature failure.
2. Present Work
Review of previous work in solid particle erosion of metallic and non-metallic surfaces was primarily focused on magnitude of damage in terms of mass loss from the target surface, volume loss, wall thickness loss and dimensionless erosion rate. Due to complexities associated with determining the location of maximum erosion, a limited number of studies have been reported in the literature. The currently available information is somewhat incomeplete, in spite of the strong desire of fluid handling equipment or systems designers for information about both magnitude and location of erosion for optimum component design. Therefore, the proposed study focuses on evaluating the magnitude of erosion as well as location of maximum damage caused by solid particle impact. With the advancement of computational fluid dynamics (CFD), erosive wear magnitude and location can be determined with reasonably good accuracy. The work presented in this paper was performed using CFD code Fluent to complement the experimental, numerical and theoretical approaches.
2.1. CFD Approach and Analysis
With the advancement of computational capabilities and the recent development of CFD codes, a full set of fluid dynamics and multiphase flow equations can be solved numerically. The current study used commercial CFD code, FLUENT [10] to solve the balance equation set via domain discretization, using a control volume approach. These equations are solved by converting the complex partial differential equations into simple algebraic equations. Three dimensional unstructured meshes were used in this study for the pipe and U-bend sections.
The Discrete Phase Model (DPM) was used that allows simulation of a discrete phase in a Lagrangian frame of reference in addition to solving transport equations for the continuous phase. The fluid phase is treated as a continuum by solving time averaged Navier-Stokes equations, while the discrete phase is solved by tracking the particles through the flow field. Solid particles of different sizes ranging from 50 to 300 microns were used as the discrete phase by including the couplings between the phases and the impact on both discrete and continuous phase trajectories. One of the fundamental assumptions used was that the discrete phase occupied a low volume fraction even though loading from the particles can be high. The particle trajectories were predicted by integrating the force balance on particles that equates the particle inertia with the force acting on the particle as [10]:
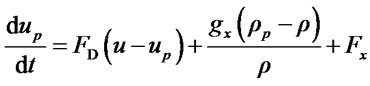 (1)
(1)
where  incorporates additional forces in the particle force balance that can be important under special circumstances. The first of these is the “virtual mass” force, the force required to accelerate the fluid surrounding the particle and
 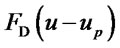 is the drag force per unit particle mass:
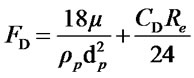 (2)
(2)
 , the drag coefficient is defined as [11]
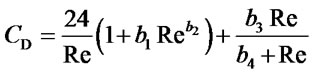 (3)
(3)
where


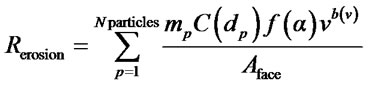
and  is a shape factor; the ratio of the surface area of a sphere having the same volume as the particle, and S is the actual surface area of the particle. The solid particle erosion rates at wall boundaries were determined by the following equation [12]:
 (4)
(4)
where  is a function of particle diameter, α is the impact angle of the particle path with the wall face, f(α) is a function of impact angle, v is the relative particle velocity, b(v) is a function of relative particle velocity, and
  is the area of the cell face at the wall. The default values of C = 1.8 E–9, f = 1 and b = 0.
Since C, f and b are defined as boundary conditions at the wall rather than properties of the material, the default values were not updated to reflect the material being used. Appropriate values of these functions were also specified for solid particles being used and the impacting surface material. The erosion rates were calculated in terms of removed material/(area-time) or kg/m2·s that was converted to other units for comparing with available literature or experimental erosion data.
2.2. Turbulence Model
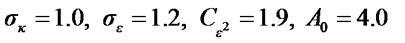
The Realizable κ-ε model was formulated [13] such that the calculated normal (diagonal) Reynolds stresses were positive definite and the shear (off-diagonal) Reynolds stresses satisfy the Schwarz inequality. In addition to altering the model constants, the two main modifications lie in replacing the constant Cµ used in calculating the eddy viscosity by a function, and in changing the righthand side (the production and destruction terms) of the ε equation:
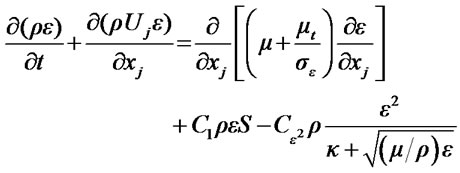 (5)
(5)
The model constants are
2.3. Geometry Detail
A U-Bend with 12.7 m pipe diameter, r/D = 1.5 was used with 50.8 mm of straight pipe sections upstream and downstream of the U-bend, as shown in Figure 1. The number of nodes was 17,127 with 48,376 faces and 15,680 cells based on mesh sensitivity analysis results of 17,127, 28,000, 63,000 and 118,000. The pressure drop and velocities with finer meshes were within 2% - 3%. As the flow field in the vicinity of the wall has steep velocity gradients; boundary-layer meshing scheme was used in the region proximate to the wall. Because the core of the turbulent pipe flow is reasonably uniform, the grid size in this region was relatively coarse. The meshed U-Bend is shown in Figure 2. For efficient discretization, the geometry of the flow domain was divided into three parts: upstream, downstream, and central parts consisting of the U-bend. A list of parameters used in the CFD analysis is presented in Table 1.
2.4. CFD Analysis Results
CFD analyses were performed for the conditions listed in Table 1 to determine the magnitude and location of maximum erosive wear damage of the U-Bend. Figure 3 shows
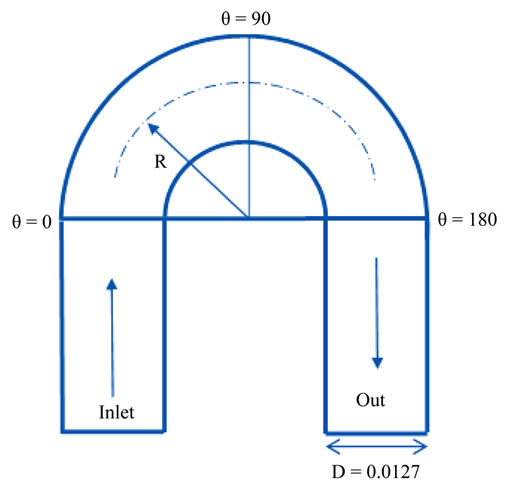
Figure 1. U-bend geometry.
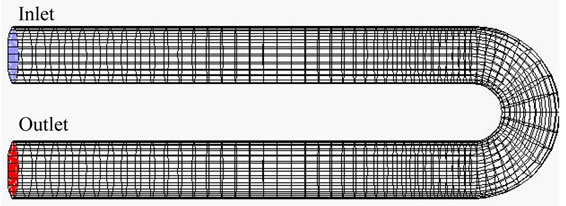
Figure 2. Meshed geometry with flow direction.
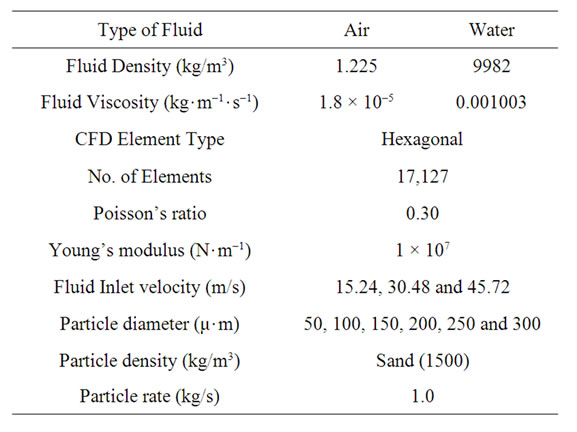
Table 1. Parameters used in CFD analysis.
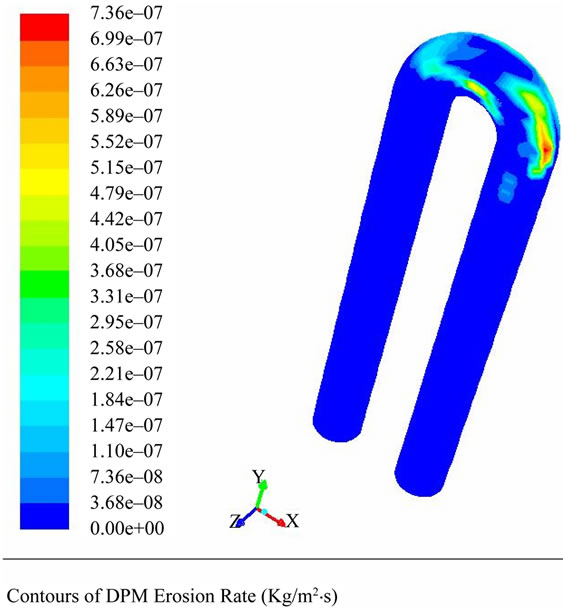
Figure 3. Location of maximum erosion in U-Bend (air 15.24 m/s and sand 50 microns).
a CFD output plot of erosion at 15.24 m/s air velocity and 50 microns particle size. The location of maximum erosion for this condition was at 182 degrees.
Figure 4 shows the distribution of DPM erosion rate (kg/m2·s) at different locations of the U-bend geometry

Figure 4. Erosion in U-Bend (Air: 30.48 m/s, 100 microns).
for 100 microns sand particles with 30.48 m/s air velocity. The location of maximum erosion for this condition was at 92 degrees from the inlet of the U-bend.
The effect of air and water at different particle sizes on location of maximum erosion is presented in Figure 5. For the smallest sand size of 50 microns maximum erosion location was at 60 degrees for water and at 180 degrees for air. The location of maximum erosion was similar for 200 microns sand size. As sand size increases, the location of maximum erosion was observed near the inlet for air; however, the location of maximum erosion moved away from the inlet of the elbow for water.
Figure 6 shows similar effects as Figure 4 for air and water at a higher velocity. At this velocity (45.72 m/s), the location of maximum erosion was similar for 100 microns sand size and as the sand size increases for air, erosion was near the inlet.
The effect of air velocity on the location of maximum erosion is presented in Figure 7. For all three air velocities, the location of maximum erosion was observed to be near the inlet as the sand sizes increase. For 30.48 and 45.72 m/s air velocities, the locations of maximum erosion were similar for different sand sizes.
The effect of water velocities on location of maximum erosion is presented in Figure 8. The characteristics of location of erosion for water are different than air as the location of erosion is away from the inlet with increased sand sizes. No significant difference in erosion location was observed for water velocities of 15.24, 30.48 and 45.72 m/s with different sand sizes except for 300 micron sand. With 300 microns sand, the location of erosion for 15.24 m/s velocity was at 160 degrees from the inlet compared to 90 degrees for 30.48 and 45.72 m/s.
3. Summary and Future Work
CFD-based erosion prediction for U-Bend geometry of 0.0127 meters diameter is presented in this paper. CFD simulation was performed using a comprehensive procedure that included: flow simulation, particle tracking and erosion calculation. Three different air and water velocities with six different sand sizes ranging from 50 - 300
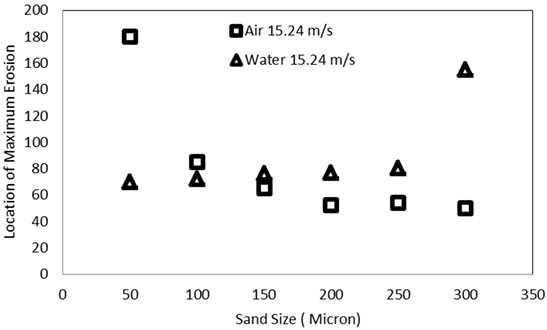
Figure 5. Effect of fluid and particle size on location of maximum erosion at 15.24 m/s.
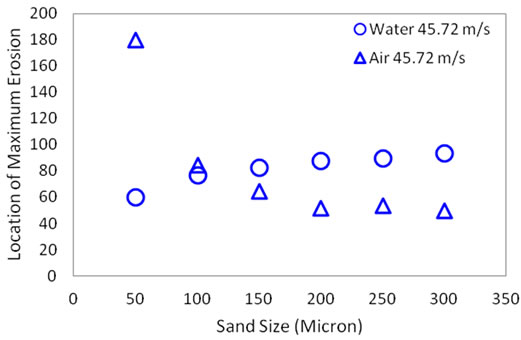
Figure 6. Effect of fluid and particle size on location of maximum erosion.

Figure 7. Effect of air velocity and particle size on location of maximum erosion.

Figure 8. Effect of water velocity and particle size on location of maximum erosion.
microns were used in the simulation. Due to lack of available experimental and simulation results for the U-bend geometry, validation of the CFD simulation results was not performed. A test section has been designed and is being fabricated to conduct experiments for validation of the CFD results presented in this paper. The experiments will be conducted in the near future and will be presented. Although experimental validation was not presented, CFD simulation results presented in this paper will shed some light on the relative magnitude and location of erosion in U-Bend geometry.
REFERENCES
- American Petroleum Institute, “API Recommended Practice for Design and Installation of Offshore Production Platform Piping Systems,” 5th Edition, American Petroleum Institute, Washington DC, 1991.
- Q. H. Mazumder, S. A. Shirazi and B. McLaury, “Prediction of Solid Particle Erosive Wear of Elbows in Multiphase Annular Flow-Model Development and Experimental Validations,” Journal of Energy Resources and Technology, Vol. 130, No. 2, 2008, pp. 1-10.
- J. R. Wang and S. A. Shirazi, “A CFD Based Correlation for Erosion Factor for Long-Radius Elbows and Bends,” Journal of Energy Resources Technology, Vol. 125, No. 1, 2003, pp. 26-31. doi:10.1115/1.1514674
- Q. H. Mazumder, “Prediction of Erosion Due to Solid Particle Impact in Single-Phase and Multiphase Flows,” Journal of Pressure Vessel and Technology, Vol. 129, No. 4, 2007, pp. 576-582. doi:10.1115/1.2767336
- A. V. Levy, “Solid Particle Erosion and Erosion-Corrosion of Materials,” ASM International, Material Park, 1995.
- B. Bozzini, M. E. Ricotti, M. Boniardi and C. Mele, “Evaluation of Erosion-Corrosion in Multiphase Flow via CFD and Experimental Analysis,” Wear, Vol. 255, No. 1- 6, 2003, pp. 237-245. doi:10.1016/S0043-1648(03)00181-9
- J. R. Fan, J. Yao, X. Y. Zhang and K. F. Cen, “Experimental and Numerical Investigation of a New Method for Protecting Bends from Erosion in Gas-Particle Flow”, Wear, Vol. 251, No. 1-12, 2001, pp. 853-860.
- A. Keating and S. Nesic, “Particle Tracking and Erosion Prediction in Three-Dimensional Bends,” ASME Fluid Engineering Division Summer Meeting, Boston, 11-15 June 2000, Article ID: FEDSM2000-11249.
- Q. H. Mazumder, S. A. Shirazi and B. McLaury, “Experimental Investigation of the Location of Maximum Erosive Wear Damage in Elbows,” Journal of Pressure Vessel Technology, Vol. 130, No. 1, 2008, 7 p. doi:10.1115/1.2826426
- Fluent I, “Fluent 6.3 User Guide,” Fluent Inc., Lebanon, 2002.
- S. A. Morsi and A. J. Alexander, “An Investigation of Particle Trajectories in Two-Phase Flow Systems,” Journal of Fluid Mechanics, Vol. 55, No. 2, 1972, pp. 193- 208. doi:10.1017/S0022112072001806
- J. K. Edwards, “Development, Validation, and Application of a Three Dimension, CFD-Based Erosion Prediction Procedure,” Ph.D. Thesis, The University of Tulsa, Tulsa, 2000.
- T. H. Shih, W. W. Liou, A. Shabbir, Z. D. Yang and J. Zhu, “A New κ-ε Eddy Viscosity Model for High Reynolds Number Turbulent Flows,” Computers & Fluids, Vol. 24, No. 3, 1995, pp. 227-238.