Open Journal of Veterinary Medicine
Vol.4 No.6(2014), Article
ID:46600,9
pages
DOI:10.4236/ojvm.2014.46013
Comparative Evaluation of the Effects of Velogenic Newcastle Disease Virus Infection on the Hematology of Ducks and Chickens
Chekwube Paul Eze1, John Osita Arinze Okoye1, Innocent Okonkwo Ogbonna2, Wilfred Sunday Ezema1, Didacus Chukwuemeka Eze1, Emmanuel Chukwudi Okwor1, Christian Okorie-Kanu3, Kalu Idika Idika4
1Department of Veterinary Pathology and Microbiology, University of Nigeria, Nsukka, Nigeria
2Microbiology Unit, Department of Biological Sciences, University of Agriculture, Makurdi, Nigeria
3Department of Veterinary Pathology and Microbiology, University of Agriculture, Umudike, Nigeria
4Department of Veterinary Parasitology and Entomology, University of Nigeria, Nsukka, Nigeria
Email: chekwus2009@yahoo.com, joaokoye@yahoo.com, innocentia09@yahoo.com, wsezema@yahoo.com, eldidacuscj@yahoo.com, rcokoriekanu@yahoo.co.uk, infoidika@yahoo.com
Copyright © 2014 by authors and Scientific Research Publishing Inc.
This work is licensed under the Creative Commons Attribution International License (CC BY).
http://creativecommons.org/licenses/by/4.0/


Received 1 January 2014; revised 4 February 2014; accepted 14 February 2014
ABSTRACT
The hematological lesions consequent upon velogenic Newcastle disease virus (NDV) infection were investigated in 6-week-old ducks and chickens. Following intramuscular inoculation, the results indicated significantly lower (p < 0.05) packed cell volume (PCV) in infected chickens (IC) on days 3 - 9 post inoculation (PI) and in infected ducks (ID) on days 3 - 15 PI. The hemoglobin concentrations were significantly lower (p < 0.05) in IC on days 3, 6 and 15 PI while in the ID, they were significantly lower (p < 0.05) on days 3, 9 and 15 PI. The total erythrocyte counts were significantly lower (p < 0.05) in IC on days 3, 9 and 15 PI and in ID, they were significantly lower (p < 0.05) on days 3 and 9 PI. The mean corpuscular values indicated macrocytic hypochromic anemia in IC and macrocytic normochromic anemia in ID. The leucogram showed leucopenia in IC and initial leucopenia followed by leucocytosis in ID. The hematological pictures of the velogenic NDV in this experiment indicate less susceptibility of ducks when compared with the chickens. The severity of this virus infection in chickens and the mild clinical signs and lesions presented by ducks showed that ducks are far less susceptible than chickens.
Keywords:Velogenic Newcastle Disease, Experimental Infection, Hematology, Ducks, Chickens

1. Introduction
Newcastle disease (ND) is a highly contagious and infectious disease that affects almost all avian species including poultry, cage and wild life bird species [1] -[3] . It is widespread affecting many continents of the world namely; Asia, Africa, and America [4] and causes considerable economic losses, not only due to high flock mortality but also through the economic impact that may arise from trade restrictions and embargoes [5] [6] . It has been reported to affect other birds such as guinea fowls, quails, turkeys, pheasants and peacock [1] [6] . Mortality due to ND ranges from negligible to as high as 100% depending on the form or pathogenicity of the virus [1] .
Kudu 113, a strain of NDV isolated from apparently healthy ducks and characterized by Echeonwu et al. [7] in Nigeria, has been studied in chickens and guinea fowls [6] [8] . This strain is frequently seen in outbreaks in Nigeria [9] . Ducks and other anseriformes are suspected to have maintained the endemicity of the disease around the world [4] [10] [11] . Scanty information is available on the basic performance of ducks in Nigeria [12] [13] . There is also a paucity of information on the effects of vNDV infection on the hematology of ducks and chickens. In this article, the comparative evaluation of the effects of vNDV infection on the hematology of ducks and chickens was done.
2. Materials and Methods
2.1. Flock History
One hundred and seventy day old birds hatched the same day were obtained comprising 70 ducklings from poultry section of National Veterinary Research Institute (NVRI) Vom and 100 cockerel chicks from Zartech Hatchery. Brooding was done separately for the chicks and ducklings on deep litters under the same environmental condition. The cockerel received IBD vaccine by intraocular route at days 10 and 24 post hatch (PH). Chicks’ mash was given ad libitum to the birds from day old to 8 weeks post hatch (PH). Growers’ mash was given ad libitum also from 9 weeks PH until the end of the experiment and water was allowed free choice.
2.2. The NDV Inoculum
The vNDV strain, Kudu-113 isolated from the cloacal swab of an apparently healthy ducks in Kuru, Plateau State, biologically characterized by Echeonwu et al. [7] was used in the challenge experiment.
2.3. Experimental NDV Challenge
At six weeks of age, the chicks and ducklings were each randomly assigned into two groups of infected chicks (IC), uninfected chicks (UC) and infected ducks (ID), uninfected ducks (UD). The inoculum was reconstituted to give embryo lethal dose (ELD50) titre of 106.36 per ml. The chicks and ducks in infected groups were inoculated intramuscularly (IM) with 0.2 ml of the inoculum (infected groups). The chicks and ducks in uninfected groups received 0.2 ml of PBS IM (control groups). The infected and control groups were housed at different locations and maintained on deep litter system.
2.4. Hematology
At days 3, 6, 9, 12, 15 and 21 PI, six birds from each group were randomly selected and phlebotomy was done, through the wing vein, using sterile syringe. 3 ml of blood was collected in EDTA impregnated sample bottles for hematology.
2.4.1. Packed Cell Volume (PCV)
The PCV was determined by the haematocrit method [14] , using micro capillary tubes, micro haematocrit centrifuge and reader (Hawskey®, England). The PCV values were determined using the reader and recorded.
2.4.2. Hemoglobin Concentration (HbC)
The hemoglobin concentration (HbC) was determined by the cyanomethemoglobin method [15] . Twenty microliter of the blood sample was added to 5 ml of Drabkins hemoglobin reagent in a clean test tube and allowed to react for 20 minutes. The absorbance of the mixture was read at 540ηm wavelength against the blank reagent using a spectrophotometer. Standards were prepared, using rat blood and the wavelength determined. The HbC was calculated by multiplying the spectrophotometer reading with a calibrating factor (14.5) obtained from the absorbance and concentration of the standards.
HbC = K × Sample reading/Rat standard reading; where K is a constant (14.5).
2.4.3. Total Erythrocyte Count (TEC)
The red blood cell count (RBC) was obtained by the hemocytometer method [16] , using an improved Neubauer counting chamber (NCC) (Hawskey, England) and avian RBC diluting fluid [14] .
2.4.4. Mean Corpuscular Volume (MCV)
The results of the TEC, and PCV were used to calculate the average erythrocyte and its hemoglobin concentration, using the formula;
MCV (fL) = PCV × 10/TEC. It was used in the definition of morphologic characteristic of RBC [17] .
2.4.5. Mean Corpuscular Hemoglobin (MCH)
The results of the TEC and HbC were used to calculate the average corpuscular hemoglobin, using the formula; MCH (pg) = HbC × 10/TEC [17] .
2.4.6. Mean Corpuscular Hemoglobin Concentration (MCHC)
The results of the PCV and HbC were used to calculate the average corpuscular hemoglobin concentration, using the formula;
MCHC (g/dL) = HbC × 100/PCV [17] .
2.4.7. Total Leucocyte Count (TLC)
The TLC was done by the hemocytometer method [16] , using an improved Neubauer counting chamber (Hawskey, England) and avian white blood cell diluting fluid [14] composed of aqueous phloxine, propylene, glycol, and sodium carbamate.
2.4.8. Differential Leukocyte Counts (DLC)
The DLC was done using Leishman technique [14] . The total of 100 cells was counted, by means of DLC tally counter and the number recorded. The results of each cell type were expressed as a percentage of the TLC and converted to absolute values.
2.5. Data Analysis
The hematological values between and within groups were subjected to statistical analysis using independent sample t-test and the level of significance was determined and accepted at p ≤ 0.05 for all the results using statistical products for service and solution (SPSS) version 16.0 computer software. The mean ± standard error of mean (SEM) of the results obtained in the experiment were calculated and presented in tables and graphs.
3. Results
The results of the PCV are shown in Table 1. The haematocrit values in the infected chickens were significantly lower (p < 0.05) than those of the control on days 3 to 9 PI, whereas in the infected ducks, they were significantly lower (p < 0.05) than those of the control ducks on days 3 to 15 PI.
The results of the HbC are shown in Table 2. The infected chickens recorded significantly lower (p < 0.05) values than the control on days 3 - 15 PI while in the infected ducks, they were significantly lower (p < 0.05) than those of the control on days 3 and 9 to 15 PI. The results of the TEC are shown in Table 3. The infected chickens had significantly lower TEC (p < 0.05) than the control group on days 3, 9 - 15 PI. In the infected ducks the TEC were significantly lower (p < 0.05) than the control group on days 3 - 12 PI.
The results of the MCV are shown in Table 4. The MCV of the infected chickens were significantly higher (p < 0.05) on days 3 and 9 - 15 PI, whereas the infected ducks recorded significantly higher (p < 0.05) values than the control on days 3 and 9 PI.
The results of the MCH are shown in Table 5. The infected chickens had significantly lower MCH (p < 0.05) on day 6 PI whereas, on day 9 PI, the infected chickens presented significantly higher (p < 0.05) values than in

Table 1. Results of mean packed cell volume ± SEM (%).
NB* Means values significantly different at p < 0.05, Normal PCV range for birds (30.0 - 55.0).
Table 2. Results of mean hemoglobin concentration ± SEM (g/dL).
NB* Means values significantly different at p < 0.05, Normal HbC range for birds (8.0 - 13.0).
Table 3. Results of mean total erythrocyte counts (TEC) ± SEM (×106/µL).
| Days | IC | UC | ID | UD |
| 0 | 3.21 ± 0.32 | 3.21 ± 0.32 | 2.94 ± 0.21 | 2.94 ± 0.21 |
| 3 | 1.63 ± 0.03* | 2.99 ± 0.04 | 1.90 ± 0.03* | 3.19 ± 0.30 |
| 6 | 3.17 ± 0.40 | 3.07 ± 0.22 | 2.42 ± 0.12* | 2.88 ± 0.14 |
| 9 | 1.70 ± 0.09* | 2.88 ± 0.94 | 3.06 ± 0.13* | 4.45 ± 0.08 |
| 12 | 1.97 ± 0.10* | 2.84 ± 0.13 | 3.35 ± 0.09* | 3.71 ± 0.15 |
| 15 | 1.93 ± 0.08* | 2.89 ± 0.05 | 3.63 ± 0.16 | 3.41 ± 0.10 |
| 21 | 2.71 ± 0.07 | 2.82 ± 0.09 | 3.32 ± 0.80 | 3.01 ± 0.38 |
NB* Means values significantly different at p < 0.05, Normal TEC range for birds (2.8 - 4.5).
Table 4. Results of mean corpuscular volume ± SEM (fL).
| Days | IC | UC | ID | UD |
| 0 | 093.99 ± 11.18 | 093.99 ± 11.18 | 126.97 ± 06.02 | 126.97 ± 06.02 |
| 3 | 183.82 ± 15.39* | 111.44 ± 13.62 | 177.21 ± 07.73* | 130.63 ± 03.19 |
| 6 | 098.83 ± 11.98 | 111.30 ± 08.03 | 141.20 ± 11.45 | 131.35 ± 07.03 |
| 9 | 156.67 ± 03.09* | 111.70 ± 12.76 | 105.13 ± 05.52* | 079.78 ± 03.02 |
| 12 | 148.33 ± 08.71* | 107.39 ± 07.64 | 096.03 ± 04.01 | 106.93 ± 04.15 |
| 15 | 155.33 ± 07.39* | 108.41 ± 04.40 | 096.42 ± 03.89 | 109.09 ± 08.01 |
| 21 | 117.83 ± 13.10 | 111.70 ± 03.25 | 118.91 ± 06.88 | 098.61 ± 04.94 |
NB* Means values significantly different at p < 0.05, Normal MCV range for birds (100 - 130).
the control. On the other hand, the infected ducks recorded significantly higher (p < 0.05) values than the control on days 3, 9 and 21 PI and significantly lower (p < 0.05) values than the control from days 12 - 15 PI.
The results of the MCHC are shown in Table 6. The infected chickens presented lower significant (p < 0.05) values on days 6, 12 and 15 PI. In the infected ducks, the MCHC were significantly lower (p < 0.05) than the control only on day 12 PI.
The results of TLC are presented in Figure 1. The infected chickens had significantly lower TLC (p > 0.05) Table 5. Results of mean corpuscular hemoglobin ± SEM (pg). NB* Means values significantly different at p < 0.05, Normal MCH range for birds (28.57 - 46.43). Table 6. Results of mean corpuscular hemoglobin concentration ± SEM (g/L). NB* Means values significantly different at p < 0.05, Normal MCHC (26.70 - 33.47). Figure 1. Results of total leukocyte counts ± SEM (103/µL). than the control from days 6 - 21 PI, while the TLC of the infected ducks presented significantly lower (p < 0.05) values than the control only on day 3 PI, but significantly higher (p < 0.05) values than the control on days 9 - 21 PI. The average differential leukocyte counts (DLC) results are shown in Table 7. There was significantly lower (p < 0.05) heterophil counts in infected chickens than the control from days 3 PI and consistently up till day 21 PI, whereas the infected ducks had significantly higher (p < 0.05) heterophil counts than the control on days 3 - 9 PI. By the day 12 the value was significantly lower (p < 0.05) than the control, but later increased significantly higher (p < 0.05) than the control group at day 21 PI (Table 7). The lymphocyte counts were significantly lower (p < 0.05) in infected chickens than the control on days 6 and consistently remained lower up till 21 PI ( Table 7). Table 7. Average absolute differential leukocyte counts in chickens and ducks (Mean ± SEM/µL). H = Heterophil, L = Lymphocyte, M = Monocyte E = Eosinophil and B = Basophil, *Means values significantly different at p < 0.05. In the infected ducks, the lymphocyte counts presented significantly lower (p < 0.05) values than the control only on day 3 PI and consistently recorded higher significant (p < 0.05) values than the control from days 6 to 21 PI (Table 7). The monocyte counts in infected chickens were significantly higher (p < 0.05) than the control only on day 3 PI, but consistently showed significantly lower (p < 0.05) values in infected than the control from days 6 to 15 PI (Table 7). In the infected ducks, there were bouts of monocytosis. The monocyte counts were significantly higher (p < 0.05) than the control from days 3 to 9 PI and 21 PI, but had significantly lower (p < 0.05) values than the control on days 12 and 15 PI (Table 7). The basophil and eosinophil counts were not consistent for both infected and control chickens and ducks (Table 7). 4. Discussion The erythrocyte response in the chickens and ducks had varying patterns in this study, even though there was significant depression of TEC, PCV and HbC in both infected chickens and duck when compared with the controls indicating anemia [18] . Blood samples were not collected from moribund birds to forestall polycythemia attributable to hemo-concentration occasioned by reduced water intake and the associated dehydration [19] . However, the values in infected ducks were within the reference normal range for birds in our teaching hospital. The severe anemia observed in the infected chickens may likely be due to possible intravascular hemolysis and blood loss usually seen in form of proventricular hemorrhages and GI ulcers in VND [20]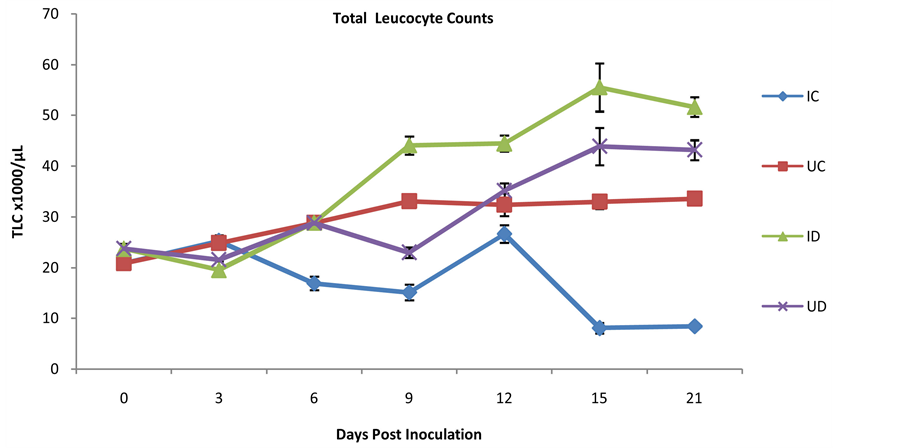
The variations in WBC—leukocytopenia in chickens and leucocytosis in ducks—may be due to heteropenia, lymphopenia and monocytopenia, and heterophilia, lymphocytosis and monocytosis respectively, demonstrating the marked depression and elevation reactions of the white corpuscles of chickens and ducks during ND respectively [14] . The lymphopenia recorded in chicken may be associated with depletion of lymphocytes in the bursa of Fabricus, spleen and thymus as reported by Ezema et al. [24] . Monocytopenia is a form of leukopenia associated with a deficiency of monocytes and which may be caused by acute infections, and other numerous disease syndromes [25] . The monocytes in the blood are in transit between the marrow and tissues, where they are transformed into tissue macrophages [26] . They participate virtually in all inflammatory and immune disorders such as severe viral and bacterial infections for mopping up of necrotic debris [27] .
The leukocytic alterations recorded in this study indicate that vND exert marked depression on leucogram in chickens, as reported by Calderon et al. [20] . The bone marrow may have responded to tissue damage with initial leukocytosis and heterophilia but later depressed to heteropenia as observed in this study. Heterophilia and concurrent lymphopenia are observed in viral disease of birds [28] and lymphopenia of acute infection may have complex mechanisms which include endogenous corticosterone release with temporary lymphocyte redistribution, and trapping of circulating lymphocytes within lymphoid tissue, especially, during viral infection [29] . A sequential study in chickens after vND was made by Harrison et al. [25] who detected that the virus induced programmed cell death principally in mononuclear cells—macrophages and lymphocytes. Lymphopenia is common in acute inflammatory responses, because inflammatory mediators stimulate the diapedetic migration of heterophils and lymphocytes from the blood and lymphoid tissues to the points of inflammation where they are eventually destroyed [28] . This may account for the immunosuppression previously reported in vND in chickens [24] . The monocytosis and then monocytopenia in the infected chicken and monocytosis in duck may be related to the transit period of monocytes from bone marrow to the tissues as macrophages [27] and the variations between the 2 species may be related to the extent of tissue damage [27] . Eosinophil, and basophil absolute values in both infected birds, in this study, showed no consistent and relevant changes. This is in line with previous report by Calderon et al. [20] and the basic functions of eosinophils and basophils are in parasitic infections and hypersensitivity reactions respectively [30] .
Generally, the hematology in this study showed the leucogram common in the VNDV challenged chickens and ducks as leukocytopenia and leucocytosis respectively. This may be the cause of variations in the severity of the disease in both species.
References
- Alexander, D.J. and Gough, R.E. (2003) Newcastle Disease and Other Avian Paramyxovirus Infections. In: Saif, Y.M., Barnes, H.J., Glisson, J.R., Fadly, A.M., McDougal, L.R. and Swayne, D.E., Eds., Disease of Poultry, 11th Edition, Iowa State University Press, Ames, 1A, 63-87.
- Terregino, C., Cattoli, G., Grossele, B., Bertoli, E., Tisato, E. and Capua, I. (2003) Characterization of Newcastle Disease Virus Isolates Obtained from Eurasian Collared Doves (Streptopelia decaocto) in Italy. Avian Pathology, 32, 63-68. http://dx.doi.org/10.1080/0307 945021000070732
- Vidanovic, D., Sekler, M., Asanin, R., Milic, N., Nisavic, J., Petrovic, T. and Savic, V. (2011) Characterization of Ve-logenic Newcastle Disease Viruses Isolated from Dead Wild Birds in Serbia during 2007. Journal of Wildlife Diseases, 47, 433-444. http://dx.doi.org/10.7589/0090-3558-47.2.433
- Office International des Epizooties (OIE) (2009) Manual of Diagnostic Tests and Vaccines for Terrestial Animals. Newcastle Disease. OIE Standard Commission Publication, Office International Epizooties, 2009 Version, Part 2, Section 2.1, Chapter 2.3.14., 576-589.
- Leslie, J. (2000) Newcastle Disease: Outbreak Losses and Control Policy Costs. Veterinary Record (Journal of British Veterinary Association), 146, 603-606. http://dx.doi.org/10.1136/vr.146.21.603
- Igwe, A.O., Ezema, W.S., Ibu, J.I., Eze, J.I. and Okoye, J.O.A. (2013) Comparative Study of the Haematology and Persistence of Velogenic Newcastle Diseases in Chickens and Guinea Fowls. Research Opinion in Animal and Veteri-nary Sciences, 3, 136-142. http://www.roavs.com/pdf-files/Issue-5-2013/136-14...
- Echeonwu, G.O.N., Ireogbu, C.U. and Emeruwa, A.C. (1993) Recovery of Velogenic Newcastle Disease Virus from Dead and Healthy Free Roaming Birds in Nigeria. Avian Pathology, 22, 383-387. http://dx.doi.org/10.1080/03079459308418928
- Okoye, J.O.A., Agu, A.O., Chineme, C.N. and Echeonwu, G.O.N. (2000) Pathological Characterization in Chicken of a Velogenic Newcastle Disease Virus Isolate from Guinea Fowl. Revue d’élevage et de Médecine Vétérinaire des pays Tropicaux, 53, 325-330.
- Ibu, O.J., Okoye, O.A., Adulugba, E.P., Chah, K.F., Shoyinka, S.V.O., Salihu, E., Chukwuedo, A.A. and Baba, S.S. (2009) Prevalence of Newcastle Disease Viruses in Wild and Captive Birds in Central Nigeria. International Journal of Poultry Science, 8, 574-578.
http://dx.doi.org/10.3923/ijps.2009.574.578 - Ikani, E.I. (2001) Duck Production in Nigeria (Extension Bulletin no 133) Poultry Series no 7. (National Agricultural Extension and Research Liaison Services). Ahmadu Bello University, Zaria, 1-32.
- Sa’idu, L., Abdu, P.A., Tekdek, L.B., Umoh, J.U., Usman, M. and Oladele, S.B. (2006) Newcastle Disease in Nigeria. Nigerian Veterinary Journal, 2, 23-32.
- Okeude, N.J., Okoli, I.C. and Igwe, G.O.F. (2003) Hematological Characteristics of Ducks (Cairina moschata) of South Eastern Nigeria. Tropicultura, 21, 61-65.
- Alfred, S.D.Y. and Agbede, J.O. (2012) Influencing Factors of Duck Production in the Southwest of Nigeria. African Journal of Agricultural Research, 7, 3498-3505.
- Coles, E.H. (1986) Veterinary Clinical Pathology. 4th Edition, W.B. Saunders Company, Philadelphia, 17-19.
- Kachmar, J.F. (1970) Determination of Blood Hemoglobin by the Cyanomethaemoglobin Procedure. In: Tietz, N.W., Ed., Fundamentals of Clinical Chemistry, W S Saunders Company, Philadelphia, 268-269.
- Schalm, O.M., Jain, N.C. and Carrol, E.J. (1975) Veterinary Hematology. 3rd Edition, Lea and Fabingers, Philadelphia.
- Jain, N.C. (1993) Essentials of Veterinary Hematology. Lea and Febringers, Philadelphia, 365-372.
- Velguth, K.E., Payton, M.E. and Hoover, J.P. (2010) Relationship of Hemoglobin Concentration to Packed Cell Volume in Avian Blood Samples. Journal of Avian Medicine and Surgery, 24, 115-121. http://dx.doi.org/10.1647/2008-042.1
- Ihedioha, J.I. and Chineme, C.N. (2005) Fundamental of Systemic Veterinary Pathology, Volume 2, Great A P Express.
- Calderon, N.L., Galindo-Muňiz, F., Ortiz, M., Lomniczi, B., Fehervari, T. and Paasch, L.H. (2005) Thrombocytopenia in Newcastle Disease: Haematological Evaluation and Histological Study of Bone Marrow. Acta Veterinaria Hungarica, 53, 507-513. http://dx.doi.org/10.1556/AVet.53.2005.4.11
- Campbell, T.W. (2004) Clinical Chemistry of Birds. In: Thrall, M.A., Ed., Veterinary Hematology and Clinical Chemistry, Lippincott Williams and Wilkins, Philadelphia, 479-492.
- Vajpayee, N., Graham, S.S. and Bem, S. (2007) Basic Examination of Blood and Bone Marrow. In: McPherson, R.A. and Pincus, M.R., Eds., Henry’s Clinical Diagnosis and Management by Laboratory Methods, 22nd Edition, Elsevi-er/Saunders, Philadelphia, 30.
- Elghetany, M.T. and Banki, K. (2011) Erythrocytic Disorders. In: McPherson, R.A. and Pincus, M.R., Eds., Henry’s Clinical Diagnosis and Management by Laboratory Methods, 22nd Edition, Elsevier/Saunders, Philadelphia, 32. http://dx.doi.org/10.1016/B978-1-4377-0974-2.00032-4
- Ezema, W.S., Okoye, J.O.A. and Nwanta, J.A. (2009) LaSota Vaccination May Not Protect against the Lesions of Velogenic Newcastle Disease in Chicken. Tropical Animal Health and Production, 41, 477-484. http://dx.doi.org/10.1007/s11250-008-9210-x
- Harrison, L., Brown, C., Afonso, C., Zhang, J. and Susta, L. (2011) Early Occurrence of Apoptosis in Lymphoid Tissues from Chickens Infected with Strains of Newcastle Disease Virus of Varying Virulence. Journal of Comparative Pathology, 145, 327-335.
http://dx.doi.org/10.1016/j.jcpa.2011.03.005 - Grogan, K.B., Fernandez, R.J., Barranon, R.F.J. and Espinosa, H.G. (2008) Avian Immune System: A Brief Review. Merial Select, Gainesville, 1-12.
- Thomson, R.G. (1984) General Veterinary Pathology.
- Ng, W.L., Chu, C.M., Wu, A.K.L., Cheng, V.C.C. and Yuen, K.Y. (2005) Lymphopenia at Presentation Is Associated with Increased Risk of Infections in Patients with Systemic Lupus Erythematosus. Quarterly Journal of Medicine, 99, 37-47. http://dx.doi.org/10.1093/qjmed/hci155
- Schmidt, E.M.S., Paulill, A.C., Caron, L.F., Filho, T.F., Augustini, M., Ventura, H.L.B. and Locatelli-Dittrich, R. (2008) Evaluation of Experimental Vaccination against Newcastle Disease and the Blood Proteinogram in Ring-Necked Pheasants (Phasiannus coichicus) during Breeding Season. International Journal of Poultry Science, 7, 661-664. http://dx.doi.org/10.3923/ijps.2008.661.664
- McGavin, M.D. and Zachary, J.F. (2006) Pathologic Basis of Veterinary Disease. 4th Edition, Chapter 8, Elsevier, Mosby.