Open Journal of Veterinary Medicine
Vol.3 No.1(2013), Article ID:28829,5 pages DOI:10.4236/ojvm.2013.31001
Computed Tomographic Assessment of Body Fat in Dachshunds: A Pilot Study
1Department of Clinical Sciences, College of Veterinary Medicine, Mississippi State University, Mississippi, USA
2Experimental Statistics, Mississippi Agricultural and Forestry Experiment Station, Mississippi, USA
Email: *wardlaw@cvm.msstate.edu
Received November 14, 2012; revised December 14, 2012; accepted December 26, 2012
Keywords: Computed Tomography; Body Fat; Dachshund
ABSTRACT
Obesity has not been linked to causing intervertebral disc degeneration, but has been shown to influence time to ambulation, a strong long-term prognostic indicator in dogs with intervertebral disc disease. However, monitoring obesity to date is imprecise and subjective in the clinical setting. Having an objective formula based on morphometric measurements would potentially be more precise to track our patients’ weights. Dogs have been shown to gain weight along their lumbar spine more rapidly than other areas. Varying body conformations make extrapolation from nonchondrodystrophic dogs to Dachshunds difficult. This study aimed to establish the region of fat accumulation along the thoracolumbar spine in Dachshunds. Retrospective computed tomographic (CT) analysis was performed on healthy Dachshunds that presented for intervertebral disc disease (IVDD). Fat area measured at L3 and L5 using attenuation ranges −135/−105 Hounsfield units (HU) was the most dependent on body weight (p = 0.05). There appeared to be no difference between subcutaneous, visceral or total percent body fat with weight agreement. T13, L3 and L5 all had linear relationships with patient weight and will likely be helpful for body mass index (BMI) formula creation (p < 0.01). This study indicates that any consistent location between L3 and L5 will give an accurate representation of the abdominal circumference and most obese area of the Dachshund with the umbilicus used as a landmark.
1. Introduction
Obesity is the most common nutritional disorder in companion animals. Current estimates indicate 25% - 40% of pets in the United States are overweight [1,2]. Specifically, 40% of dogs, ages 6 to 10 years, are overweight or obese [3]. Generally speaking, overweight is considered 5% - 19% above ideal body weight and more than 20% is considered obese [4].
Dachshunds are a chondrodystrophic breed with a specifically unique body conformation. This breed is at extreme risk for degenerative or ruptured intervertebral discs due to their conformation and genetics [5-7]. Dachshunds represent greater than half of the dogs presented for intervertebral disc disease (IVDD), with a reported breed frequency between 19% - 62% [6,7]. While obesity does not appear to lead to disc degeneration, it does appear to increase the risk of disk protrusion or extrusion due to increased thoracolumbar biomechanical stress [5, 8,9]. Obesity has also been associated with an increased time from injury to ambulation following surgery, which is the strongest long term prognostic indicator [10,11]. Therefore, monitoring the weight in these chondrodystrophic dogs is more important than just to prevent metabolic and arthritic disease.
There are several experimental approaches to evaluate body mass in dogs, but few are realistic for the clinical setting. Dual-energy X-ray absorptiometry (DEXA) and deuterium oxide (D2O) dilution have been shown to have excellent correlation with each other for body fat assessment [12]. However, these methods require specialized facilities and expensive equipment and are therefore not readily available to most veterinary practices. The current method of body fat estimation in dogs is the body condition score (BCS) which has been described previously [13]. It is a nine point scale with one being emaciated and nine being grossly obese. BCS has been shown to have a good correlation with DEXA and D2O, with a coefficient of determination of 0.92. BCS uses the examiner’s eyes and hands to assign the patient a numerical value from the scale, so no special equipment is needed. However, it has been show to take 2 to 4 months for the BCS to change one increment and as much as 8% body mass change to be detected with this scale [14]. This lack of sensitivity makes this scale a good estimator of body fat but poor for long term management effectiveness of weight and body mass.
Fat attenuation in computed tomographic (CT) images has a specific density that can be quantified with pixel values, and is used as the gold standard in human obesity. Hounsfield units (HU) are used to express the pixel values within a standard scale, relative to the attenuation of water. The published range of fat attenuation is −135 to −105 Hounsfield units (HU) for dogs [15]. This range can be used to diagnose obesity, specifically the amount of visceral fat which is closely associated with various diseases in dogs and humans. However, regular use of CT scans in our veterinary patients for obesity management is unreasonable due to expense and availability.
This pilot study uses the CT gold standard to evaluate the proper area to obtain morphometric measurements in dachshunds for weight management. The long term goal of the authors is to design an accurate body mass index (BMI) formula, using the current human scale, by obtaining objective morphometric body measurements in Dachshunds. This pilot study was undertaken to define the “waist” of a dachshund, a consistent site of fat accumulation, for the later creation of a BMI formula.
2. Materials and Methods
A retrospective medical records search was performed to identify Dachshunds that had spinal CT scans between August 2008 and May 2011. Dogs were excluded if they had a metabolic disease, their medical record was incomplete, the CT scan did not include the outer body wall, or did not include the third thoracic vertebra to the sacrum. Dogs imaged before March 2010 (n = 20) were scanned using a third-generation, single slice Picker PQ-5000 CT machine1. Dogs imaged from March 2010 through June 2011 (n = 4) were scanned using a 4 slice Toshiba Aquilion CT machine2. Because of the retrospective nature of this study, scanning parameters were not standardized for each patient. Age, weight, and gender were recorded for each dog. ImageJ software was used to draw manual regions of interest (ROI) at the levels of T13, L3, and L5 by surrounding the entire body (Figure 1) and then an additional ROI surrounding the visceral cavity on the CT image of each dog (Figure 2), at each spinal level3.
All ROIs were drawn by one of the authors (JFC). Using the CT images at the level of the 13th thoracic vertebra (T13), the third lumbar vertebra (L3) and the fifth lumbar vertebra (L5) the fat area was estimated by counting the number of pixels within a limited range of attenuation values. The attenuation range used was −135/−105 Hounsfield units as previously published for canine fat in
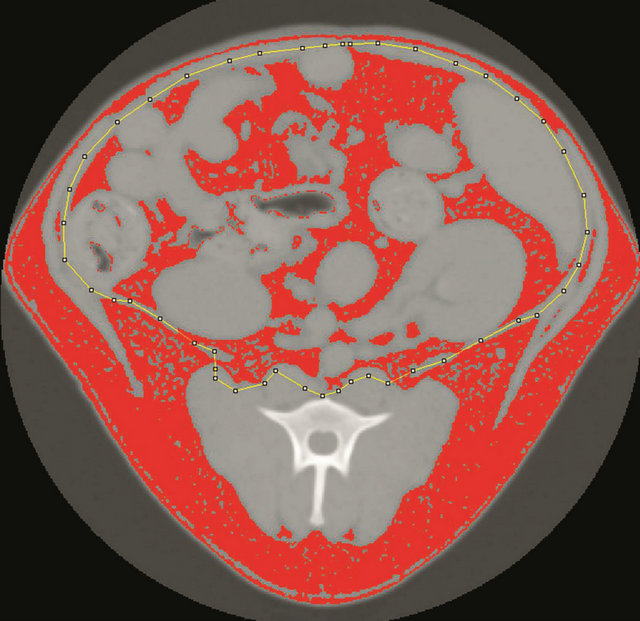
Figure 1. A manually drawn region of interest (ROI, dotted yellow line) was drawn around the visceral cavity using ImageJ. All pixels that fall within the designated range of Hounsfield units for fat are red in the image.
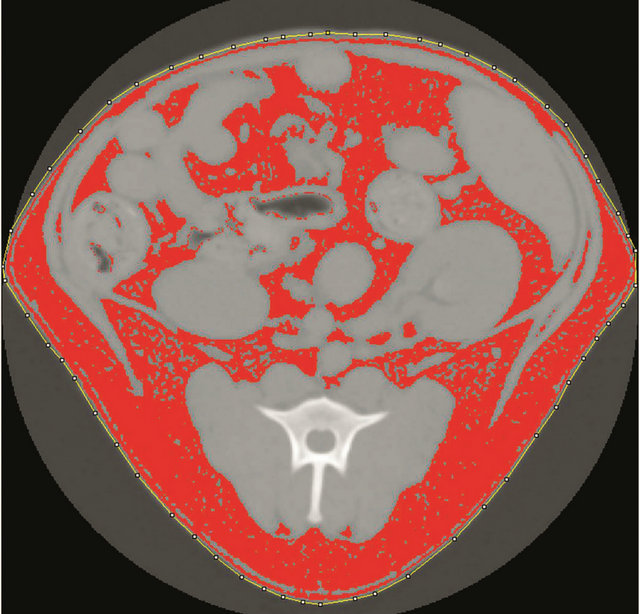
Figure 2. A manually drawn region of interest (ROI, dotted yellow line) was drawn around the entire body using ImageJ. All pixels that fall within the designated range of Hounsfield units for fat are red in the image.
the area [15]. The subcutaneous fat area was calculated as the difference between the visceral fat area from the total fat area.
Mean visceral, subcutaneous, total and percent subcutaneous fat values were compared as a function of gender, age, ROI location and weight in a covariate and regression analyses performed using Statistical Analysis Systems programs PROC GLIMMIX and PROC REG (SAS Institute Inc.). Correlation analysis was performed with the SAS CORR procedure. Quality of fit was determined as coefficient of determination and best regression models were selected, where appropriate, maximizing the adjusted coefficient of determination. All calculations were performed using the SAS System for Windows, Version 9.1 (SAS Institute Inc.) with a statistical significance at α = 0.05.
3. Results
Of 108 Dachshunds with CT scans in the specified date range, 24 dogs fit the study inclusion criteria. Table 1 shows the total, visceral and subcutaneous fat areas measured in the study for T13, L3 and L5. The maximum body fat area with minimal variation was at the L3 location, but was not statistically different from L5. The means of L3 and L5 for total fat and subcutaneous fat distribution were not significantly different from each other but were different from those at T13.
Subcutaneous fat was dependent on body weight (p < 0.01) and highly affected by to ROI location (p = 0.02). Total body fat was also dependent on ROI location and body weight (p = 0.01). Dogs weighing more were much more likely to have higher total body fat area measurements (p ≤ 0.01). Visceral body fat area was highly dependent on body weight and ROI location (p = 0.01) but was also affected when weight and gender were taken together (p = 0.02). The amount of total fat, visceral fat, and subcutaneous fat were dependent on weight and ROI location but not statistically different between L3 and L5 (p = 0.05) (Figure 3).
The total number of subcutaneous fat pixels was unique at all three sites without a clearly superior location for measurement. However, the percentage of subcutaneous body fat when compared to total body fat was highly correlated when measured at ROI L3 (r = 0.53, p < 0.01). Similar measurements for percentage of subcutaneous fat were found at L3 compared to T13 (r = 0.68, p < 0.01), and L3 compared to L5 (r = 0.52, p < 0.01).
However, the percent subcutaneous fat measured at T13 and L5 were least similar from each other (r = 0.29, p = 0.2). Patient weight was not correlated with the percentage of subcutaneous fat at T13, L3 or L5 (r = −0.1, 0.11, −0.2 respectively, p > 0.6).
Covariate analysis revealed total body fat, visceral body fat and subcutaneous body fat for all three ROI to be linearly associated with weight (p ≤ 0.01). However the least square means of L3 and L5 ROI were not significantly different for total fat, visceral fat or subcutaneous fat with relation to dog weight (Figure 3). Conversely, T13 was significantly different from both L3 and L5.
4. Discussion
Body weight does not alter the risk of IVDD in Dachshunds, as calcification is predominantly a result of inherent chondrodystrophic abnormalities [16]. Disk calci-
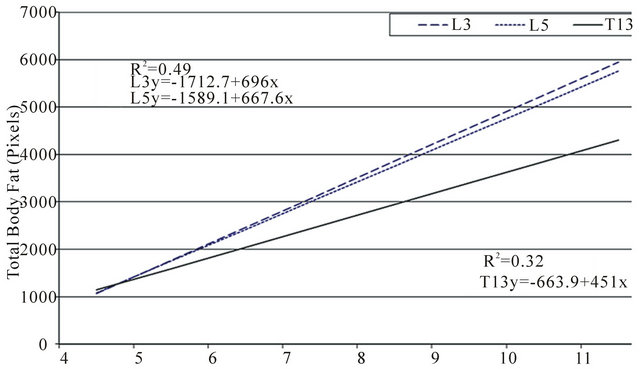

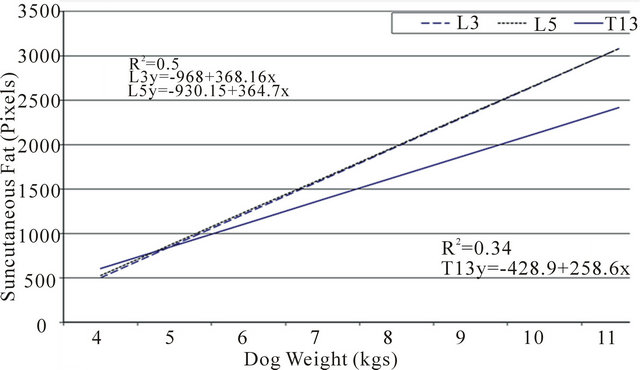
Figure 3. Correlation between patient weight with total body fat, visceral fat and subcutaneous fat were compared at the three regions of interest (L3, L5 and T13). Fat area was measured by computed tomography (CT) using the attenuation range of −135/−105 hounsfield units.
fication is relatively evenly distributed throughout the vertebral column of these dogs [8]. However, disk extrusion tends to occur at high-motion sites such as the thoracolumbar junction, suggesting biomechanical stress factors into the role of extrusion or protrusion of degenerated disks [5]. Previous studies have also shown the thoracolumbar area to be the area of the spine where dogs accumulate adipose tissue most rapidly. The authors used CT assessment in healthy adult Dachshunds to determine where fat is most consistently distributed along the thoracolumbar spine of this chondrodystrophic breed.
Measurements are likely to be consistent if the same anatomic location is used for each measurement. Our study indicates that measurements at L3 are most consistent between dogs. Because of this consistency, and because
Table 1. Pixel counts according to fat type and region of interest.
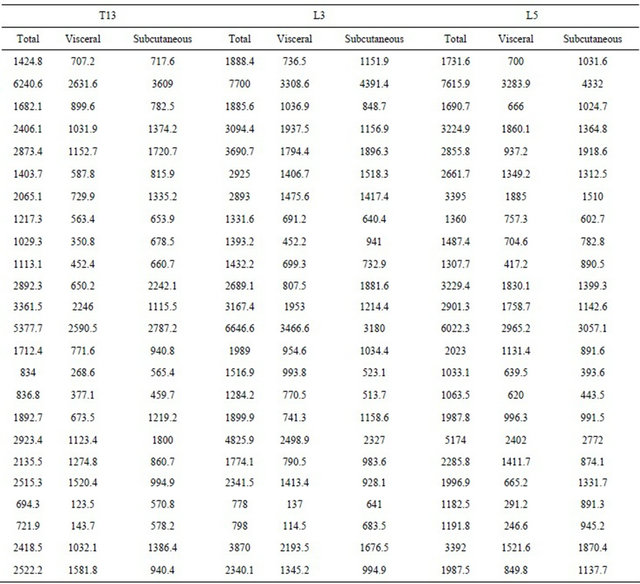
Correlation between the type of body fat measured and body weight at the ROI. Fat area was measured by computed tomography using the attenuation range of −135/−105 Hounsfield units at T13, L3 and L5 and compared with body weight. Pixel counts refer to the number of image pixels counted by the computer within the manually drawn region of interest. Region of interest (ROI), 13th thoracic vertebra (T13), 3rd lumbar vertebra (L3), 5th lumbar vertebra (L5).
the umbilicus, an easily located anatomic landmark, is found at this location, we conclude the level of L3 is the best area to measure body fat in Dachshunds when assessing BMI. However, any consistent, repeatable location used between L3 and L5 would appear to be valuable. Also, since weight and obesity of all three compartments (total body fat, visceral and subcutaneous) were linearly associated with body weight, this anatomic measurement of L3 body wall circumference will likely prove valuable to creating an objective BMI formula.
Obesity is a rising medical concern in dogs. This subject may be sensitive because many of the owners are overweight. However, education of owners and veterinarians is paramount to address proper diet and exercise to avoid the inducible medical conditions associated with canine obesity. Development of a consistent, objective scale of body mass that owners can understand, utilize and accept may remove the emotions of the owner and subjectivity from the weight conversation and lead to healthier and happier owners and patients.
Research is ongoing to determine what other anatomic body measurements should be taken in the dog to formulate a BMI formula similar to the human index. Potential markers include leg height, shin height, body length, trunk length, weight, and carpal circumference [12]. This study demonstrated the best lumbar region to acquire waist measurements, which may be the most consistent area of weight gain, and will be an important objective measurement for the development of a Dachshund BMI formula. This technique may be used for further obesity research. The results obtained in this study will be used to move forward with obtaining morphometric measurements in Dachshunds using the waist to help create a representative BMI formula.
REFERENCES
- K. J. Wolfsheimer, “Obesity,” In: S. J. Ettinger and E. C. Feldman, Eds., Textbook of Veterinary Internal Medicine: Diseases of the Dog and Cat, 5th Edition, WB Saunders, Philadelphia, 2000, pp. 70-72.
- M. S. Hand, P. J. Armstrong and T. A. Allen, “Obesity: Occurrence, Treatment, and Prevention,” Veterinary Clinics of North America Small Animal Practice, Vol. 19, No. 3, 1989, pp. 447-474.
- E. M. Lund, P. J. Armstrong, C. A. Kirk and J. S. Klauser, “Prevalence and Risk Factors for Obesity in Adult Dogs from Private US Veterinary Practices,” International Journal of Applied Research in Veterinary Medicine, Vol. 4, No. 2, 2006, pp. 177-186.
- J. Gossellin, J. A. Wren and S. J. Sunderland, “Canine Obesity: An Overview,” Journal of Veterinary Pharmacology and Therapeutics, Vol. 30, No. 1, 2007, pp. 1-10. doi:10.1111/j.1365-2885.2007.00863.x
- J. M. Levine, G. J. Levine, S. C. Kerwin, B. F. Hettlich and G. T. Fosgate, “Association between Various Physical Factors and Acute Thoracolumbar Intervertebral Disk Extrusion or Protrusion in Dachshunds,” Journal of the American Veterinary Medical Association, Vol. 229, No. 3, 2006, pp. 370-375. doi:10.2460/javma.229.3.370
- M. U. Ball, J. A. McGuire, S. F. Swaim and B. F. Hoerlein, “Patterns of Occurrence of Disk Disease among Registered Dachshunds,” Journal of the American Veterinary Medical Association, Vol. 180, No. 5, 1982, pp. 519-522.
- W. A. Priester, “Canine Intervertebral Disk Disease Occurrence by Age, Breed, and Sex among 8117 Cases,” Theriogenology, Vol. 6, No. 2-3, 1976, pp. 293-303. doi:10.1016/0093-691X(76)90021-2
- H. Hansen, “A Pathologic-Anatomical Study on Disc Degeneration in the Dog,” Acta Orthopaedica Scandinavica —Supplementum, Vol. 11, No. 1, 1952, pp. 1-117.
- J. P. Bray and H. M. Burbidge, “The Canine Intervertebral Disk. Part Two: Degenerative Changes—Nonchondrodystrophoid versus Chondrodystrophoid Disks,” Journal of the American Animal Hospital Association, Vol. 34, 1998, pp. 135-144.
- T. L. Ruddle, D. A. Allen, E. R. Schertel, M. D. Barnhart, E. R. Wilson, J. A. Lineberger, et al., “Outcome and Prognostic Factors in Non-Ambulatory Hansen Type I Intervertebral Disc Extrusions: 308 Cases,” Veterinary and Comparative Orthopaedics and Traumatology: VCOT, Vol. 19, No. 1, 2006, pp. 29-34.
- N. Olby, J. M. Levine, T. Harris, K. Muñana, T. Skeen and N. Sharp, “Long Term Functional Outcome in Dogs with Severe Injuries of the Thoracolumbar Spinal Cord: 87 Cases (1996-2001),” Journal of the American Veterinary Medical Association, Vol. 222, No. 6, 2003, pp. 762- 769. doi:10.2460/javma.2003.222.762
- D. I. Mawby, J. W. Bartges, A. d’Avignon, D. P. Laflamme, T. D. Moyers and T. Cottrell, “Comparison of Various Methods for Estimating Body Fat in Dogs,” Journal of the American Animal Hospital Association, Vol. 40, No. 2, 2004, pp. 109-114.
- D. P. Laflamme, “Development and Validation of a Body Condition Score System for Dogs,” Canine Practice, Vol. 22, No. 1, 1997, pp. 10-15.
- C. M. Dorsten and D. M. Cooper, “Use of Body Condition Scoring to Manage Body Weight in Dogs,” Contemporary Topics in Laboratory Animal Science—American Association for Laboratory Animal Science, Vol. 43, No. 3, 2004, pp. 34-37.
- K. Ishioka, M. Okumura, M. Sagawa, F. Nadadomo, K. Kimura and M. Saito, “Computed Tomographic Assessment of Body Fat in Beagles,” Veterinary Radiology and Ultrasound, Vol. 46, No. 1, 2005, pp. 49-53. doi:10.1111/j.1740-8261.2005.00009.x
- V. F. Jensen and A. K. Ersbøll, “Mechanical Forces Affecting the Occurrence of Intervertebral Disc Calcification in the Dachshund: A Population Study,” Journal of Veterinary Medicine. A, Physiology, Pathology, Clinical medicine, Vol. 47, No. 5, 2000, pp. 283-296. doi:10.1046/j.1439-0442.2000.00296.x
NOTES
*Corresponding author.
1Picker PQ 5000 Universal Medical Systems, Cleveland, Ohio, USA.
2Toshiba Aquilion 4, Toshiba American Medical Systems Inc.Tustin, CA, USA.
3ImageJ, NIH Image, United States Government, http://rsb.info.nih. gov/ij/