Computational Molecular Bioscience
Vol.2 No.4(2012), Article ID:25314,4 pages DOI:10.4236/cmb.2012.24011
Detecting Periodicity Associated with the Alpha-Helix Structure Using Fourier Transform
Department of Computer Science, North Dakota State University, Fargo, USA
Email: changhui.yan@ndsu.edu
Received September 11, 2012; revised October 20, 2012; accepted November 15, 2012
Keywords: Alpha Helix; Discrete Fourier Transform; Short-Term Fourier Transform; Periodicity
ABSTRACT
Alpha helix is a common type of secondary structure in the protein structure that consists of repeating helical turns. Patterns in the protein sequences that cause this repetitive pattern in the structure have long been sought. We used the discrete Fourier transform (DFT) to detect the periodicity signals correlated to the helical structure. We studied the distribution of multiple properties along the protein sequence, and found a property that showed strong periodicity correlated with the helical structure. Using a short-time Fourier transform (STFT) method, we investigated the amplitude of the periodical signals at each amino acid position. The results show that residues in the helix structure tend to display higher amplitudes than residues outside of the helices. This tendency is dramatically strengthen when sequence profiles obtained from multiple alignment were used to detect the periodicity. A simple method that predicted helices based on the amplitude yielded overall true positive rate (TPR) of 63%, 49% sensitivity, 72% specificity, and 0.22 Matthews Correlation Coefficient (MCC). The performance seemed to depend on the length of helices that the proteins had.
1. Introduction
The alpha helix is a protein secondary structure element with each helical turn consisting of 3.6 residues on average. Discovering the periodical signals in protein sequence underlining this regular structure will help understand protein folding and protein function. Discrete Fourier Transform (DFT) is a commonly used method for detecting periodicity in sequences of numerical data. Given a sequence of numerical values, DFT transforms it into a combination of components, with each one corresponding to a frequency. The amplitude value associated with a frequency component is proportional to the significance of that frequency, and thus is an indication of whether a periodicity of that frequency exists in the data sequence and how strong the periodicity signal is.
One approach to finding repeated elements in protein sequences is doing self-alignment. Another approach is to detect periodicities in protein sequences using methods like FT [1-6]. When FT is used to detect periodicity in protein sequences, one fundamental step is to transform the nominal protein sequences into numerical sequences. Different studies handled this step in a different way depending on the purpose of the studies. The REPPER method [7] converted protein sequences into numerical sequences based on hydrophobicity scale. In REPETITA
[8], protein sequences were transferred into functions based on Atchley’s five numerical scales [9]. The FT method can detect whether a periodicity of a certain frequency exists in the whole protein sequence. However, if the periodicity only exists in a region of the sequence, the method can’t reveal the boundaries of the region. To address this problem, the Short-Time Fourier Transform (STFT) method uses a sliding window to detect the periodicity at each position of the sequence [10,11]. Although the afore-mentioned methods have been used to detect repeated elements or periodicity in protein sequences, no efforts have been made to detect sequence periodicity pertaining to a particular secondary structure. The ability to detect such a periodicity would enable researchers to quickly determine the secondary structure of a protein sequence and help to reveal the function of the protein. Thus, there is an urgent need for methods that can accurately detect sequence periodicity correlated to secondary structure.
In this study, we evaluated the effectiveness of different numerical scales in detecting the periodicity correlated with the helices. Then, we analyzed the signal amplitude at the position of each residue. Finally, we explored the feasibility of predicting helices based on the signal amplitude.
2. Methods and Materials
2.1. Datasets
Protein structures and helical segments were obtained from the Structural Classification of Protein (SCOP) [12]. We excluded the SCOP classes that did not consist of alpha helixes. Six classes were retained: A, C, D, E, F and G. We obtained 20 longest alpha-helical segments from each of the classes. Thus, a total of 120 helical segments was obtained. These helical segments were used to evaluate the effectiveness of different numerical scales in detecting periodicity correlated with the helical structure. The average length of these helical segments is 53.9 for class A, 41.3 for C, 43.7 for D, 36.9 for E, 40.9 for F, and 20.5 for G. The protein structures to which these 120 segments belonged were also identified. There were 118 proteins in total. These proteins were used in the experiments for investigating the amplitude at each residue position and for predicting helical residues based on the amplitude.
2.2. Measurement of the Prediction Performance
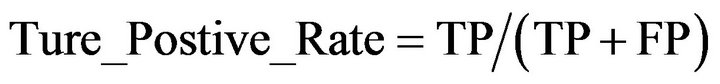
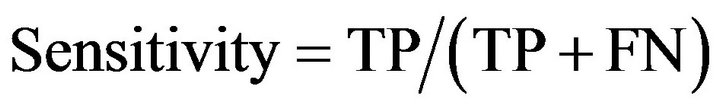
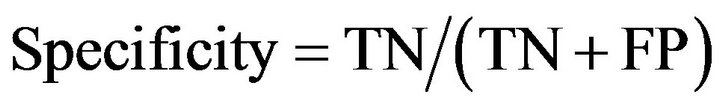
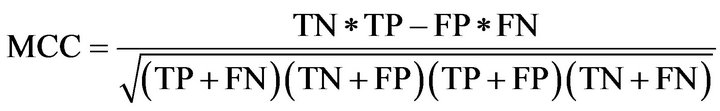
The performance of predicting helical residues was evaluated using true positive rate (TPR), sensitivity, specificity, and Matthews Correlation Coefficient (MCC) as follows.
 (1)
(1)
 (2)
(2)
 (3)
(3)
 (4)
(4)
where TP was the number of residues that were predicted to be helical and were actually in a helix; FP was the number of residues that were predicted to be helical but were actually in non-helix regions; TN was the number of residues that were predicted to be non-helical and were actually in non-helix regions; and FN was the number of residues that were predicted non-helical but were actually in helical regions.
3. Results
3.1. Detect Periodicity in Alpha Helix Sequences Using Discrete Fourier Transform (DFT)
The alpha helical structure is a periodical structure with each helix turn consisting of 3.6 amino acids on average. Thus, on a helical segment of N residues, this periodical structure should result in a periodical signal with frequency of  in the protein sequence. We investigated whether this periodical signal of frequency
  was detectable in protein sequence. First, the protein sequence was translated into a sequence of numerical values based on a property scale of the amino acids. Then, DFT was used to detect periodicity in the sequence using the same procedure as in [8]. We explored eleven property scales related to residues’ propensities in secondary structure and alpha helix (Table 1). We used DFT to generate the amplitude-frequency plot for the set of 120 alpha helical segments taken from the SCOP database. Table 2 shows the number of segments that displayed an amplitude peak at
 . The results showed that when feature F11 was used to transform protein sequence into numerical sequence, the DFT was able to detect a peak at frequency
  in 92 out of 120 helix segments (76.7%).

Table 1. Property scales examined for detecting periodicity in the alpha helices.

Table 2. Number of helical segments that exhibited a peak at frequency  in the discrete Fourier transform.
3.2. Short-Time Fourier Transform (STFT) to Locate Alpha-Helical Segments
The results above showed that a majority of alpha helices had detectable periodicity in the protein sequence correlated with the helical structure. Therefore, we explored the feasibility of predicting the alpha helical secondary structure by detecting periodicity on the protein sequence. This test was performed using the 118 proteins that contained the 120 helices used above. The challenge in this step is that a protein chain has a mixture of alpha helices, beta sheets and coils. While the DFT can detect the periodicity associated with the alpha helices, it is not able to detect the locations and boundaries of the alpha helices. To overcome this problem, we treated the positions of amino acids as a sequence of time points and used the short-time Fourier transform (STFT) to discover timefrequency relationship in the protein sequences [10,11].
First, the protein chain was translated into a sequence of numerical values using feature F11. Then, a window of size 15 was slid along the protein sequence to generate a time-frequency plot using the STFT. To find the locations and boundaries of the alpha helices, we will need to find the time intervals (i.e. protein segments) that show high amplitudes at frequency , where N is the length of the protein chain. Figure 1 shows a contour map of a STFT time-frequency plot of a protein (chain A of PDB id 1mhs) with sequence length N = 510. The contour lines show the amptitute values. The red vertical line in Figure 1 corresponds to frequency
  . Figure 2 shows that amplitudes for frequency of
  along the protein chain (the time domain).
If STFT is able to predict alpha helix, then residue positions corresponding to the actual alpha helices should have high amplitudes at frequency  (see Figure.
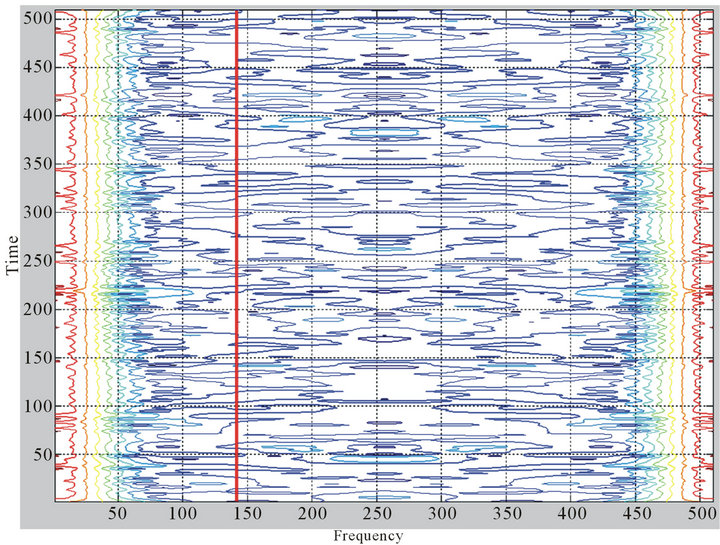
Figure 1. A coutour map of STFT time-frequency plot of a protein chain. The frequency corresponding to the periodicity of helical structure is shown by the red vertical bar. The contour lines show the amplitude values.
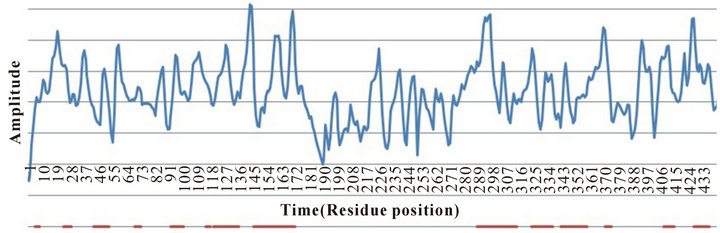
Figure 2. Blue line shows the amplitude values on the frequency of  along the time line (residue position) from Figure 1. Red horizontal lines show the actual regions of alpha helices along the protein sequence.
2). For each protein, we sorted residues based on their amplitudes at frequency , and looked at the enrichment of alpha helix residues at the top 10% of the amplitudes and compared that with the actual fraction of residues that are helical in the proteins (Table 3). In the 118 proteins, 49% of the overall residues were in the helical structure. In comparison, 54% of the residues that are in the top 10% amplitude range are actually helical residues. This result shows that helical residues tend to enrich in the region of high amplitudes. Table 3 also shows that different SCOP class showed different degree of enrichment.
Protein sequence profiles generated from multiple alignment have been used in different studies [14,15]. We also explored the feasibility of using them to improve the detection of helical residues. Sequence profiles were generated by running the PSI-BLAST program [16] against the NCBI’s non-redundant database using 4 iterations and an e value of 0.001. One row of the sequence profile corresponds to one residue position in the protein and it consists of 20 numerical values corresponding to the percentages of the 20 natural amino acid types found in that position of the multiple alignment. Then, for a given property scale, the protein sequence was translated into a sequence of numerical values by calculating a weighted sum for each residue position using the corresponding 20 values in the sequence profile as weighting factors. Table 3 shows that using sequence profiles, the enrichment of helical residues in the top 10% amplitude range was dramatically increased from 54% to 71% for the overall dataset. Increment was observed in all SCOP classes. We divided the whole amplitude range into 10 bins with the first bin corresponding to the top 10% amplitude range (0% - 10% range) and the last bin corresponding to the last 10% range (90% - 100%). We analyzed the enrichment of helical residues in each of the 10 bins. The results (Table 4) showed a clear trend that helical residues tend to high amplitudes at frequency . For example, for SCOP class A, 92% of the residues in the first bin (0% - 10% range) were actually
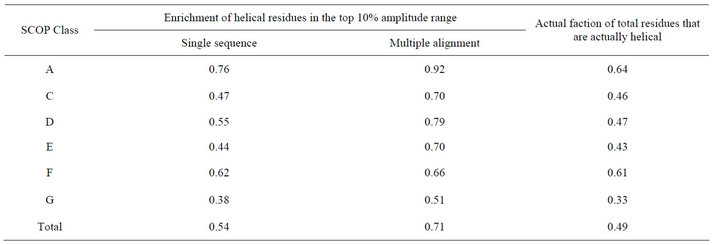
Table 3. Helical residues tend to show high amplitudes in frequency .
.
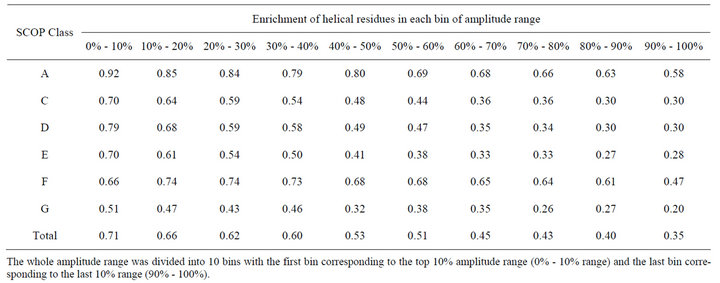
Table 4. Enrichment of helical residues in each bin of the amplitude range.
The whole amplitude range was divided into 10 bins with the first bin corresponding to the top 10% amplitude range (0% - 10% range) and the last bin corresponding to the last 10% range (90% - 100%).
helical and the fraction was gradually decreased to 59% in the last bin (90% - 100% range).
Our results have shown the enrichment of helical residues in the high amplitude regions. Base on this observation, we designed a simple method for predicting helical residues. The prediction was evaluated using leaveone-out cross validation at protein level. We calculated the average amplitude of helical residues in the training set, then residues in the test set with amplitudes higher than the average was predicted to be helical residues. This method predicts helical residues with overall 0.63 true positive rate (TPR), 0.49 sensitivity, 0.72 specificity, and 0.22 Mathew’s correlation coefficient (MCC). The prediction performance varied from SCOP class to class. Best performance was achieved for class A with 0.78 TPR, 0.51 sensitivity, 0.73 specificity, and 0.23 MCC and worst for class G with 0.44 TPR, 0.48 sensitivity, 0.69 specificity, and 0.17 MCC. The average length of helixes is 53.9 residues in domain A, 41.3 in C, 43.7 in D, 36.9 in E, 40.9 in F, and 20.5 in domain G. This prediction performance on a class seems depend on the average length of helical segments. This is understandable, since each turn of helix has 3.6 residues, longer helical segments would present clear periodicity signal than shorter ones. Another factor that may affect the prediction in different classes is that the STFT detects the periodicity in a window of residues. This method will achieve best result if all residues in the widow are helical residues. However, for residue positions that are at the beginning or the end of the each helical fragment, half of the window consists of non-helical residues. Thus, the periodicity signals for these positions will be weaker compared with positions at the middle of the helixes.
4. Conclusions
In this study, we explored the effectiveness of using DFT to detect the periodicity associated with the secondary structure of helix. We analyzed the distribution of multiple numerical properties along the protein sequence and found that numerical index FINA910101 displayed strong periodicity correlated with the helix structure. FINA910101 is the helix initiation parameter for amino acids. We used STFT to detect periodicity at amino acid positions of protein sequence. We focused on the frequency , which is associated with the helical structure. We found that helical residues have the tendency of associating with higher amplitudes on that frequency. When sequence profiles generated from multiple sequence alignment were used to detect periodicity, helical residues displayed higher degree of enrichment in the high amplitude regions. These results show that the periodical structure of helixes causes detectable periodicity in the protein sequence. We then examined the effectiveness of a simple method for predicting helical residues based on the periodicity. The method predicted helical residue with overall 0.63 TPR, 0.49 sensitivity, 0.72 specificity, and 0.22 MCC. The prediction performance varies from a SCOP class to another. The performance seems to depend on the length of helical structures.
The results presented in this study show that there are detectable sequence periodicity that are correlated with the secondary structure of helices. Our method can accurately detect such periodicity, and thus provides an efficient way for predicting secondary structure of proteins.
REFERENCES
- A. D. McLachlan, “Coiled Coil Formation and Sequence Regularities in the Helical Regions of Alpha-Keratin,” Journal of Molecular Biology, Vol. 124, No. 1, 1978, pp. 297-304. doi:10.1016/0022-2836(78)90163-8
- A. D. McLachlan and J. Karn, “Periodic Features in the Amino Acid Sequence of Nematode Myosin Rod,” Journal of Molecular Biology, Vol. 164, No. 4, 1983, pp. 605- 626. doi:10.1016/0022-2836(83)90053-0
- A. D. McLachlan and M. Stewart, “The 14-Fold Periodicity in Alpha-Tropomyosin and the Interaction with Actin,” Journal of Molecular Biology, Vol. 103, No. 2, 1976, pp. 271-298. doi:10.1016/0022-2836(76)90313-2
- J. Marshall and D. V. Holberton, “Sequence and Structure of a New Coiled Coil Protein from a Microtubule Bundle in Giardia,” Journal of Molecular Biology, Vol. 231, No. 2, 1993, pp. 521-530. doi:10.1006/jmbi.1993.1303
- E. Hoiczyk, et al., “Structure and Sequence Analysis of Yersinia YadA and Moraxella UspAs Reveal a Novel Class of Adhesins,” EMBO Journal, Vol. 19, No. 22, 2000, pp. 5989-5999.
- C. Pasquier, et al., “A Web Server to Locate Periodicities in a Sequence,” Bioinformatics, Vol. 14, No. 8, 1998, pp. 749-750. doi:10.1093/oxfordjournals.bioinformatics.a011054
- M. Gruber, J. Soding and A. N. Lupas, “REPPER-Repeats and Their Periodicities in Fibrous Proteins,” Nucleic Acids Research, Vol. 33, Suppl. 2, 2005, pp. W239- W243. doi:10.1093/nar/gki405
- L. Marsella, et al., “REPETITA: Detection and Discrimination of the Periodicity of Protein Solenoid Repeats by Discrete Fourier Transform,” Bioinformatics, Vol. 25, No. 12, 2009, pp. i289-i295. doi:10.1093/bioinformatics/btp232
- W. R. Atchley, et al., “Solving the Protein Sequence Metric Problem,” Proceedings of the National Academy of Sciences of the United States of America, Vol. 102, No. 18, 2005, pp. 6395-6400. doi:10.1073/pnas.0408677102
- Q. Fang and I. Cosic, “Can Short Time Fourier Transform Detect the Localized Latent Periodicity of a Protein Sequence?” IEEE EMBS Asian-Pacific Conference on Biomedical Engineering, Melbourne, 20-22 October 2003, pp. 66-67. doi:10.1109/APBME.2003.1302586
- P. Ramachandran, A. Antoniou and P. P. Vaidyanathan, “Identification and Location of Hot Spots in Proteins Using the Short-Time Discrete Fourier Transform,” 38th Asilomar Conference on Signals, Systems and Computers, Vol. 2, 2004, pp. 1656-1660. doi:10.1109/ACSSC.2004.1399439
- A. G. Murzin, et al., “SCOP: A Structural Classification of Proteins Database for the Investigation of Sequences and Structures,” Journal of Molecular Biology, Vol. 247, No. 4, 1995, pp. 536-540. doi:10.1016/S0022-2836(05)80134-2
- S. Kawashima, et al., “AAindex: Amino Acid Index Database, Progress Report 2008,” Nucleic Acids Research, Vol. 36, Suppl. 1, 2008, pp. D202-D205. doi:10.1093/nar/gkm998
- B. Rost and C. Sander, “Improved Prediction of Protein Secondary Structure by Use of Sequence Profiles and Neural Networks,” Proceedings of the National Academy of Sciences of the United States of America, Vol. 90, No. 16, 1993, pp. 7558-7562. doi:10.1073/pnas.90.16.7558
- J. A. Cuff and G. J. Barton, “Application of Multiple Sequence Alignment Profiles to Improve Protein Secondary Structure Prediction,” Proteins: Structure, Function, and Bioinformatics, Vol. 40, No. 3, 2000, pp. 502-511. doi:10.1002/1097-0134(20000815)40:3<502::AID-PROT170>3.0.CO;2-Q
- S. Altschul, et al., “Gapped BLAST and PSI-BLAST: A New Generation of Protein Database Search Programs,” Nucleic Acids Research, Vol. 25, No. 17, 1997, pp. 3389- 3402. doi:10.1093/nar/25.17.3389