American Journal of Analytical Chemistry
Vol.5 No.6(2014), Article ID:45151,8 pages DOI:10.4236/ajac.2014.56043
Evaluation of Fourier Transform Infrared Spectroscopy for Diagnosis of Peroxisomal Diseases with Abnormal Very-Long-Chain Fatty Acid Metabolism
Minori Isogawa1, Satoshi Yoshida1*, Nobuyuki Shimozawa2
1Department of Biomolecular Science, Faculty of Engineering, Gifu University, Gifu, Japan
2Division of Genomics Research, Life Science Research Center, Gifu University, Gifu, Japan
Email: *xyosida@gifu-u.ac.jp
Copyright © 2014 by authors and Scientific Research Publishing Inc.
This work is licensed under the Creative Commons Attribution International License (CC BY).
http://creativecommons.org/licenses/by/4.0/


Received 4 February 2014; revised 26 March 2014; accepted 3 April, 2014
ABSTRACT
Very long chain fatty acids (VLCFAs) are accumulated in cells and blood in patients with peroxisomal diseases, such as adrenoleukodystrophy (ALD) and Zellwger Syndrome (ZS). The purpose of this study is to investigate usefulness of Fourier transform infrared spectroscopy (FTIR) with attenuated total reflection (ATR) analysis method for clinical diagnosis of those diseases, thereby we measured the infrared spectra of the sera of patients and healthy controls. Correlation coefficients between 2nd derivative FTIR spectra of the serum samples and the VLCFA content ratio, which is used as a clinical parameter to date, were comprehensively calculated to investigate which wavenumber showed high correlation with the VLCFA ratio. Multiple regression analysis using the serum FTIR spectra showed that high correlations were observed with VLCFA ratios (C26:0/C22:0 ratio), and we could construct a suitable regression model (R2 = 0.97, p wang#Bracket## 3.2 × 10⁻¹⁹). In addition, the model system using various VLCFAs in newborn bovine serum also showed that several FTIR peaks in 800 ~ 900 cm−1 region were found to have good correlation with VLCFA ratios. Our results support that FTIR analysis is useful for diagnosis of peroxisomal diseases.
Keywords:Fourier Transform Infrared Spectroscopy, Attenuated Total Reflection, Very Long Chain Fatty Acids, Peroxisomal Diseases, Multiple Regression Analysis

1. Introduction
Peroxisome is one of organelles found in most eukaryotic cells. This organelle plays a role not only in decomposing hydrogen peroxide, but in β-oxidizing very long chain fatty acids (VLCFAs) longer than C20. When the peroxisomal functions are declined or lost, VLCFAs are usually accumulated in cells and blood resulting in damages to brain and nerves. Such diseases are called peroxisomal diseases. This may be due to defects in a single enzyme important for peroxisomal function or in peroxins, proteins encoded by PEX genes that are critical for normal peroxisome assembly and biogenesis [1] [2] . The typical case of the former is X-linked adrenoleukodystrophy (ALD), and the latter Zellweger syndrome (ZS).
There are various clinical phenotypes of ALD. In Japan, the childhood cerebral form (CCALD: 29.9%), the adolescent cerebral form (9.1%), the adult cerebral form (21.4%), adrenomyeloneuropathy (AMN: 25.3%), the olivo-ponto-cerebellar form (8.4%) and presymptomatic (4.5%) are reported [3] . CCALD is the most common phenotype and the prognosis of this is generally very poor and the patients would be dead within a few years. Hematopoietic stem cell transplantation (HSCT) is currently the only curative approach, which can prevent the progression of brain damage in the cerebral form of ALD, however, HSCT is effective for patients only in the early stages of cerebral symptoms. Furthermore, only one-third of CCALD patients diagnosed after onset could undergo HSCT because it takes considerable time to prepare for HSCT, including searching for matched donors. Therapy of ZS has not been established yet, and a rapid and convenient diagnosis is important for overcoming these kinds of intractable diseases. The purpose of this study is to investigate usefulness of FTIR analysis for clinical diagnosis of those diseases, because FTIR method may provide very rapid and precise techniques for measurement of biomaterials. Actually we have reported several FTIR techniques to measure rapidly the human body non-invasively and biomaterials non-destructively [4] [5] [6] . Thereby we measured the infrared spectra of the sera of patients and healthy controls for comparison.
2. Materials and Methods
2.1. Materials
The serum samples of 10 healthy controls, 5 ALD and 10 ZS were obtained from Division of Genomics Research, Life Science Research Center, Gifu University, Gifu, Japan. All samples were stored at −80˚C or −25˚C until use. The standard very long chain fatty acids (FAs; C26:0, C22:0) were obtained from Matreya Inc., USA.
2.2. Methods
2.2.1. FTIR Method
The measurement of serum sample with FTIR spectroscopy was carried out using ML; Agilent 5500 Compact FTIR (Agilent technologies, USA). Each spectrum was measured in 4000 - 750 cm−1 range with a 4 cm−1 resolution and 64 accumulations for averaging. For each sample, 0.3 µL serum was dropped onto ATR diamond probe in the apparatus, and dried up with an air dryer. The dried sample was immediately measured and analyzed with a software (Grams-AI, Galactic Inc., USA). The second derivative form of the spectrum was obtained using Savitzky-Golay method with 15 points processing. All spectra were normalized to the intensity of amide I peak at 1650 cm−1.
2.2.2. Statistical Method
Basically the VLCFA ratios (C24:0/C22:0, C25:0/C22:0, C26:0/C22:0) in serum were compared with FTIR spectrum of serum comprehensively in a whole range of wavenumbers followed by calculation of Peason’s correlation coefficient (r) for each wavenumber. For this calculation, delta intensity for the 2nd derivative spectral peak was initially measured by obtaining the intensity difference between the trough and the nearest peak. However, the delta intensity for a peak was sometimes difficult to represent changes of minor components in a mixture of biomolecules such as serum. Thus we adopted the other parameter, delta (∆) absorbance, which represented the difference between the absorbances in 2nd derivative spectrum at some wavenumber pair with relatively higher correlation (r2 > 0.255, p < 0.01) to VLCFAs ratios found after comprehensive calculation to obtain correlation coefficients in the wavenumber range 764 ~ 1500 cm−1.
Multiple regression analysis Multiple regression analysis using 2nd derivative FTIR spectra were performed with SPSS statistics software ver. 17.0 (IBM, USA). In this analysis the independent variables (∆ absorbances at selected wavenumbers) were selected within ten variables in order to avoid multicollinearity.
2.2.3. Standard Model Systems
Standard FAs were dissolved in chloroform/methanol (1:2) solution with heating at 40˚C and sonication in certain amounts.
FA only system Initially the mixtures of C26:0 and C22:0 were obtained in various ratios (C26/C22 = 0:10, 3:7, 5:5, 7:3, 10:0; 5 mg/mL) in glass test tubes. The sample mixtures were dried with N2 gas flushing, and the resulted small powder was loaded on the diamond ATR probe of FTIR apparatus. The FTIR spectra of dried FAs were measured with pressing on the probe with 2 cm−1 resolution and 64 accumulations.
NBA (Newborn bovine serum) + FA system The FA mixtures (C26:0/C22:0 = 10:0, 9:1, 8:2, 7:3, 6:4, 5:5, 4:6, 3:7, 2:8, 10:0) were obtained in 200 µL in glass vials, and dried with N2 gas flushing. Those FAs were dissolved in 50 µL of dimethylformamide (DMF) at room temperature for 30 min, and then added by 2 mL of NBS solution at 30˚C with 30 sec sonication, and settled at room temperature for 30 min and again sonicated for 1 min to homogeneity. The resulted NBS-FA mixtures were put in 0.5 µL on an aluminum foil sheet, and dried in vacuo at room temperature for 1 day. The FTIR spectra of dried NBS-FA samples on the aluminum foil were directly measured on the ATR probe with pressing. The aluminum foil did not have any significant infrared spectrum.
The study was reviewed and permitted by the ethics committee of the Gifu University Graduate School of Medicine.
3. Results and Discussion
The concentrations (µg/100 µL serum) of very long chain fatty acids (VLCFA) in sera of 15 patients (5 ALD and 10 ZS) and 10 healthy controls were summarized in Table 1.
Most of fatty acids including VLCFAs were present in bound form to various proteins in blood or serum [7] [8] and in this experiment the FTIR spectra of sera were normalized at amide I (1650 cm−1) peak corresponding to serum proteins mainly. For analysis of VLCFAs by FTIR, it is important to measure in the lower wavenumber region because fatty acid methylene-originated rocking vibration mode could be observed in the wavenumber range between 720 and 1040 cm−1 with chain length dependency [9] . It is also reported that long-chain fatty acids had accordeon mode vibration as revealed by Raman spectroscopy [10] .
3.1. Correlation Analysis
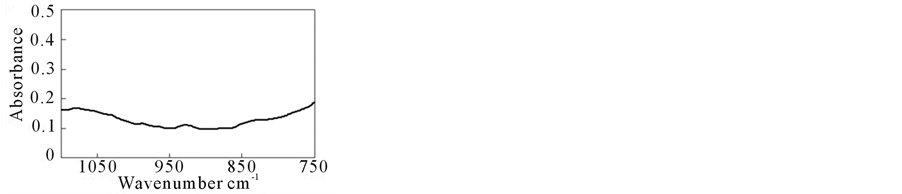
Figure 1 shows the raw and 2nd derivative spectra in the range 750 ~ 1100 cm−1. This 2nd derivative form allowed us to resolve broad, overlapping bands into individual bands thus increasing the accuracy of analysis.
Figure 2 shows the 2nd derivative spectrum and the result of correlation analysis (r values) in the region between 750 and 1200 cm−1, where r values were calculated as correlation coefficients for C26:0/C22:0 ratios of subjects sera in all wavenumbers measured. From this correlation coefficient (r) data, 182 wavenumbers in the lower wavenumber region were picked up with larger |r| values (>0.4) to construct “∆ absorbance” for suitable pair of wavenumbers, for example, ∆ (1101 - 838), where the difference between the 2nd derivative absorbance value (actually in the unit of [absorbance]/[wavenumber]2) at 1101 cm−1 and that at 838 cm−1 was calculated as a “∆ absorbance”. Figure 3 shows the significant correlation plot between ∆ (1101 - 838) and C26:0/C22:0 ratio in sera of subjects as one example with r value of 0.75.
3.2. Multiple Regression Analysis
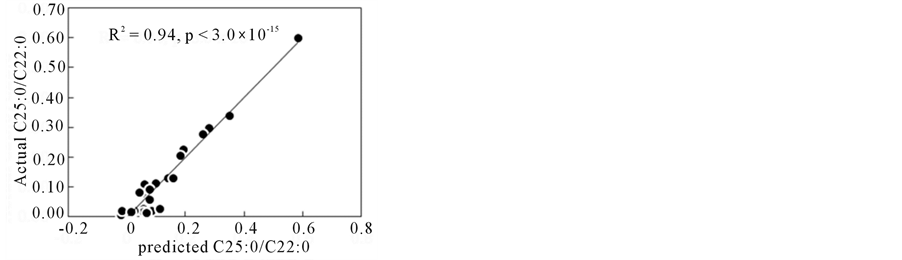
For Multiple Regression Analysis (MRA), several ∆ absorbance variables were selected after the correlation analysis with higher r values as described above. MRA was carried out for concentrations of some VLCFAs and C24/C22, C25/C22, C26/C22 ratios, and those values could be predicted from FTIR spectra. Figure 4 shows the correlations between predicted and measured values by MRA. The model parameters in MRA were summarized in Table 2. In Table 2, the MRA model formulas using linear relations for several (within 10) ∆ absorbances were presented to the target values (concentrations of C24:0, C25:0, C26:0; ratios for C24:0/C22:0, C25:0/C22:0, C26:0/C22:0).
These results indicate FTIR method may be applicable to clinical diagnosis for abnormal accumulation of VLCFAs in human blood.

Table 1 . VLCFAs contents in subjects’ sera (µg/100µL). c: control, a: ALD, z: ZS.
 (a)
(a)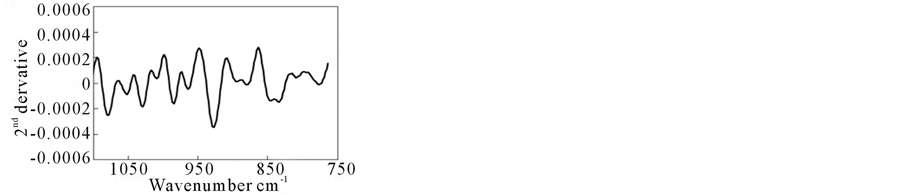 (b)
(b)
Figure 1. Raw (a) and 2nd derivative form (b) of FTIR spectrum of serum at lower wavenumber region.
3.3. Standard Model System
3.3.1. FA only Model System
Figure 5 shows the systematic change of FTIR spectra in the lower wavenumber region (820 - 880 cm−1) with various C16:0/C22:0 fatty acid ratios. This result indicates that those peak positions were dependent on fatty acid chain-lengths. As these spectral data were derived from pure fatty acids, it may be reasonable to assume those peak positions and intensities would be changed when fatty acids were bound or interacted with lipoproteins or albumins.
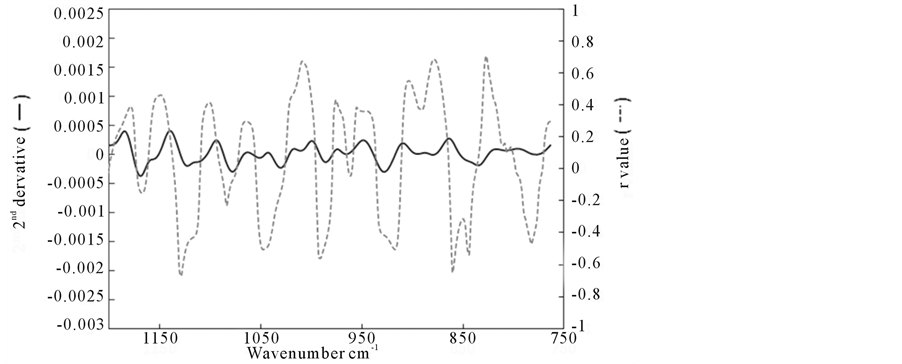
Figure 2. 2nd derivative spectrum of human serum (solid line) and plots of correlation coefficient (r) at each wavenumber point for C26:0/C22:0 ratio (dashed line).
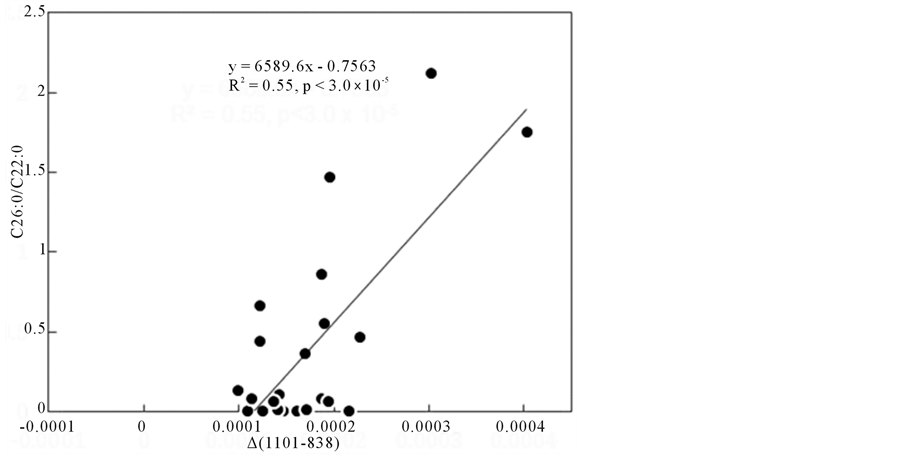
Figure 3. One example of correlation plot between ∆ (1101 - 838) and C26:0/C22:0 ratio in sera of subjects with r value of 0.75.
Table 2. Multiple regression analysis formulas for targeted VLCFSs (contents and ratios).
Among several wavenumber positions which were chain-length dependent, ∆ absorbance (such as ∆ (866 - 829)) was actually correlated with the serum C26:0/C22:0 ratio in patients as shown in Figure 6. This correla-
 (a)
(a)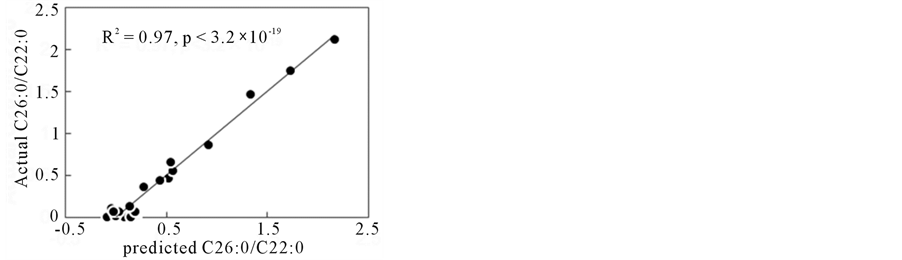 (b)
(b)
Figure 4. Prediction of C25:0/C22:0 and C26:0/C22:0 ratios by multiple regression analysis. (a) C25:0/C22:0 (b) C26:0/C22:0.
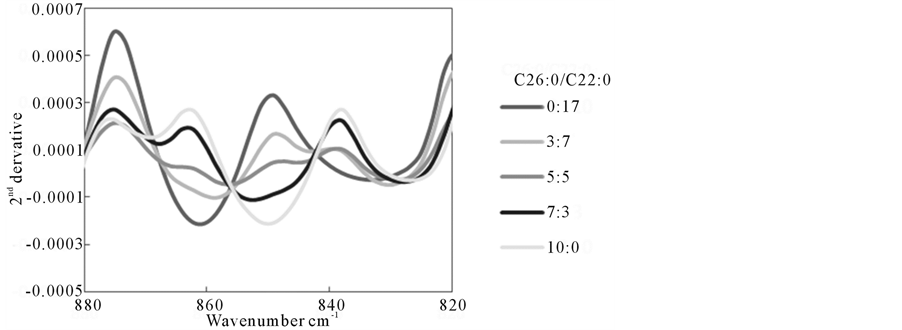
Figure 5. Systematic changes of 2nd derivative FTIR spectra for various amount of C26:0 and C22:0 in FA only model.
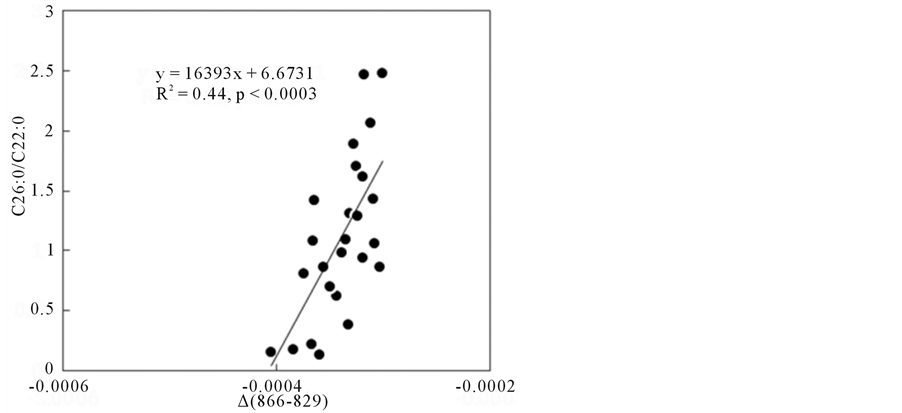
Figure 6. ∆ absorbance (866 - 829) found in FA only model vs. serum C26:0/C22:0 ratio plots.
tion was significant (r = 0.66, p < 0.0003), however, wide scatters of data plots were also observed along with the fitted line, indicating that various interactions between VLCFAs and serum proteins or biomolecules would be present.
In MRA model the ∆ absorbances at 1263 cm−1 and 1309 cm−1 was used for the prediction of C26:0/C22:0 ratio (Table 2), these wavenumbers were also used in the FA only model and these ∆ absorbances were correlated with VLCFA ratios (not shown in this paper).
3.3.2. NBS + FA Model System
Figure 7 shows 2nd derivative FTIR spectra of newborn bovine serum (NBS) with various amount of C26:0 and C22:0 in various ratios in the range 800 ~ 900 cm−1, and slight but systematic changes were observed at around 830 and 870 cm−1.
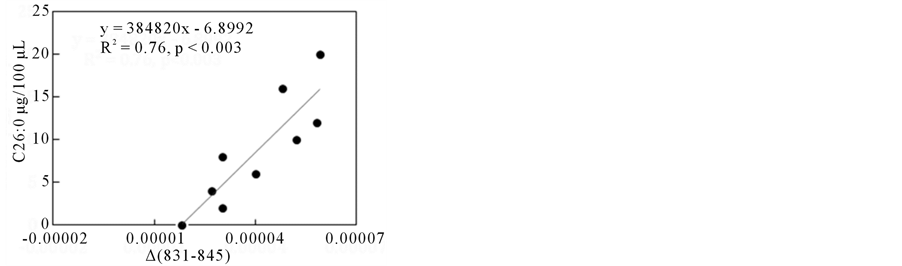
After building up suitable ∆ absorbances, as described previously (shown in Figure 3), which showed higher correlations with the amount of C26:0 (µg/100µL of NBS), two cases are shown in Figure 8. The ∆ absorbances (delta (831 - 845) in (a) and ∆ (881 - 862) in (b)) showed good correlations with the amount of C26:0.
These wavenumber regions used to suitable ∆ absorbances were also observed in the FA only model system as shown in Figure 5. This result indicates that FTIR could detect VLCFAs with various chain lengths even in the presence of various biomolecules of serum rather than fatty acids.
4. Conclusion
The present results have shown that FTIR-ATR analysis method has a potential to diagnose peroxisomal diseases, especially the prediction of the amount of the very long chain fatty acids and their ratios in human serum. The feasibility of this analysis for clinical samples is supported by the investigation for the model system including various amounts of C26:0 and C22:0 fatty acids with and without newborn bovine serum. Especially for analysis of correlation of FTIR spectra to serum C26:0 and C22:0 contents, the multiple regression analysis was very effective to predict C26:0/C22:0 ratio.
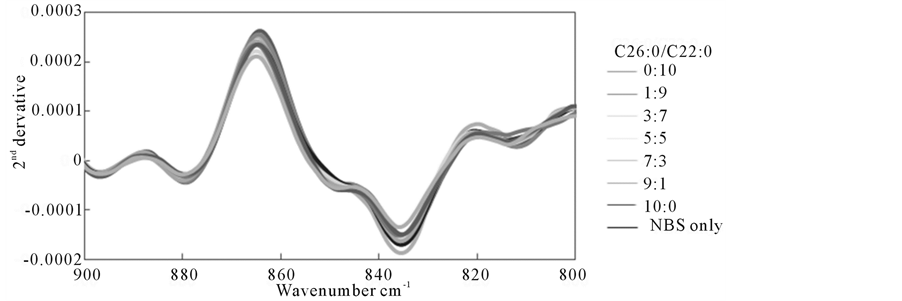
Figure 7. 2nd derivative spectra with various C26:0/C22:0 ratios in NBS + FA model system.
 (a)
(a)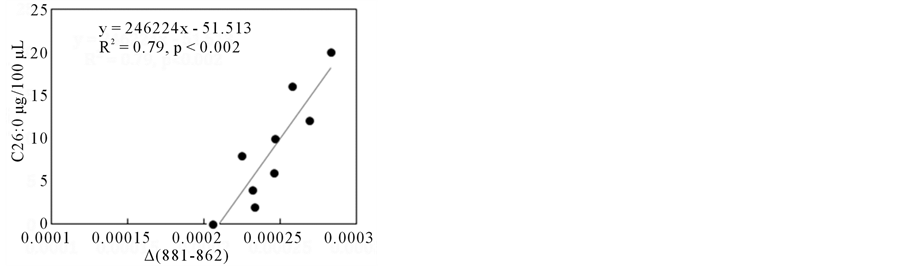 (b)
(b)
Figure 8. ∆ absorbance (831 - 845) (a) and (881 - 862) (b) vs. C26:0 content plots in NBS-FA model system. (a) ∆ absorbance (831 - 845), (b) ∆ absorbance (881 - 862).
Acknowledgements
This research has been supported in part by grants (No. 08000853 and 10006042) to S. Y. from JST (Japan Science and Technology Agency) and from the Ministry of Education, Science, Sports and Culture, Grants-inAid for Scientific Research, respectively.
References
- Shimozawa, N., Honda, A., Kajiwara, N., Kozawa, S., Nagase, T., Takemoto, Y. and Suzuki, Y. (2011) X-Linked Adrenoleukodystrophy: Diagnostic and Follow-Up System in Japan. Journal of Human Genetics, 56, 106-109. http://dx.doi.org/10.1038/jhg.2010.139
- Shimozawa, N. (2011) Molecular and Clinical Findings and Diagnostic Flowchart of Peroxisomal Diseases. Brain and Development, 33, 770-776. http://dx.doi.org/10.1016/j.braindev.2011.03.004
- Takemoto, Y., Suzuki, Y., Tamakoshi, A., Onodera, O., Tsuji, S., Hashimoto, T., Shimozawa, N., Orii, T. and Kondo, N. (2002) Epidemiology of X-Linked Adrenoleukodystrophy in Japan. Journal of Human Genetics, 47, 590-593. http://dx.doi.org/10.1007/s100380200090
- Yoshida, S., Zhang, Q.Z., Sakuyama, S. and Matsushima, S. (2009) Metabolism of Fatty Acids and Lipid Hydroperoxides in Human Body Monitoring with Fourier Transform Infrared Spectroscopy. Lipids in Health and Disease, 8, 28. http://dx.doi.org/10.1186/1476-511X-8-28
- Sakuyama, S., Hirabayashi, C., Hasegawa, J. and Yoshida, S. (2010) Analysis of Human Face Skin Surface Molecules in Situ by Fourier-Transform Infrared Spectroscopy. Skin Research and Technology, 16, 151-160. http://dx.doi.org/10.1111/j.1600-0846.2009.00414.x
- Yoshida, S., Yoshida, M., Yamamoto, M. and Takeda, J. (2013) Optical Screening of Diabetes Mellitus Using Non-Invasive Fourier-Transform Infrared Spectroscopy Technique for Human Lip. Journal of Pharmaceutical and Biomedical Analysis, 76, 169-176. http://dx.doi.org/10.1016/j.jpba.2012.12.009
- Simard, J.R., Zunszain, P.A., Hamilton, J.A. and Curry, S. (2006) Location of High and Low Affinity Fatty Acid Binding Sites on Human Serum Albmin Revealed by NMR Drug-Competition Analysis. Journal of Molecular Biology, 361, 336-351. http://dx.doi.org/10.1016/j.jmb.2006.06.028
- Petitpas, I., Grüne, T., Bhattacharya, A.A. and Curry, S. (2001) Crystal Structures of Human Serum Albumin Complexed with Monounsaturated and Polyunsaturated Fatty Acids. Journal of Molecular Biology, 314, 955-960. http://dx.doi.org/10.1006/jmbi.2000.5208
- Kshnyakina, S.I. and Puchkovskaya, G.A. (1980) Appearance of Methylene Chain Rocking Vibrations in the IR Spectra of Crystalline Dicarboxylic Acids. Journal of Applied Spectroscopy, 32, 56-59. http://dx.doi.org/10.1007/BF00611643
- Warren, C.H. and Hooper, D.L. (1973) Chain Length Determination of Fatty Acids by Raman Spectroscopy. Canadian Journal of Chemistry, 51, 3901-3904. http://dx.doi.org/10.1139/v73-581
Abbreviations
NOTES

*Corresponding author.