American Journal of Analytical Chemistry
Vol.5 No.4(2014), Article ID:43487,10 pages DOI:10.4236/ajac.2014.54027
HPLC Analysis of Monofluoro-S-Triazine Dye during the Dyeing Process
Dejana Javoršek1, Franci Kovač2, Marija Gorenšek1
1Department of Textiles, Faculty of Natural Sciences and Engineering, University of Ljubljana, Ljubljana, Slovenia
2Faculty of Chemistry and Chemical Technology, University of Ljubljana, Ljubljana, Slovenia
Email: dejana.javorsek@ntf.uni-lj.si, marija.gorensek@ntf.uni-lj.si, franci.kovac@fkkt.uni-lj.si
Copyright © 2014 by authors and Scientific Research Publishing Inc.
This work is licensed under the Creative Commons Attribution International License (CC BY).
http://creativecommons.org/licenses/by/4.0/


Received 15 January 2014; revised 20 February 2014; accepted 28 February 2014
ABSTRACT
In the research, the HPLC technique was applied in order to monitor the hydrolysis and dye-fibre bond-forming during the dyeing process. The results show that using a proper execution of calibration curves of the active and hydrolyzed form of the dye and defined equations, HPLC technique enable determining the exact amount of both dye forms anytime during dyeing. Dyeing process was performed in dyeing machine with use of combination of both alkalis—Na2CO3 and NaOH—and with use of one alkali—Na2CO3. It was established that NaOH causes additional hydrolysis of the dye and that the use of Na2CO3 is more appropriate for Novacron Scarlet F-3G dye. The temperature of adsorption has no influence on dye fixation; an amount of fixed dye on fibre is up to 83.0%.
Keywords:Monofluoro-S-Triazine Dye; HPLC Analysis; Adsorption; Fixation; Hydrolysis

1. Introduction
Reactive dyeing of cellulose materials represents a large progress in dyeing, due to the ability of dyes to form covalent bonds with nucleophilic groups of fibre. Reactive dyes have an equally complete pallet of colour shades as substantive dyes, yet their wet-fastness is far better. Therefore, reactive dyes are commonly used in their improved form with more reactive systems and massive chromogens [1] -[5] . For all that, during the dyeing process the hydrolysis of dyes in the dyebaths still occurs in a considerable extent. More than 50% of cost at reactive dyeing is intended for rinsing of the dyed material [6] . The experiments show that hydrolyzed reactive dyes cause problems in wastewaters, e.g. during the flocculation and coagulation, despite the agents being used for this purpose [7] . In spite of numerous hydrolysis studies of various reactive dyes with different reactive systems in various media and different dyeing conditions [8] -[14] , it seems that a theoretical analysis of impacts contributing to a positive fixation course of reactive dyes on a cellulose substrate should be performed. The cellulose substrate represents a large problem, since it prevents an easy passage of anionic dyes to the fibre surface due to the formation of the zeta potential on the fibre surface in an alkaline medium [15] . This problem is partly solved by masking the fibre charge with the addition of electrolyte, and with big planar chromogens of new reactive dyes [3] . Halogeno heterocyclic systems of dyes form bonds with cellulose fibres following the nucleophilic bimolecular heteroaromatic substitution mechanism [16] -[18] . The reaction is described as a base-catalyzed addition of the nucleophilic functional group of textile fibres to the electrophilic centre of the reactive group and the elimination of the leaving group.
Various factors influence the reaction mechanism, i.e. the chromogen structure, esp. the groups in the chromogen that are closer to the reactive system, the leaving group, solvent etc. The fixation of the reactive dye to cellulose fibres is the key phase in the dyeing process and is accomplished as a part of the dyeing process. It depends on the fibre structure, fibre porousness, dye substantivity according to the dye structure, dye diffusion, dye reactivity, degree of fibre preparation, dyeing liquor, alkali concentration, use of crosslinking agents, introduction of various chemical groups into fibre, chemical modification, aftertreatments etc. The degree of fixation and consequently the colour yield can be increased with the use of fixation accelerators and shorter liquid ratio, dyeing at low temperature, modification of chromophore and reactive group, use of dyes with high substantivity and high reactivity treating cellulose fibres with swelling agents [19] , and changing the morphology of fibres with a chemical modification [20] . It is known that a uniform rise in the fixation rate can be obtained by controlling the temperature of the dyeing process, adding alkali in stages, progressive metering of alkali, adding salt in stages etc. A basic problem that appears at dyeing of cellulose with reactive dyes is the reaction between the dye and water, i.e. hydrolysis, which is competitive with the reaction of the bond formation between the dye and textile substrate, i.e. fixation to fibres [21] .
The analysis of the model of the monofluoro-s-triazine dye in a dyebath at real fixation conditions with a high performance liquid chromatography (HPLC) can show a realistic occurrence during the dyeing process. Our previous research has already represented the kinetics of hydrolysis of the commercial and purified monofluoro-s-striazine dye [22] . So the chosen model of the reactive dye used in the research was not selected randomly. It represents a simple model for the reactive dye with a halogen heterocyclic reactive system. The behaviour of the dye in dyebath was investigated at different adsorption temperatures (50˚C, 60˚C, 70˚C and 80˚C) and two fixation temperatures (50˚C and 60˚C).
2. Experimental
2.1. Materials
A bleached cotton fabric (plain weave, 156 g/m2) produced by Tekstina d.d., Ajdovščina, Slovenia, was prepared for dyeing with reactive dyes: the treatment in distilled water, the neutralization in an acidic bath at 95˚C, boiling in distilled water, and two times rinsing in distilled water. The monofluoro-s-triazine dye (Novacron Scarlet F-3G, Mw = 713.6 g/mol) used in this research was supplied by Huntsman.
2.2. Methods
2.2.1. HPLC Analysis
The dye solutions were analysed on a high performance liquid chromatograph—HPLC (Thermo Separation Products). For the HPLC analysis, the ion-pair reversed-phase system and octadecil silane stationary phase in a 250 mm × 4 mm column (Hypersil ODS 5 mm) were used. The mobile phase comprised two solvents composed of A and B. The solvent A was 100% acetonitrile (Riedel-de Haën) with the addition of 0.025 M tetra-n-butyl ammonium bromide (Fluka Chemika) as the ion-pairing reagent. The solvent B was a mixture of 30% of the solvent A and 70% of W (bidistilled water with the addition of 0.05 M ammonium dihydrogenphosphate (Fluka)). The isocratic method with the mobile phase of solvent proportion 40A:60B was used [23] . The analysed sample quantity was always 20 ml.
All solutions and samples of the dyebath were filtered through a 0.45 mm PTFE filter prior to the HPLC analysis. The flow rate of the mobile phase through the column was 1.0 ml/min.
2.2.2. Execution of Calibration Curves on HPLC
The commercial dye was purified. It was two times recrystallised according to the method by Chavan [24] . Dimethylformamide (99%, Fluka Chemie AG)—tetrachloroethylene (99%, Fluka Chemie AG), a solvent-nonsolvent mixture was used to remove the inorganic salts. The purified active and hydrolyzed forms of the dye were used for the execution of calibration curves. The hydrolyzed form of the dye was produced by hydrolysis for 4 hours at 80˚C in a pH 12 buffer. Afterwards, the solution was neutralized with the diluted hydrochloric acid up to the pH value 7. For the execution of calibration curve for the active form of the dye, the purified dye was dissolved in a pH 7 buffer. Different concentrations of the solutions (from 0.002 g/l to 0.100 g/l) of purified and hydrolyzed dye were prepared. The filtered dye solutions were injected into the HPLC column and the area below the curve peak of the active and hydrolyzed form of the dye was determined. The dye, which was dissolved in the pH 7 buffer, contained the active and hydrolyzed form.
Therefore, it was necessary to subtract the area of the hydrolyzed dye and consider only the area below the curve peak of the active form of the dye at the execution of the calibration curve for the active form of the dye.
Those calibration curves of the active and hydrolyzed dye were used for the exact determination of both dye forms during the dyeing procedure.
2.2.3. Dyeing Procedure
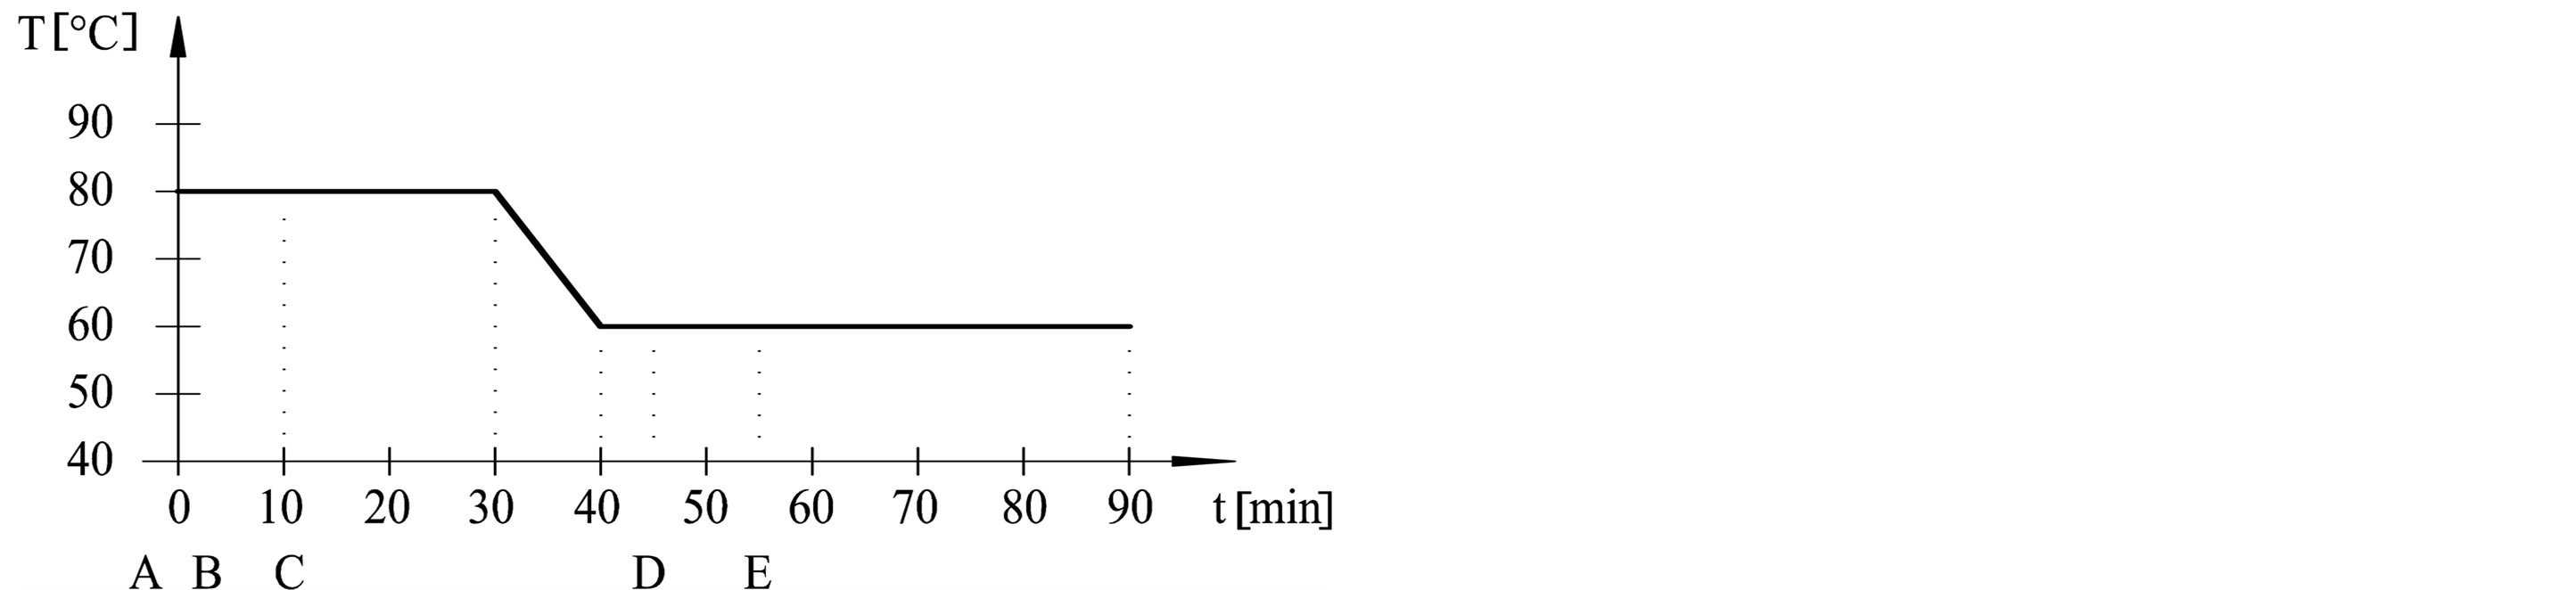
The dyeing procedures were performed in dyeing machine (Werner Mathis AG) at adsorption temperatures (50˚C, 60˚C, 70˚C and 80˚C) and fixation temperatures (50˚C and 60˚C). Procedures are outlined in Table 1 and Figure 1. Dyebath have consisted of: A—cotton fabric, B—3% dye, C—50 g/l Na2SO4, D—5 g/l Na2CO3, E— 1.9 ml/l NaOH 32.5%. Liquor ratio was 1:20.
After the addition of Na2CO3 and NaOH pH value of dye solutions was measured. After addition of Na2CO3, pH value was 11.1 and after addition of NaOH, pH value was 12.1.
The state of the dye in dyebath was determined with HPLC by defining the quantity of the active and hydrolyzed form of the dye after 30 minutes (before the addition of alkalis), after 55 minutes (after the addition of NaOH), after 65 minutes (10 minutes after the addition of NaOH) and after 90 minutes (at the and of dyeing process). These quantities were used for determining the quantity of the adsorbed dye and dye bonded to the fabric. Therefore, 10 ml of the dyebath was withdrawn from dyebath process in different intervals into a 25 ml flask. 10 ml of solution was neutralized to pH 7 with 0.1 M HCl (Kemika) and diluted with up to 25 ml of bidistilled water.
At the end of dyeing procedure, the fabric was rinsed and soaped according to the dye producer's recommendations: 10 min of cold rinsing, 10 min of neutralization at 60˚C with the solution of 1 ml/l CH3COOH 30% (Riedel-de Haën), 15 min of soaping at 90˚C with the addition of 2 g/l Cibapon R (Huntsman), 10 min of rinsing at 80˚C, 10 min of rinsing at 60˚C and 10 min of cold rinsing. All phases were performed at 1:40 liquor ratio. The quantities of the active and hydrolyzed form of the dye in the rinsing baths were determined with HPLC as well.
2.2.4. Calculation of Quantities of the Active and Hydrolyzed Dye
In this research, the proportion of the active and hydrolyzed dye was determined on the basis of previously formed calibration curves with HPLC (Y = 39279 + 8.2 × 10¹⁰X for the active dye and Y = 11517 + 7.8 × 10¹⁰X for the hydrolyzed dye).
The quantity of the active form of the dye adsorbed on the fabric was calculated by using Equation (1):
 (1)
(1)
where
 : is quantity of active form of dye in dyebath at the beginning of dyeing,
 : is quantity of active form of dye in dyebath at the end of dyeing,
 : is quantity of active form of dye adsorbed on fabric.
The quantity of the active form of the dye bonded on the fabric was calculated by using Equation (2):
 (2)
(2)
where

Table 1. Dyebath procedure (A—cotton fabric, B—3% dye, C—50 g/l Na2SO4, D—5 g/l Na2CO3, E—1.9 ml/l NaOH 32.5%).
 (a)
(a)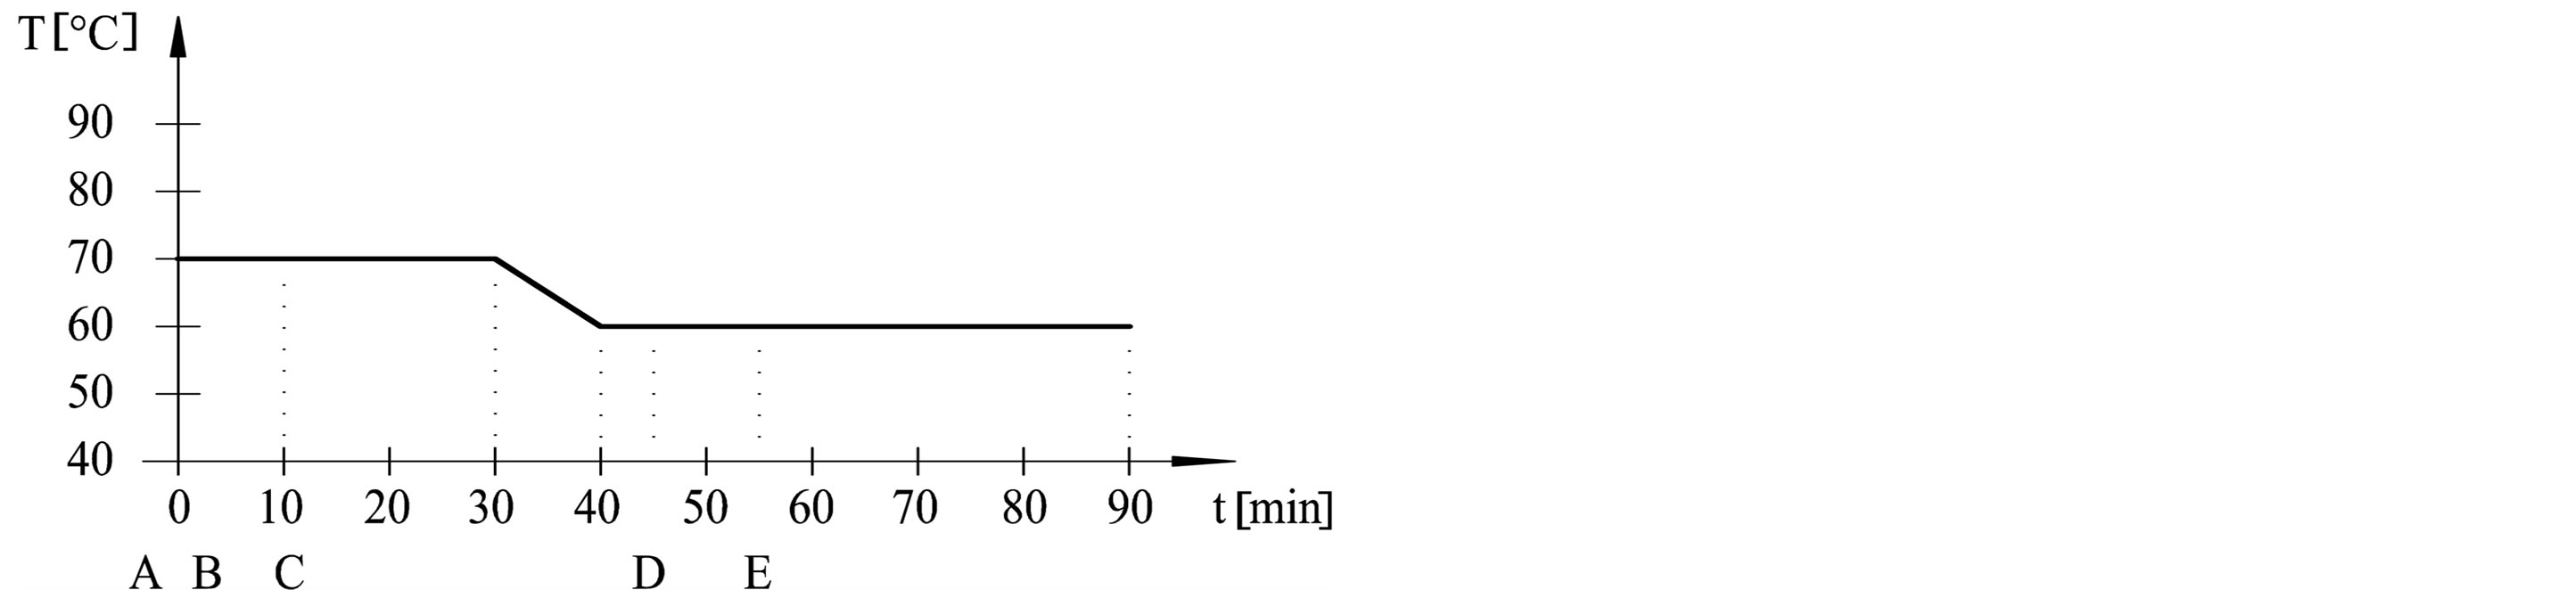 (b)
(b)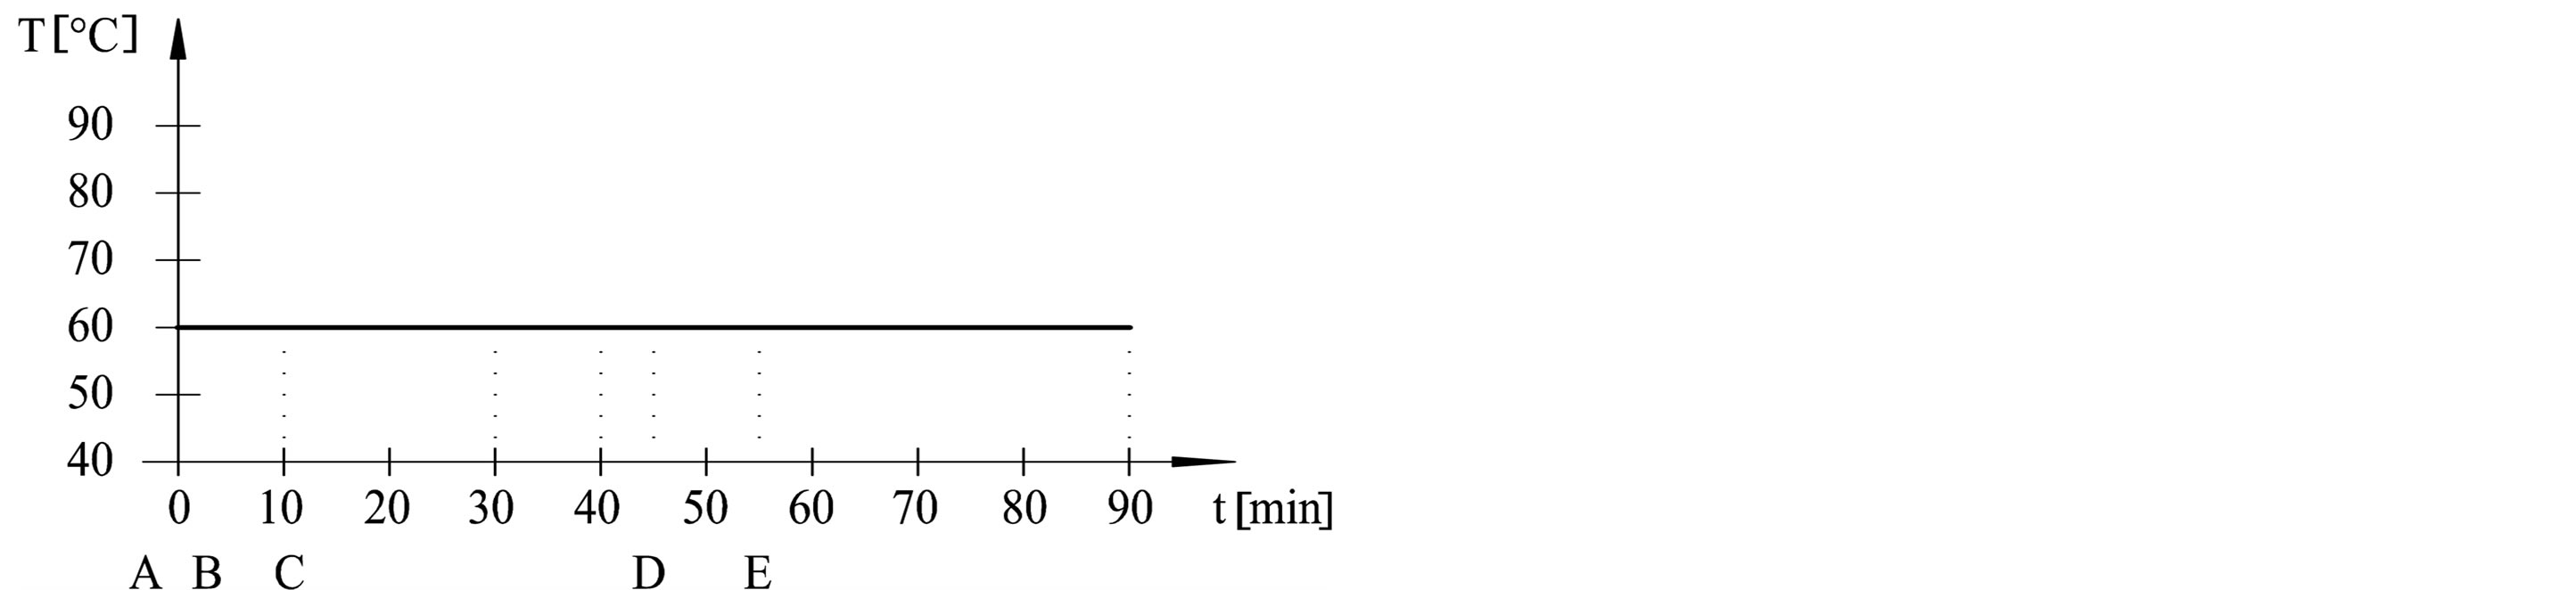 (c)
(c)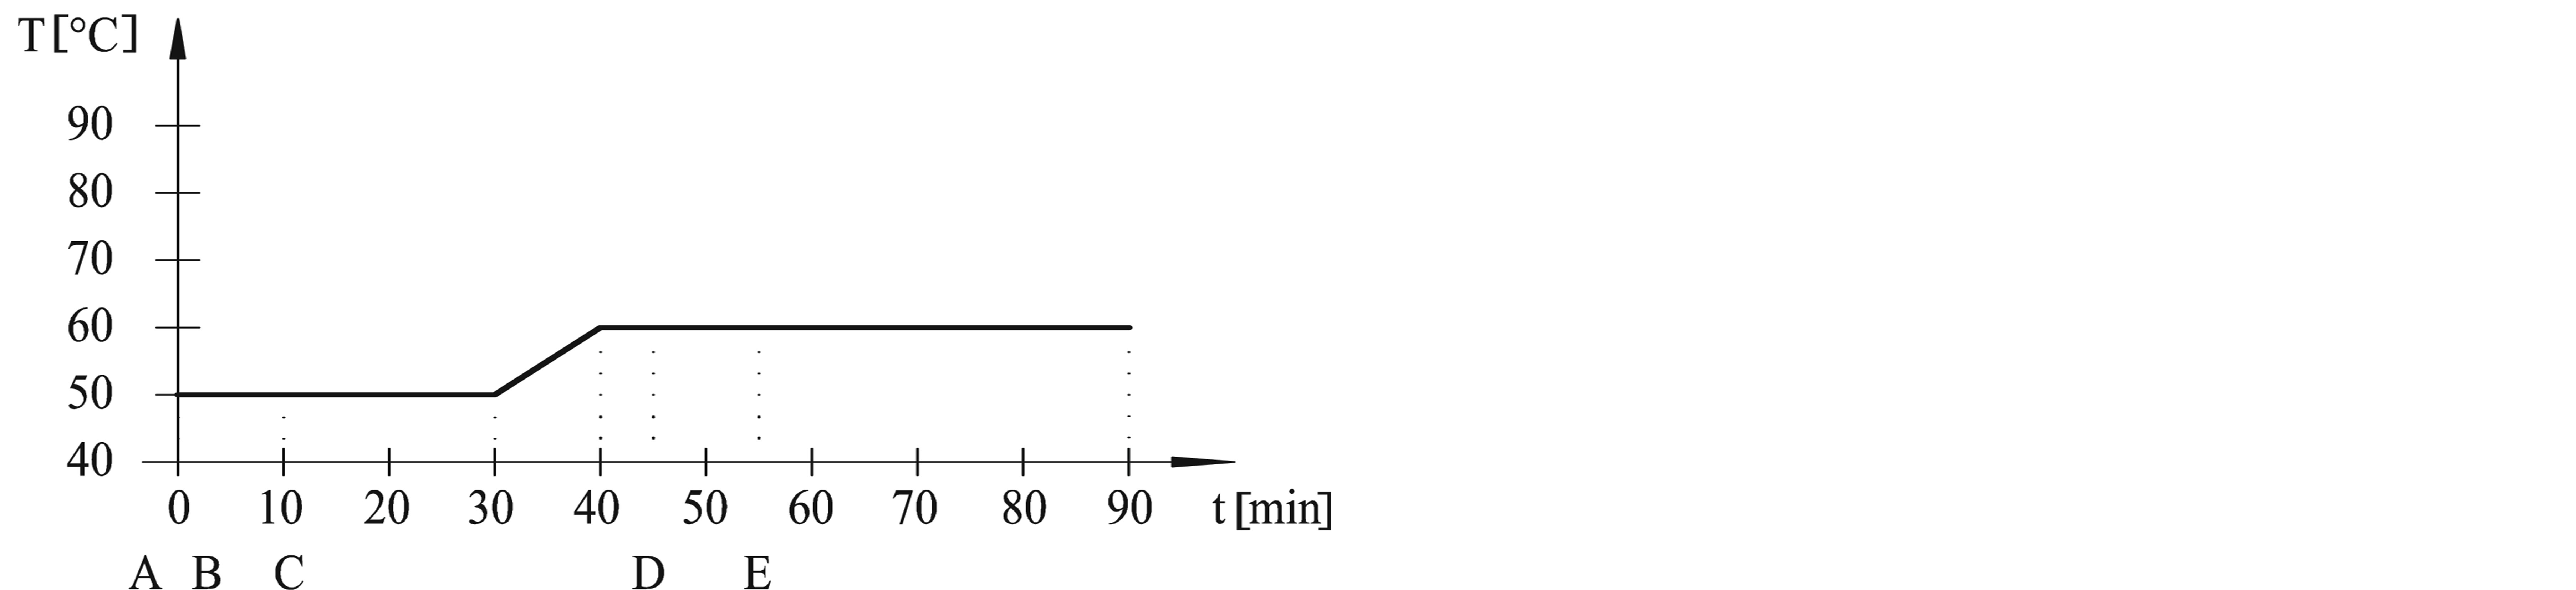 (d)
(d)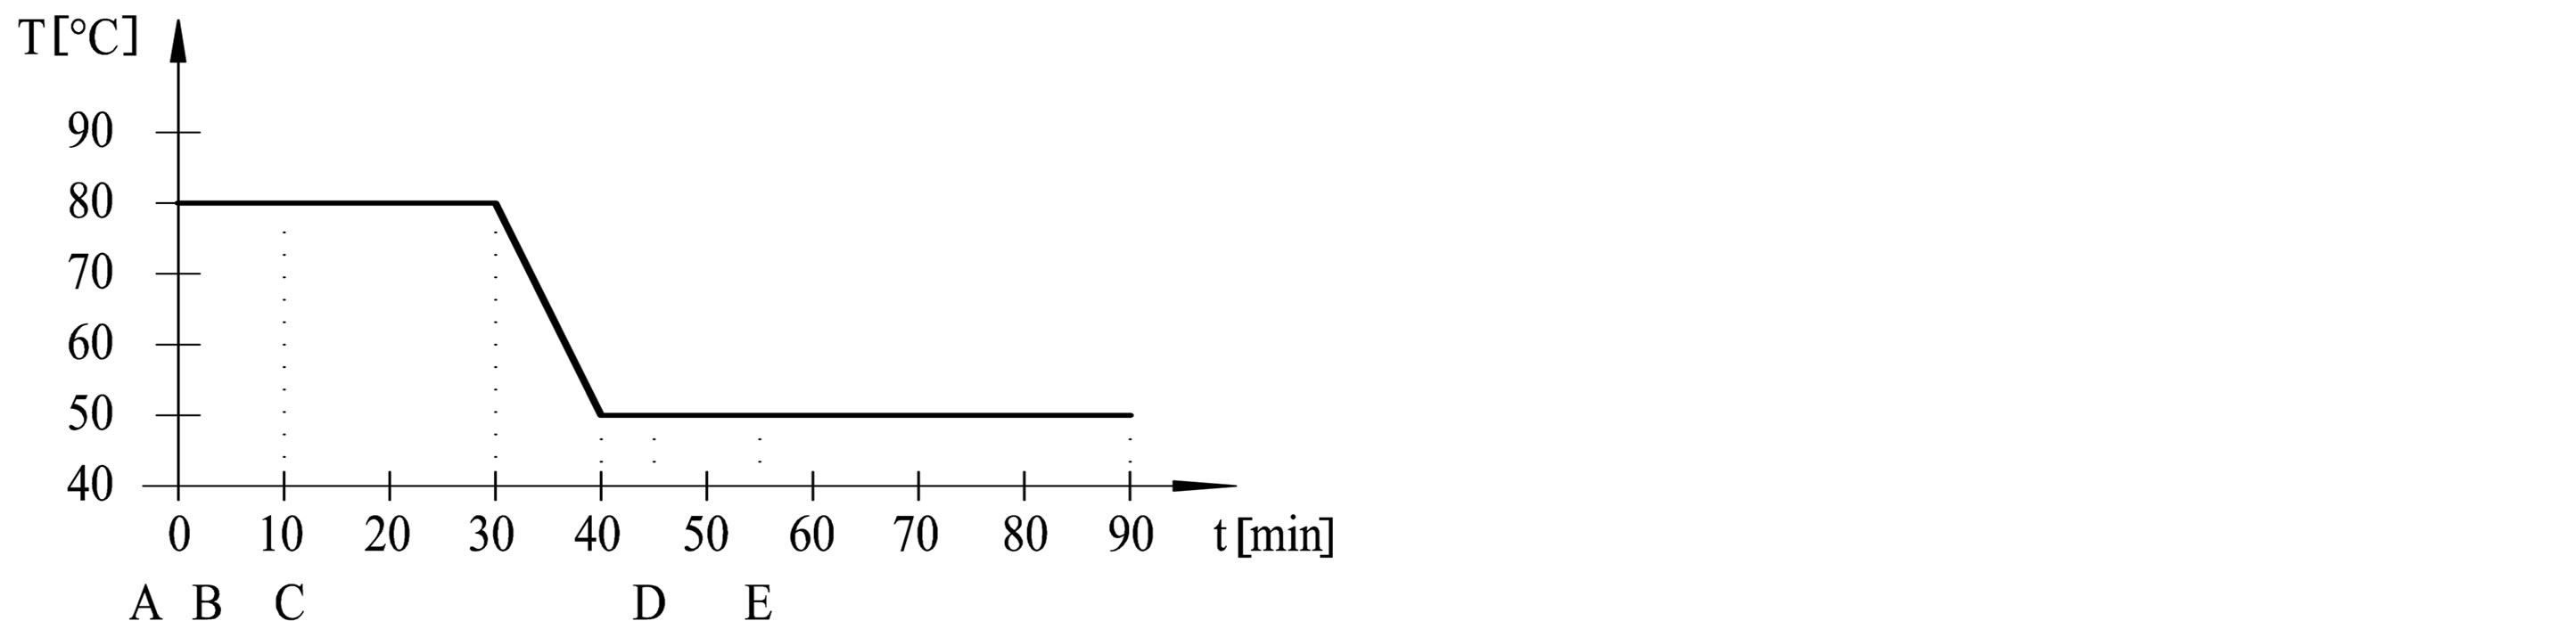 (e)
(e)
Figure 1. Dyeing procedures from (a) to (e).
 is quantity of active form of dye bonded on fabric,
 is sum of quantities of active form of dye in rinsing baths.
The quantity of the hydrolyzed form of the dye adsorbed on the fabric was calculated by using Equation (3):
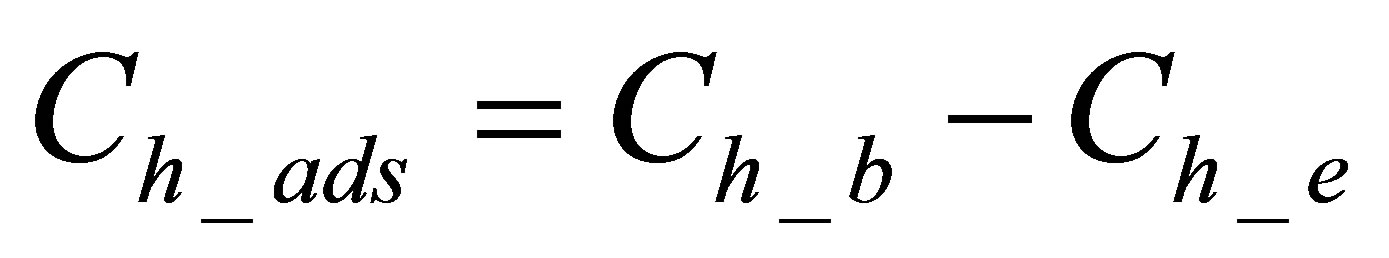 (3)
(3)
where
 is quantity of hydrolyzed form of dye in dyebath at the beginning of dyeing,
 is quantity of hydrolyzed form of dye in dyebath at the end of dyeing,
 is quantity of hydrolyzed form of dye adsorbed on fabric.
The quantity of the hydrolyzed form of the dye bonded on the fabric was calculated using Equation (4):
 (4)
(4)
where
 is quantity of hydrolyzed form of dye that is fixated on fabric,
 is sum of quantities of hydrolyzed form of dye in rinsing baths.
2.2.5. The Dye Bath Exhaustion Percentage and the Total Dye Utilization Percentage
The reflectance responses at all wavelengths were measured by using Spectrophotometer Datacolor Spectraflash, SF600. The reflectance value (R) of dyed fabric at the maximum wavelength was taken and the K/S values were calculated. The calculation of Kubelka Munk values are given in Equation (5):
 (5)
(5)
With HPLC analysis and remission spectrophotometer (Varian Cary 1E), the dye bath exhaustion percentage (%E) was calculated using Equation (6) and the total dye utilization percentage (%T) was calculated using Equation (7).
 (6)
(6)
Values  and
and  represented quantity of dye in dyebath at the beginning of dyeing and at the end of dyeing.
  and
and  is the color yield with the values before and after rinsing and soaping procedure.
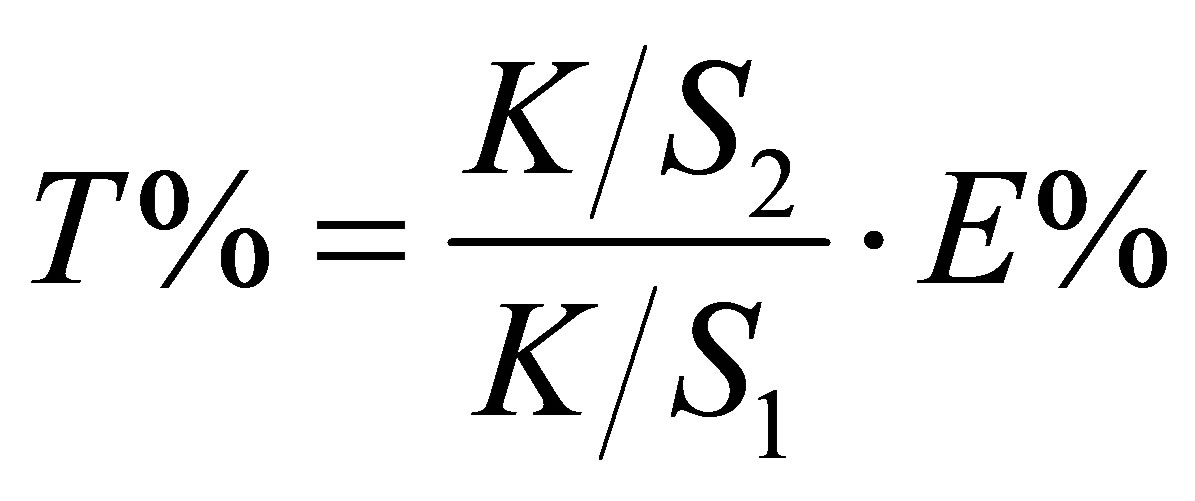 (7)
(7)
3. Results
3.1. Analysis of Dye Forms in Dyebath
Dyeing procedure was performed at different adsorption temperatures (50˚C, 60˚C, 70˚C and 80˚C) and fixation temperatures (50˚C and 60˚C). The state of the dye in dyebath was determined at the beginning, after 30 minutes (before the addition of alkali), after 55 minutes (after the addition of NaOH), after 65 minutes (10 minutes after the addition of NaOH) and after 90 minutes (at the and of dyeing process). For defining the exact amount of an active and hydrolyzed form of the dye an extremely important method with execution of calibration curves was used.
Figures 2-6 show the results of dye analysis during the dyeing procedure (Figure 1). Ch is quantity of hydrolyzed form of dye in dyebath [mol/l], Ca is quantity of active form of dye in dyebath [mol/l] and Cf is quantity of dye adsorbed on fabric [g/g].
From the research results, it could be concluded that after the addition of both alkalis (after 55 minutes), in dyebath remained 4% - 7% of active dye form at fixation temperature 60˚C and 15.2% of active dye form at fixation temperature 50˚C. At both temperatures an active dye form completely disappeared from dyebath after 65 minutes in a case when both alkalis (Na2CO3 and NaOH, pH 12.1) were used.
At procedures when only one alkali (Na2CO3) was used, pH of dyebath achieved values 11.1, which means that dye hydrolysed slower than in case when both alkalis were used. In that case in dyebath remained 10% - 14% of active dye form after 55 minutes and approximately 3% of active dye form after 65 minutes.
After 90 minutes at fixation temperature 60˚C in dyebath remained approximately 15% - 18% of hydrolyzed dye form when both alkalis were used and 12% - 16% of hydrolyzed dye form when only Na2CO3 was used.
Results of Cf value show that after 90 minutes quantity of dye adsorbed on fabric is slightly smaller in case when both alkalis were used than in case when only Na2CO3 was used.
3.2. Analysis of Dye on Fabric
With HPLC analysis and remission spectroscopy, the dye bath exhaustion percentage (%E) and the total dye utilization percentage (%T), was determined. Results are represented in Figure 7.
From Figure 7 it is evident that adsorption temperature had no influence on reaction between dye and fibres, however up to 83.0% of dye adsorbed on fibres. In a case of dyeing procedures when both alkalis were used, the dye bath exhaustion percentage (%E) was slightly lower than in case when only Na2CO3 was used.
The dyeing procedures when adsorption temperatures 80˚C, 70˚C and 60˚C in combination with fixation temperature 60˚C and addition of both alkalis, were performed, the total dye utilization percentage (%T) was up to 66%. The same procedures without addition of NaOH showed better results, which mean that higher value of %T was achieved, approximately 80%. The difference in %T value between procedure d (Figure 1(d)) (adsorption temperature 50˚C and fixation temperature 60˚C) with addition of NaOH and the same procedure without addition of NaOH, was small, 5%. Procedure e (Figure 1(e)) (adsorption temperature 80˚C and fixation temperature 50˚C) with and without NaOH also gives good results of %T, approximately 78%, which is only 5% lower than %T value at procedure d (Figure 1(d)).
However, from the results it could be concluded that addition of NaOH caused extra hydrolysis and that the use of only Na2CO3 was more appropriate for dye used in our research.
According to standard ISO 105 C03 test for colourfastness at 60˚C was performed. The change in colour of the specimen and the staining of the adjacent fabric were assessed with the grey scales and all samples got value 4 whether only Na2CO3 or both alkalis were used.
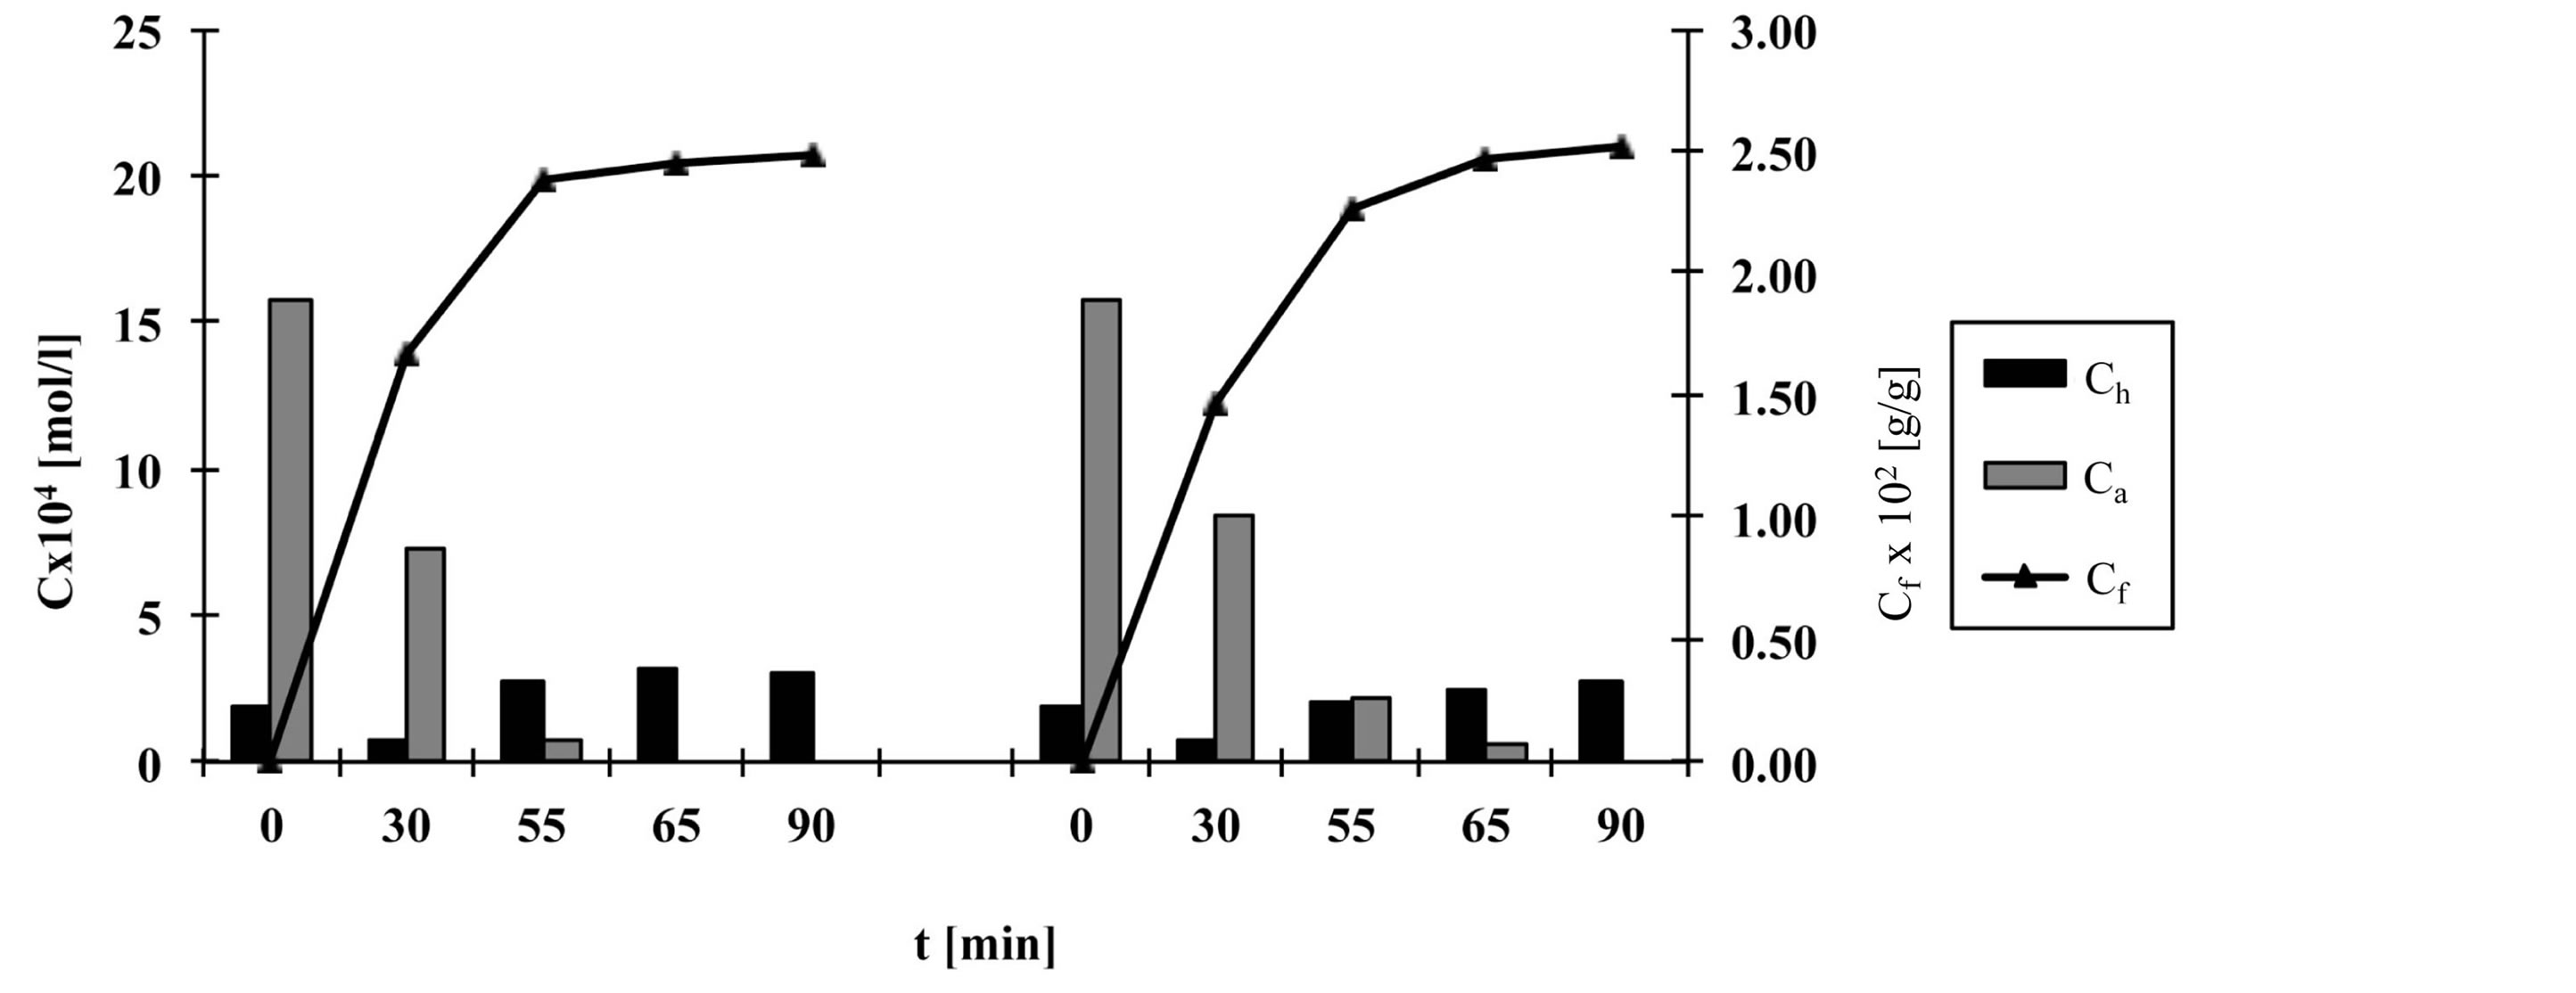
Figure 2. The quantity of hydrolyzed and active dye forms in dyebath and quantity of dye adsorbed on fabric during procedure a, left—with Na2CO3 and NaOH, right—with Na2CO3.
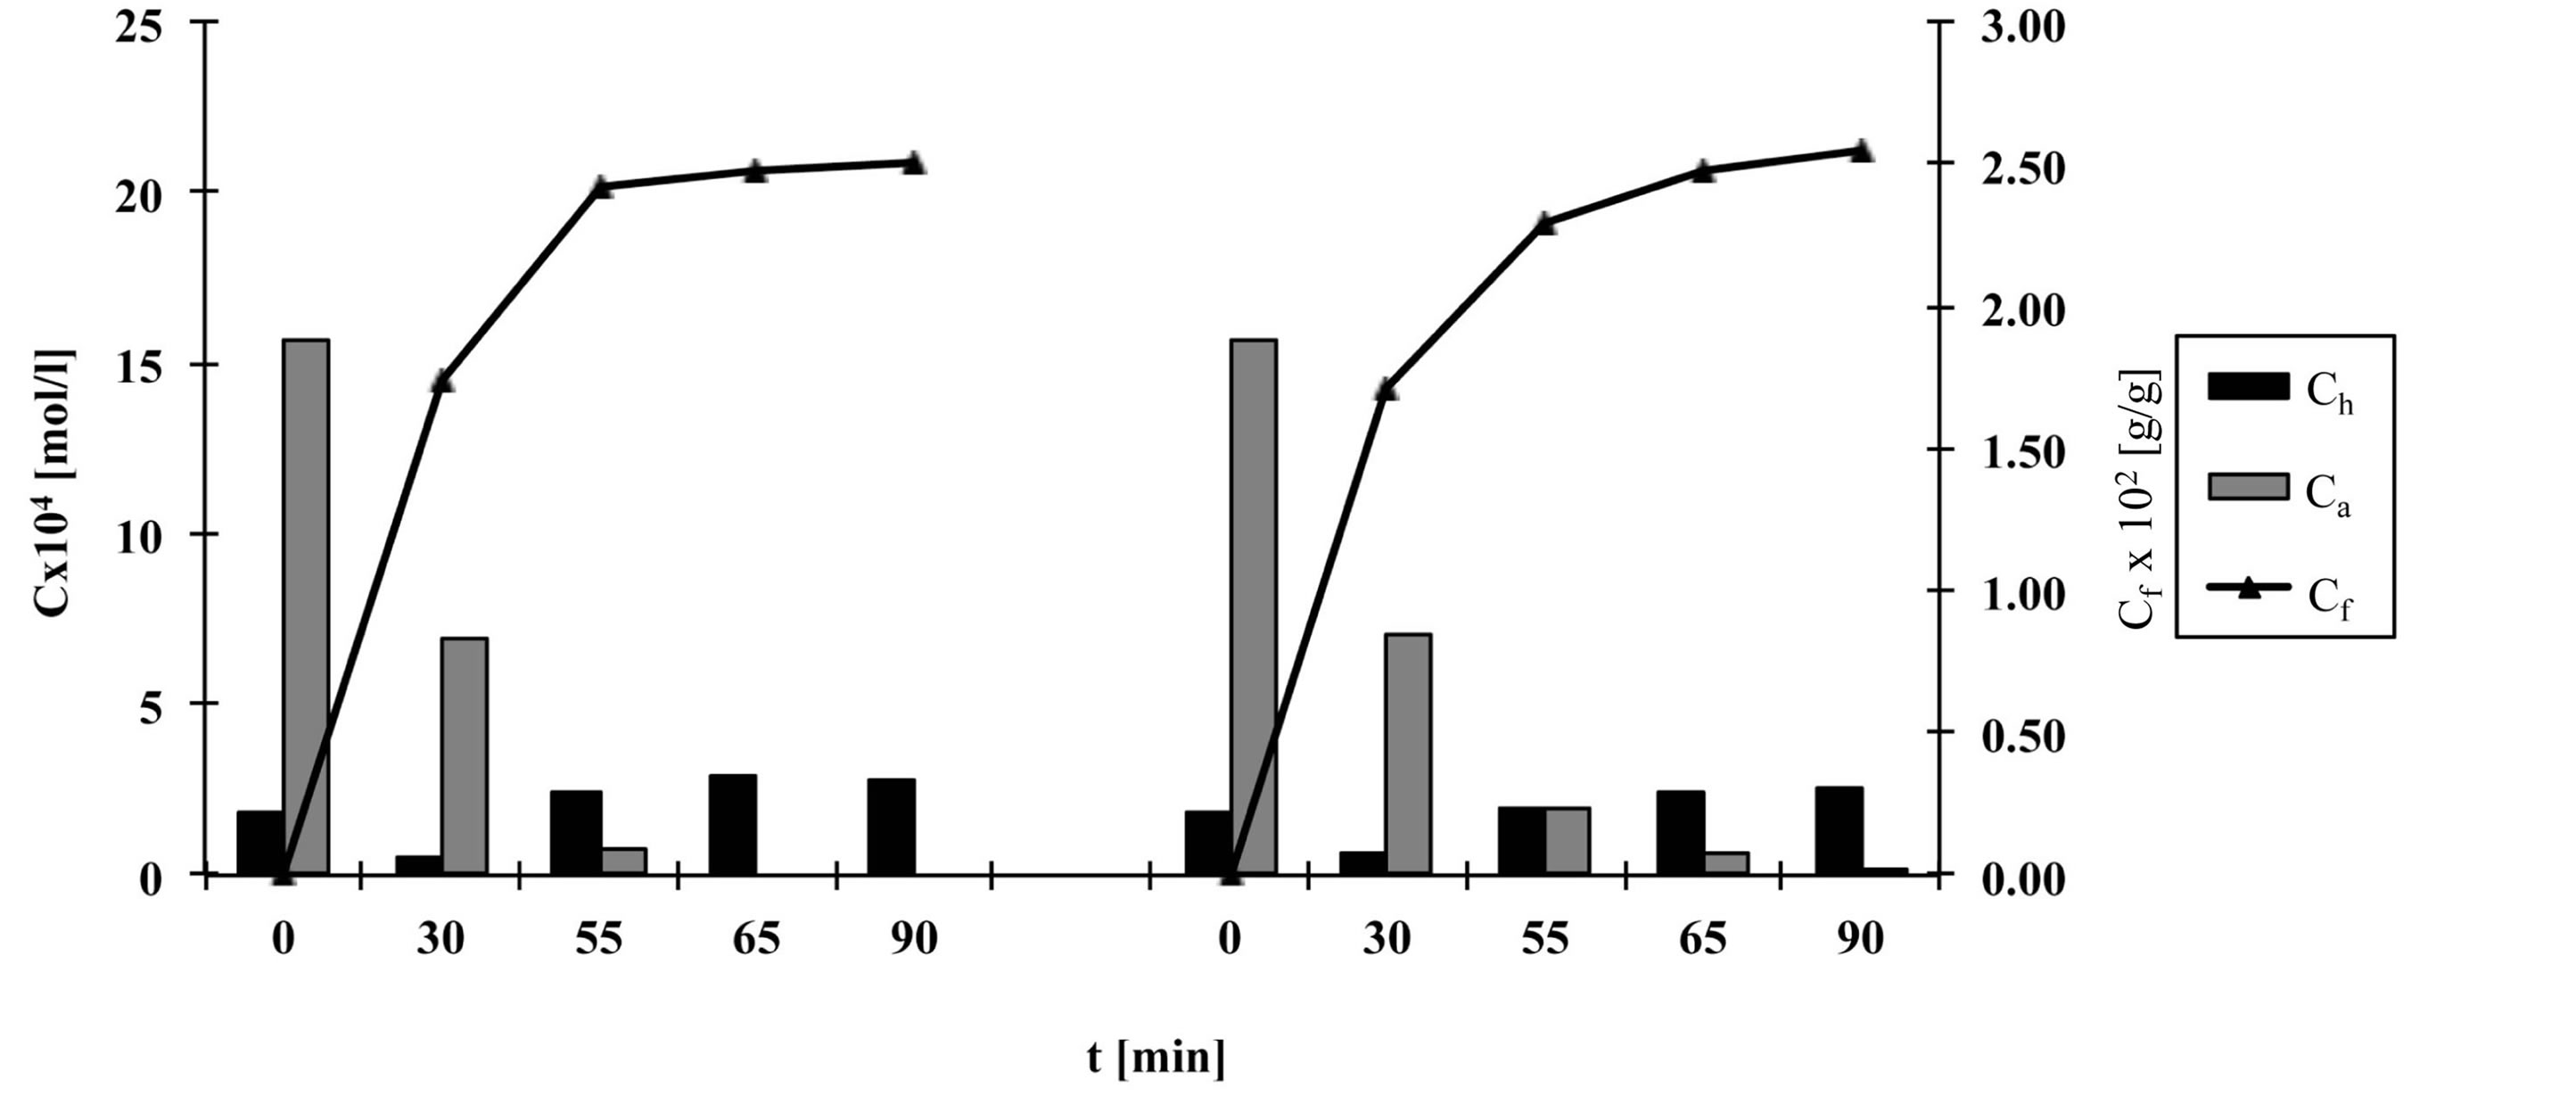
Figure 3. The quantity of hydrolyzed and active dye forms in dyebath and quantity of dye adsorbed on fabric during procedure b, left—with Na2CO3 and NaOH, right—with Na2CO3.
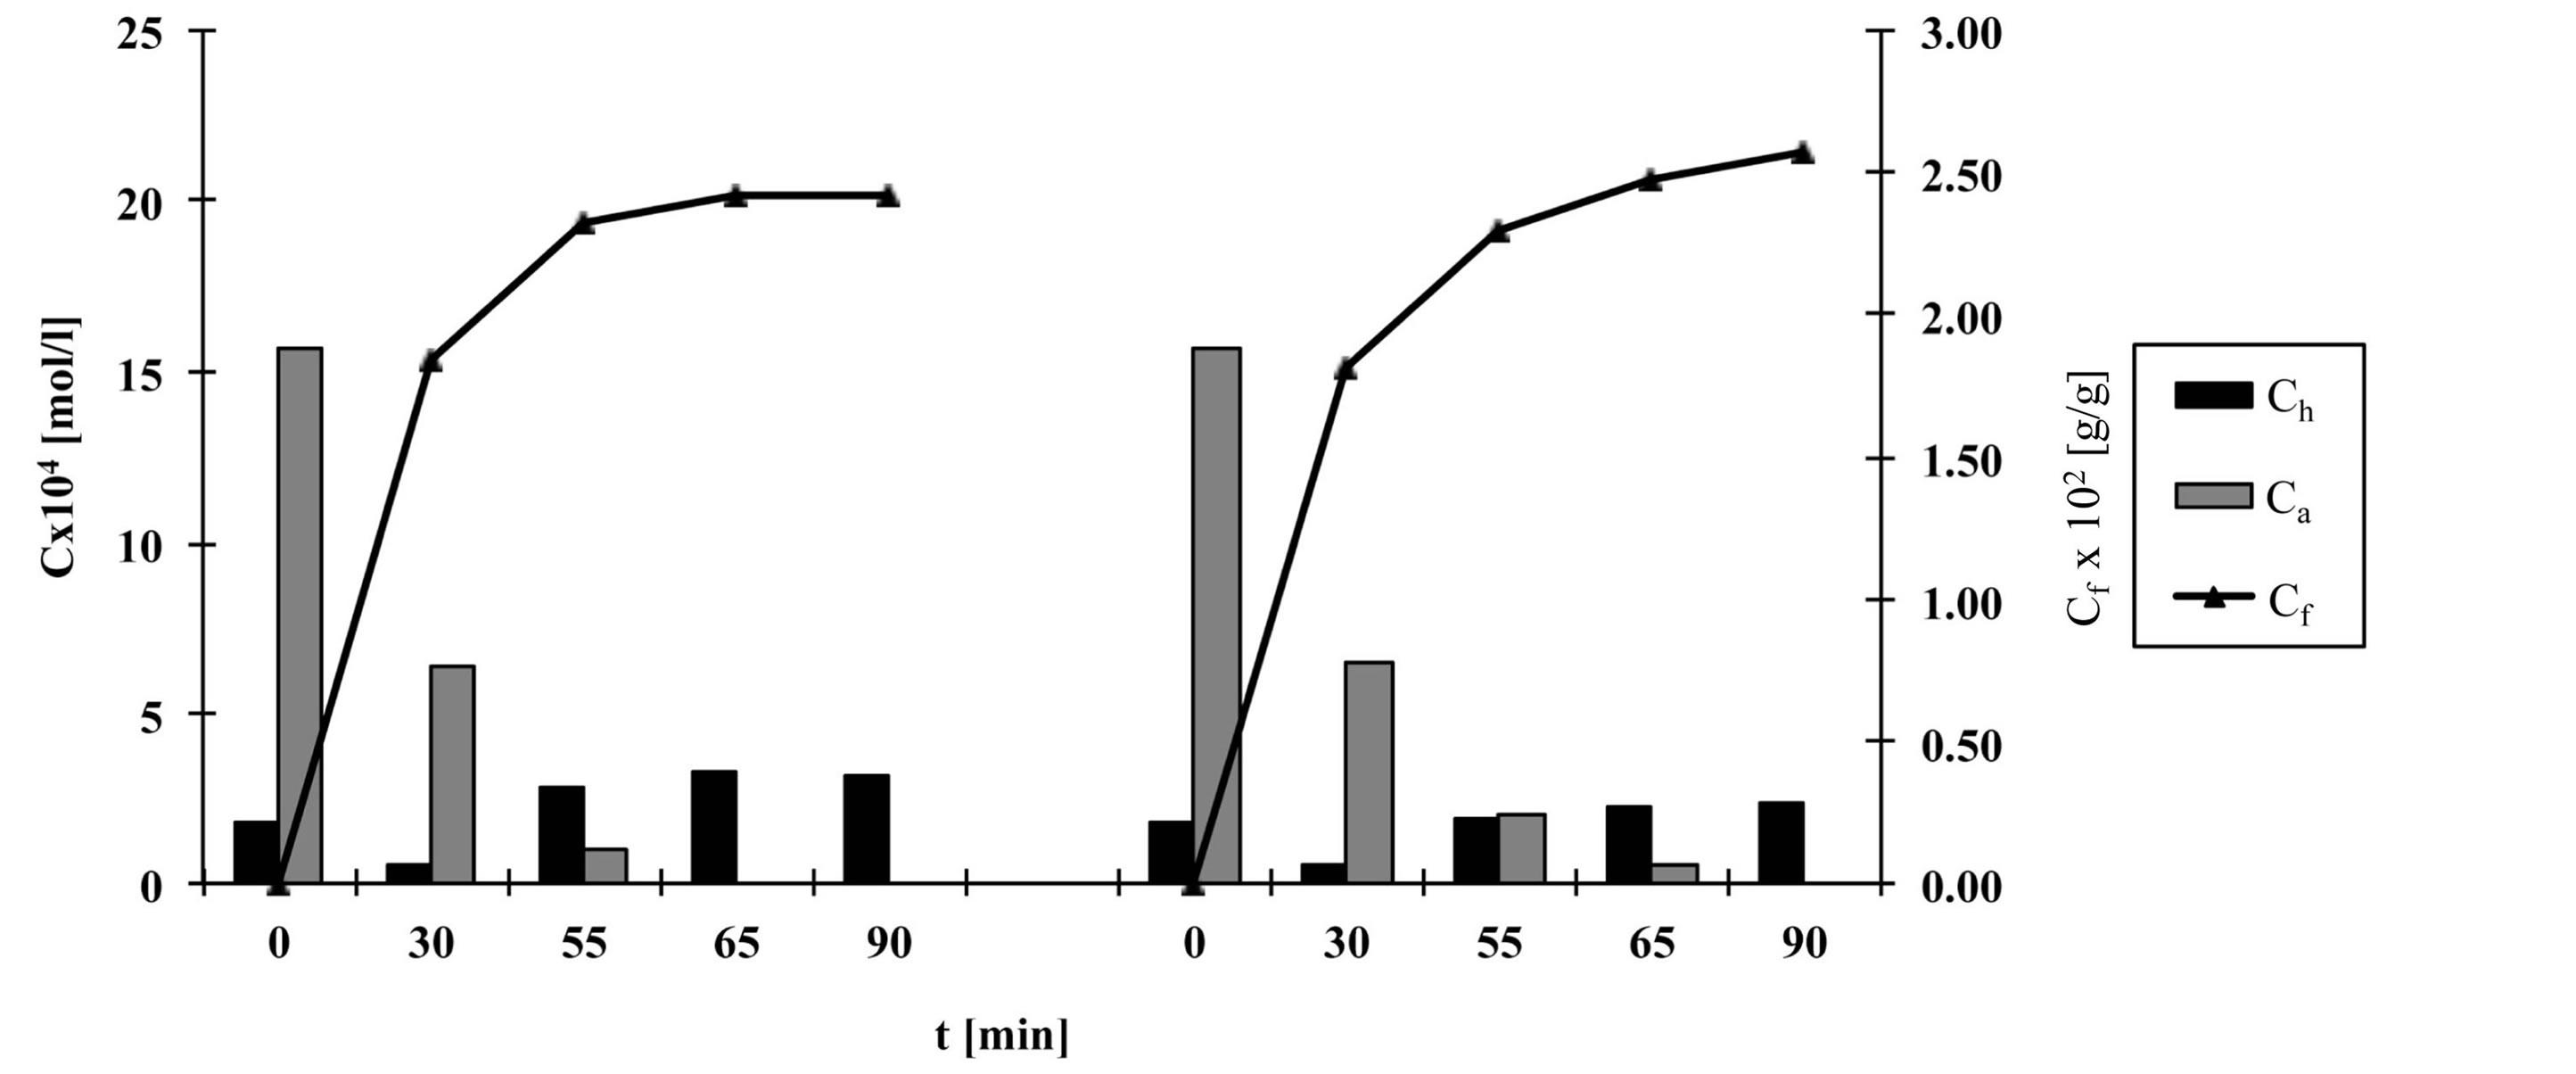
Figure 4. The quantity of hydrolyzed and active dye forms in dyebath and quantity of dye adsorbed on fabric during procedure c, left—with Na2CO3 and NaOH, right—with Na2CO3.
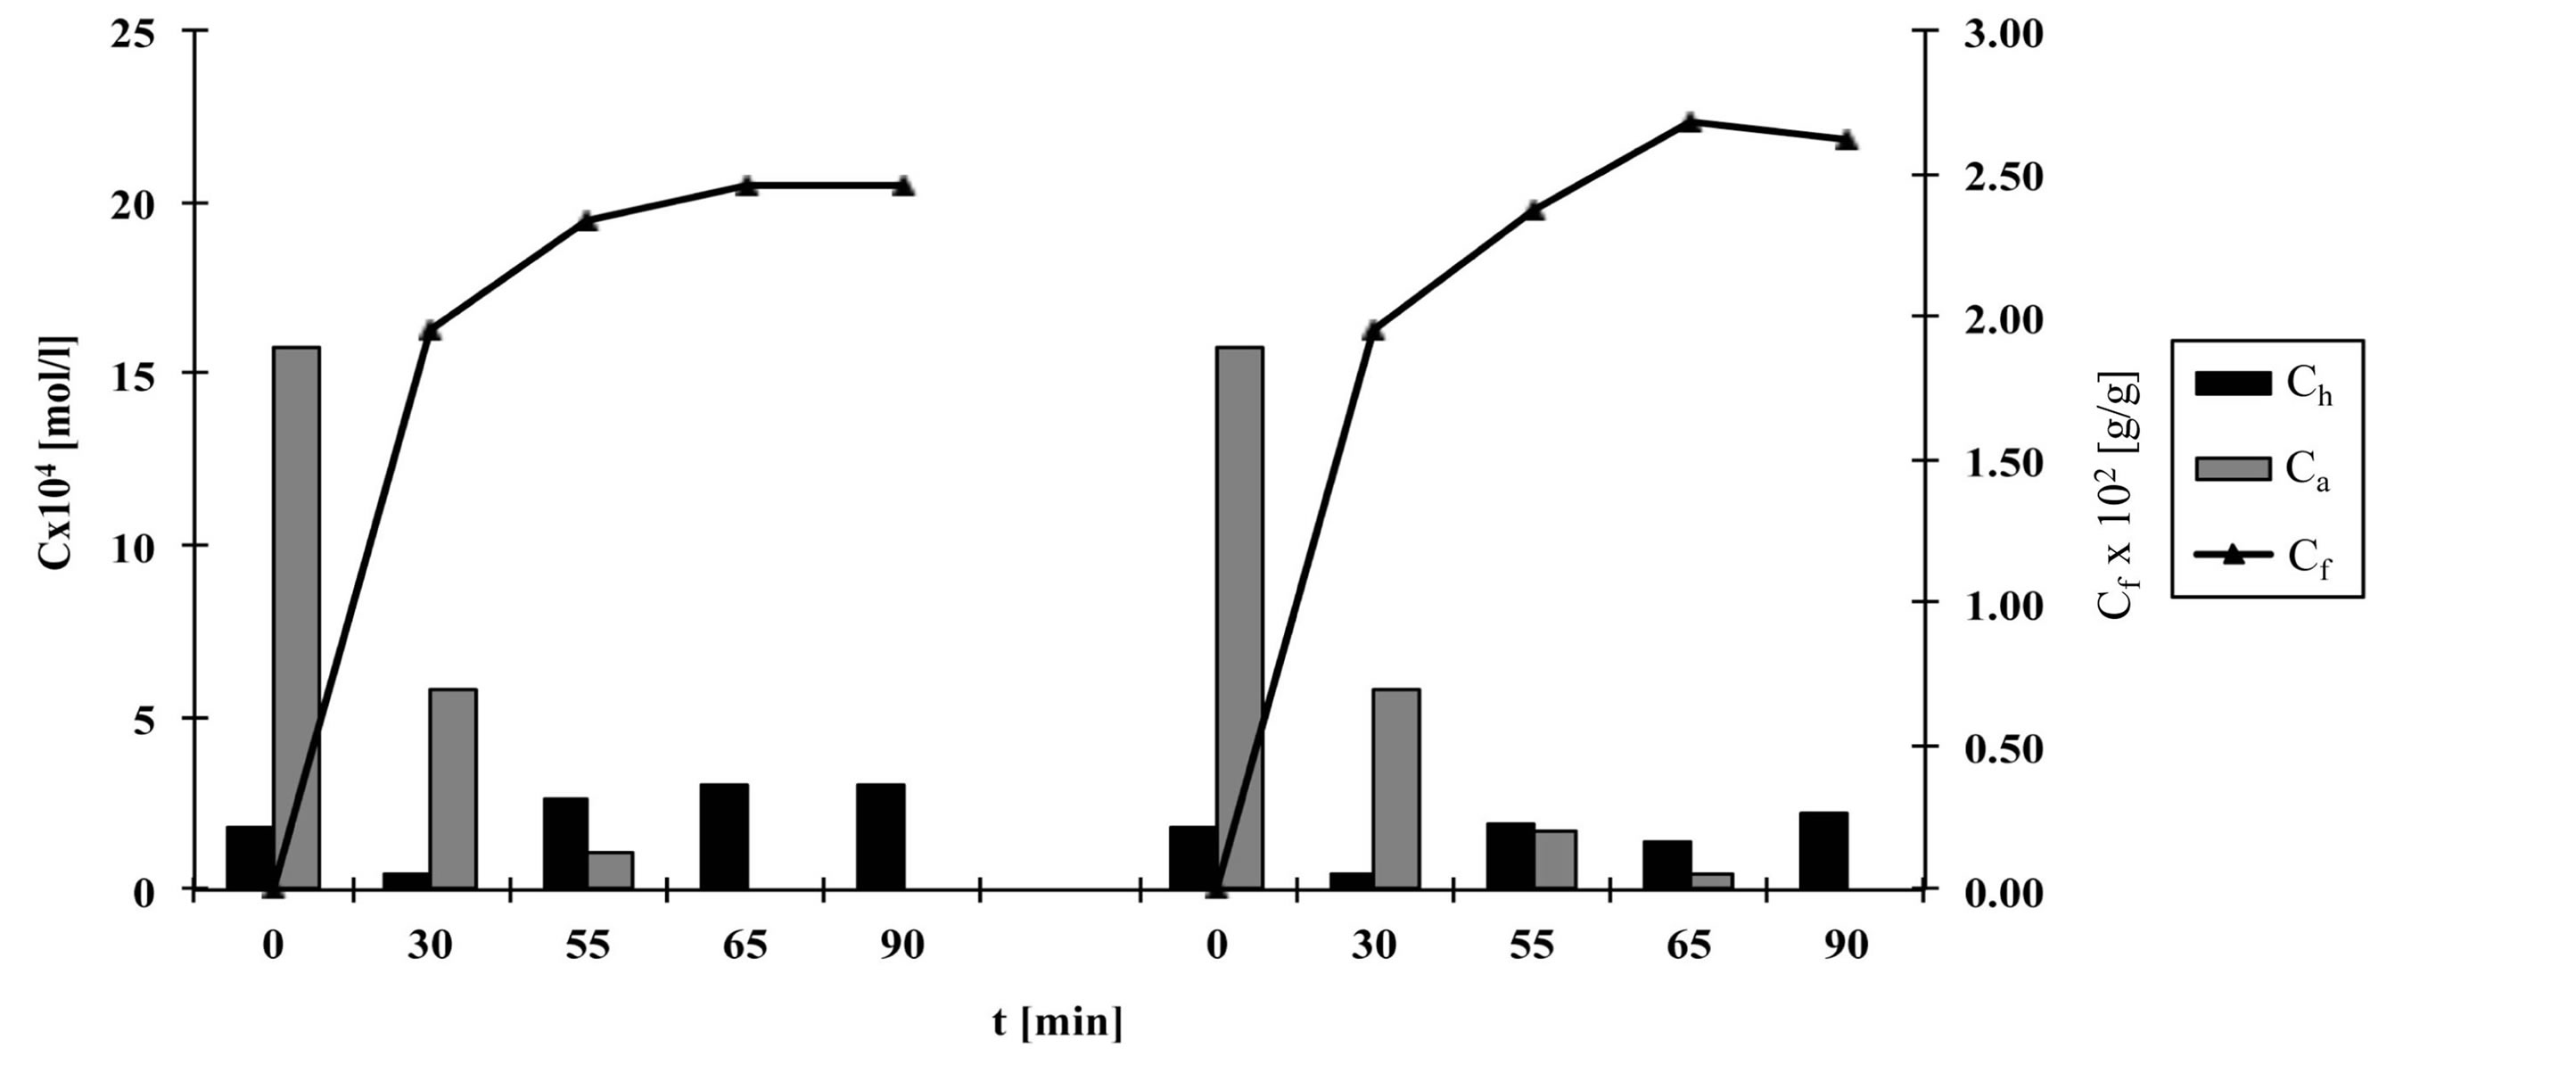
Figure 5. The quantity of hydrolyzed and active dye forms in dyebath and quantity of dye adsorbed on fabric during procedure d, left—with Na2CO3 and NaOH, right—with Na2CO3.
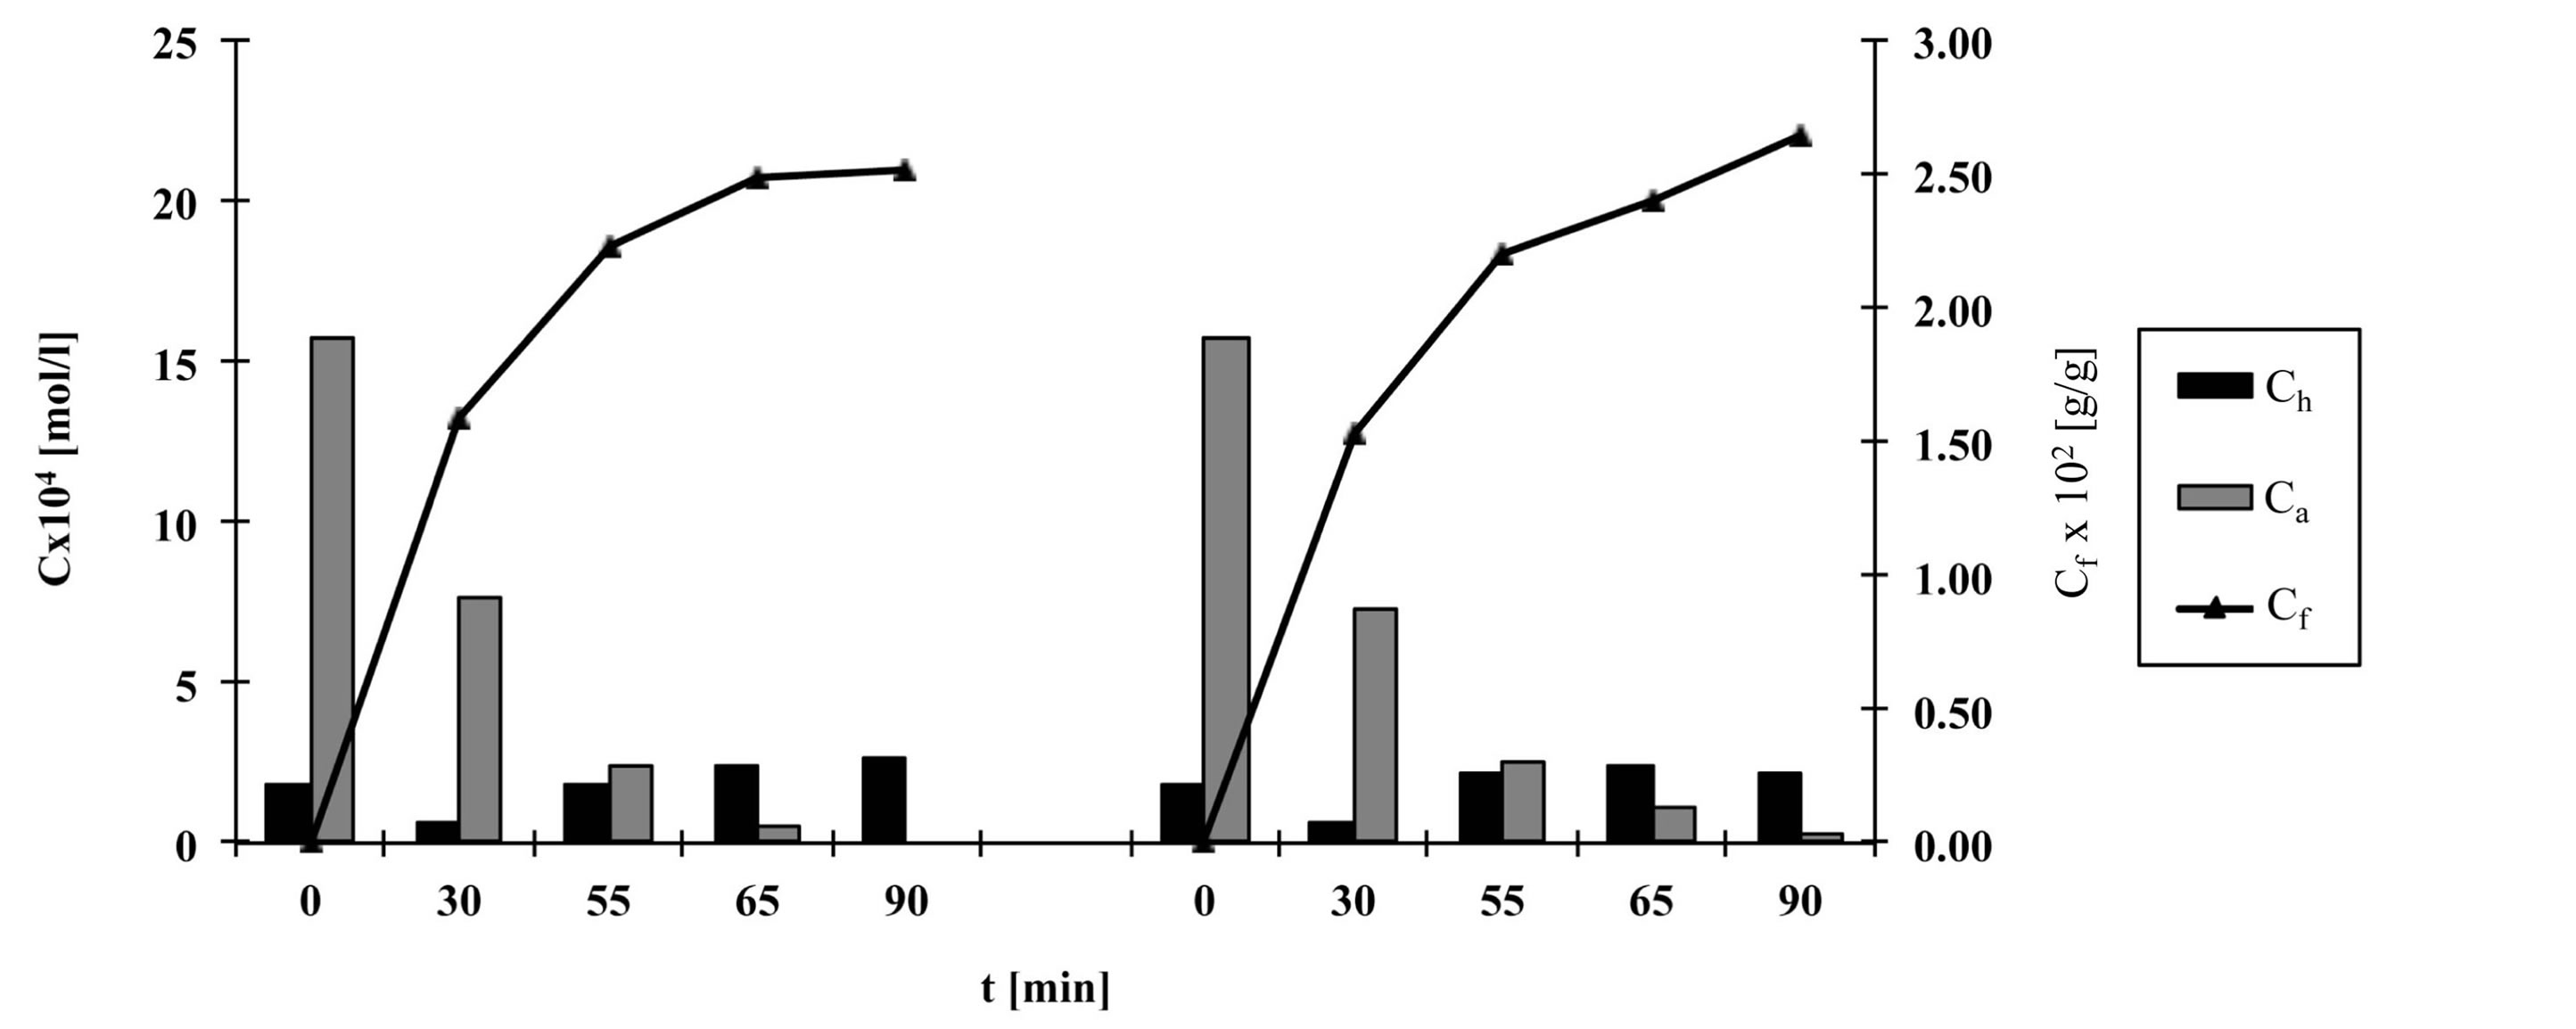
Figure 6. The quantity of hydrolyzed and active dye forms in dyebath and quantity of dye adsorbed on fabric during procedure e, left—with Na2CO3 and NaOH, right—with Na2CO3.
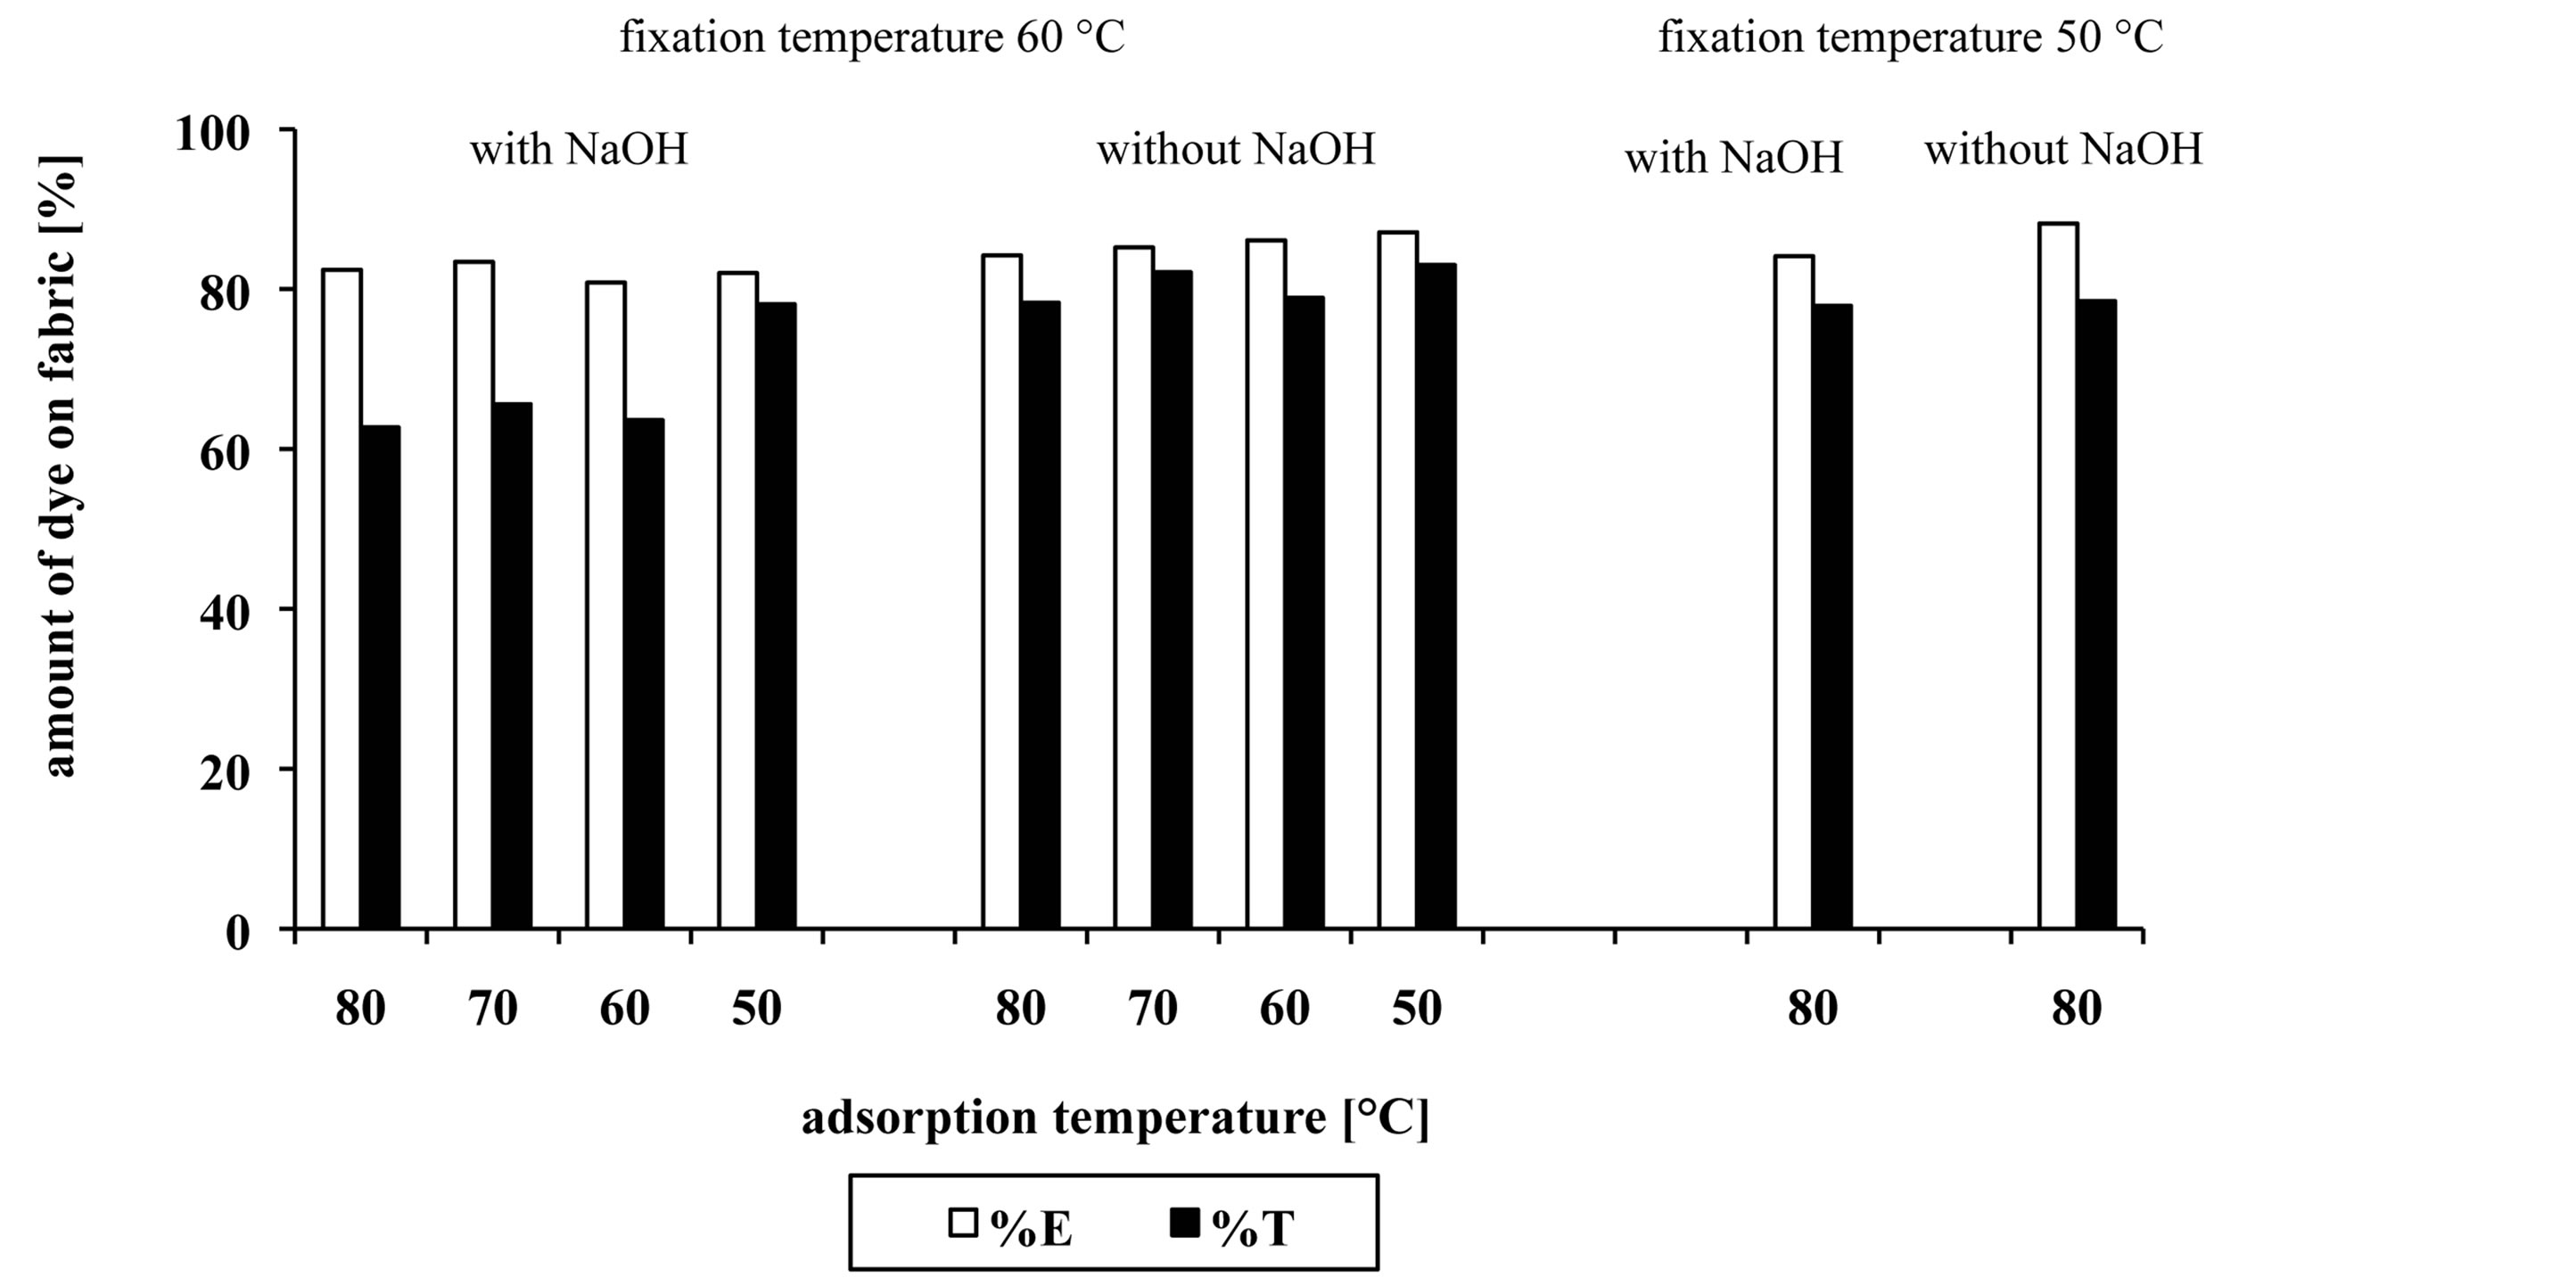
Figure 7. The dye bath exhaustion percentage (%E) and the total dye utilization percentage (%T) of dyed samples.
 (a)
(a)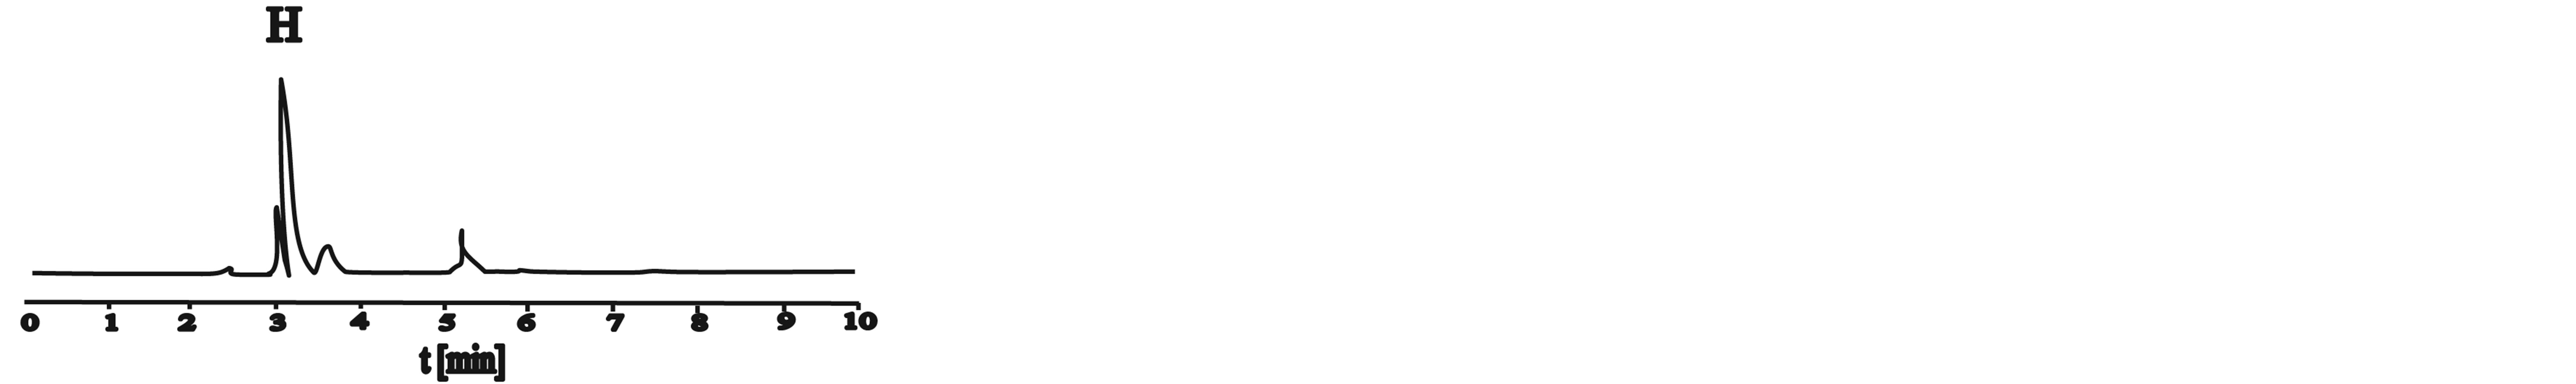 (b)
(b)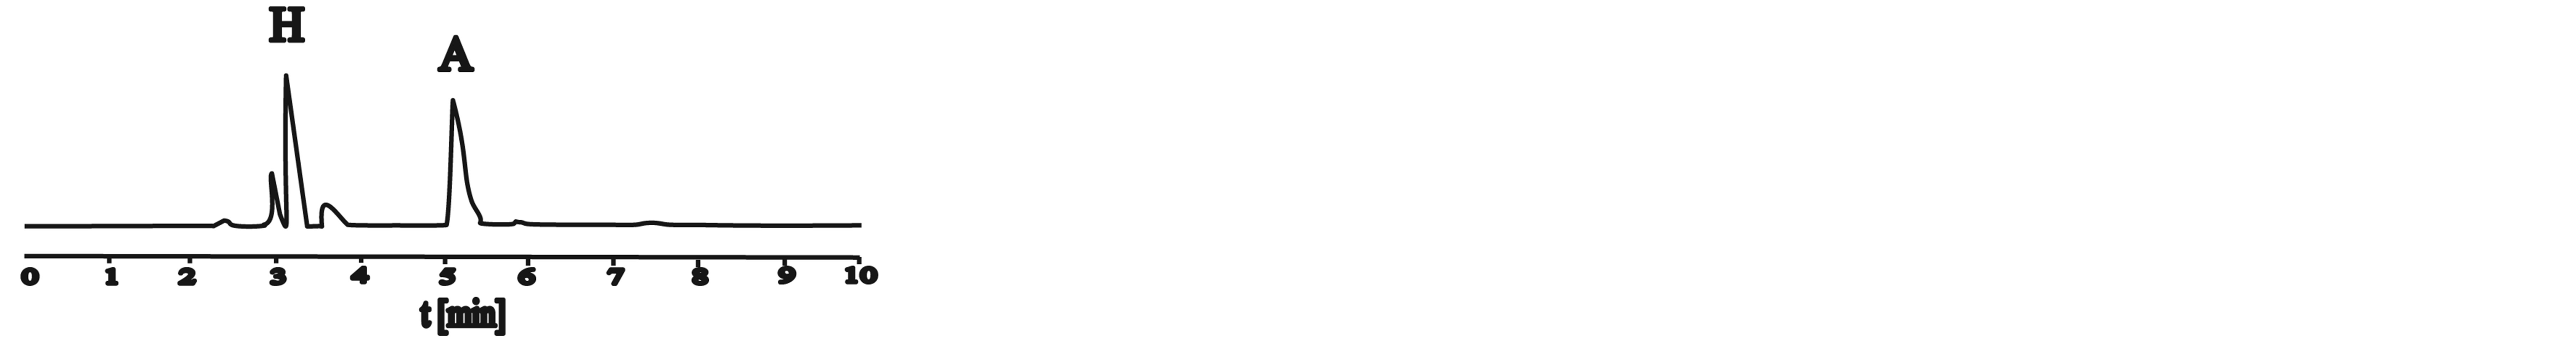 (c)
(c)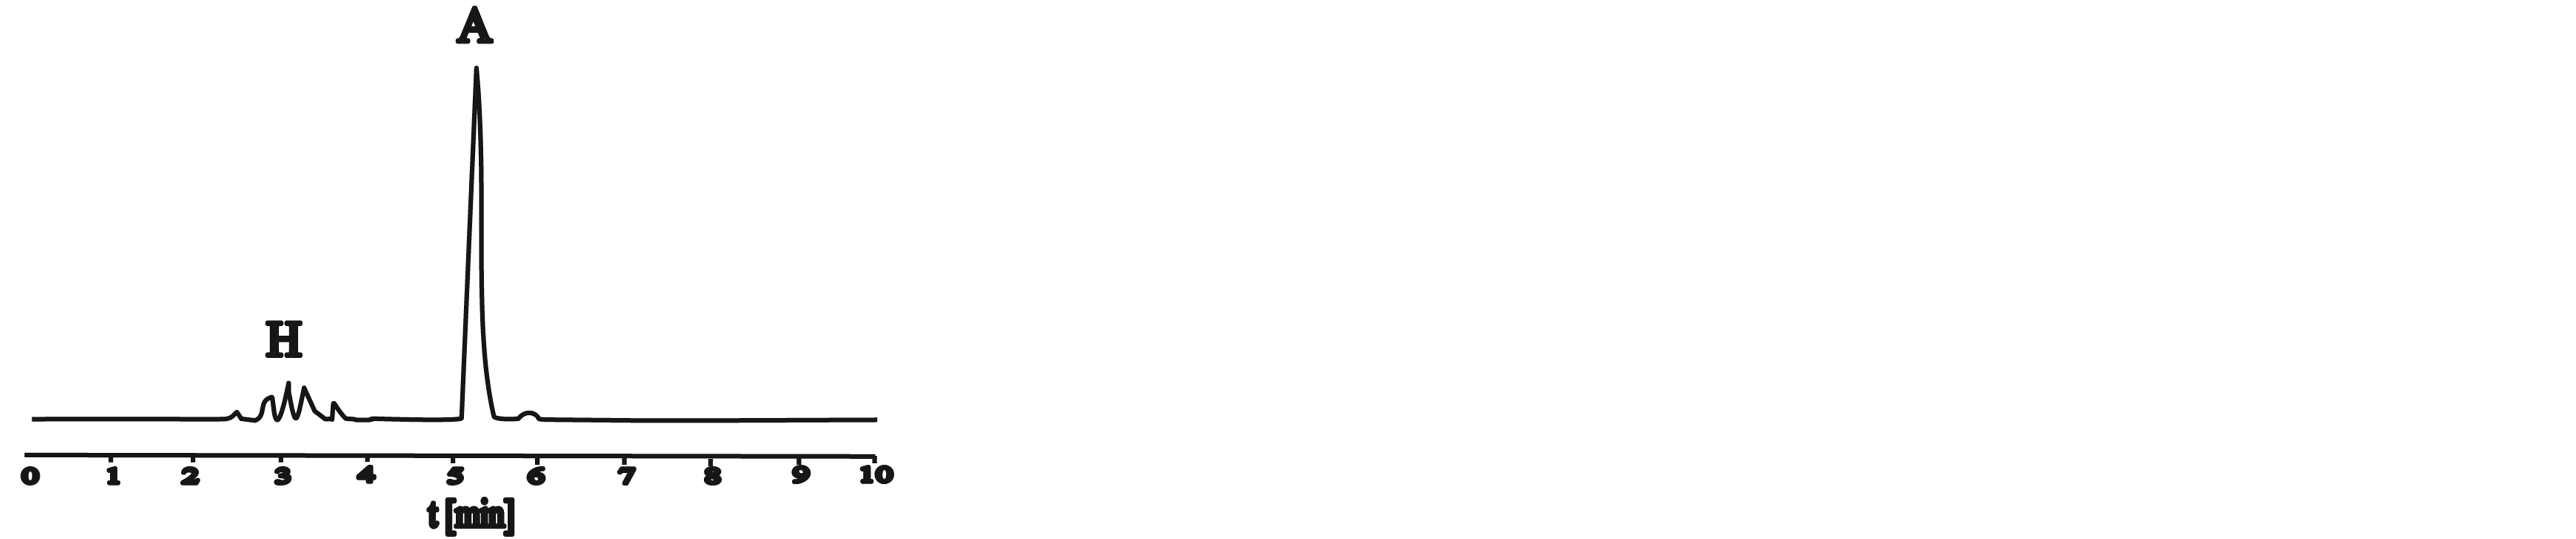 (d)
(d)
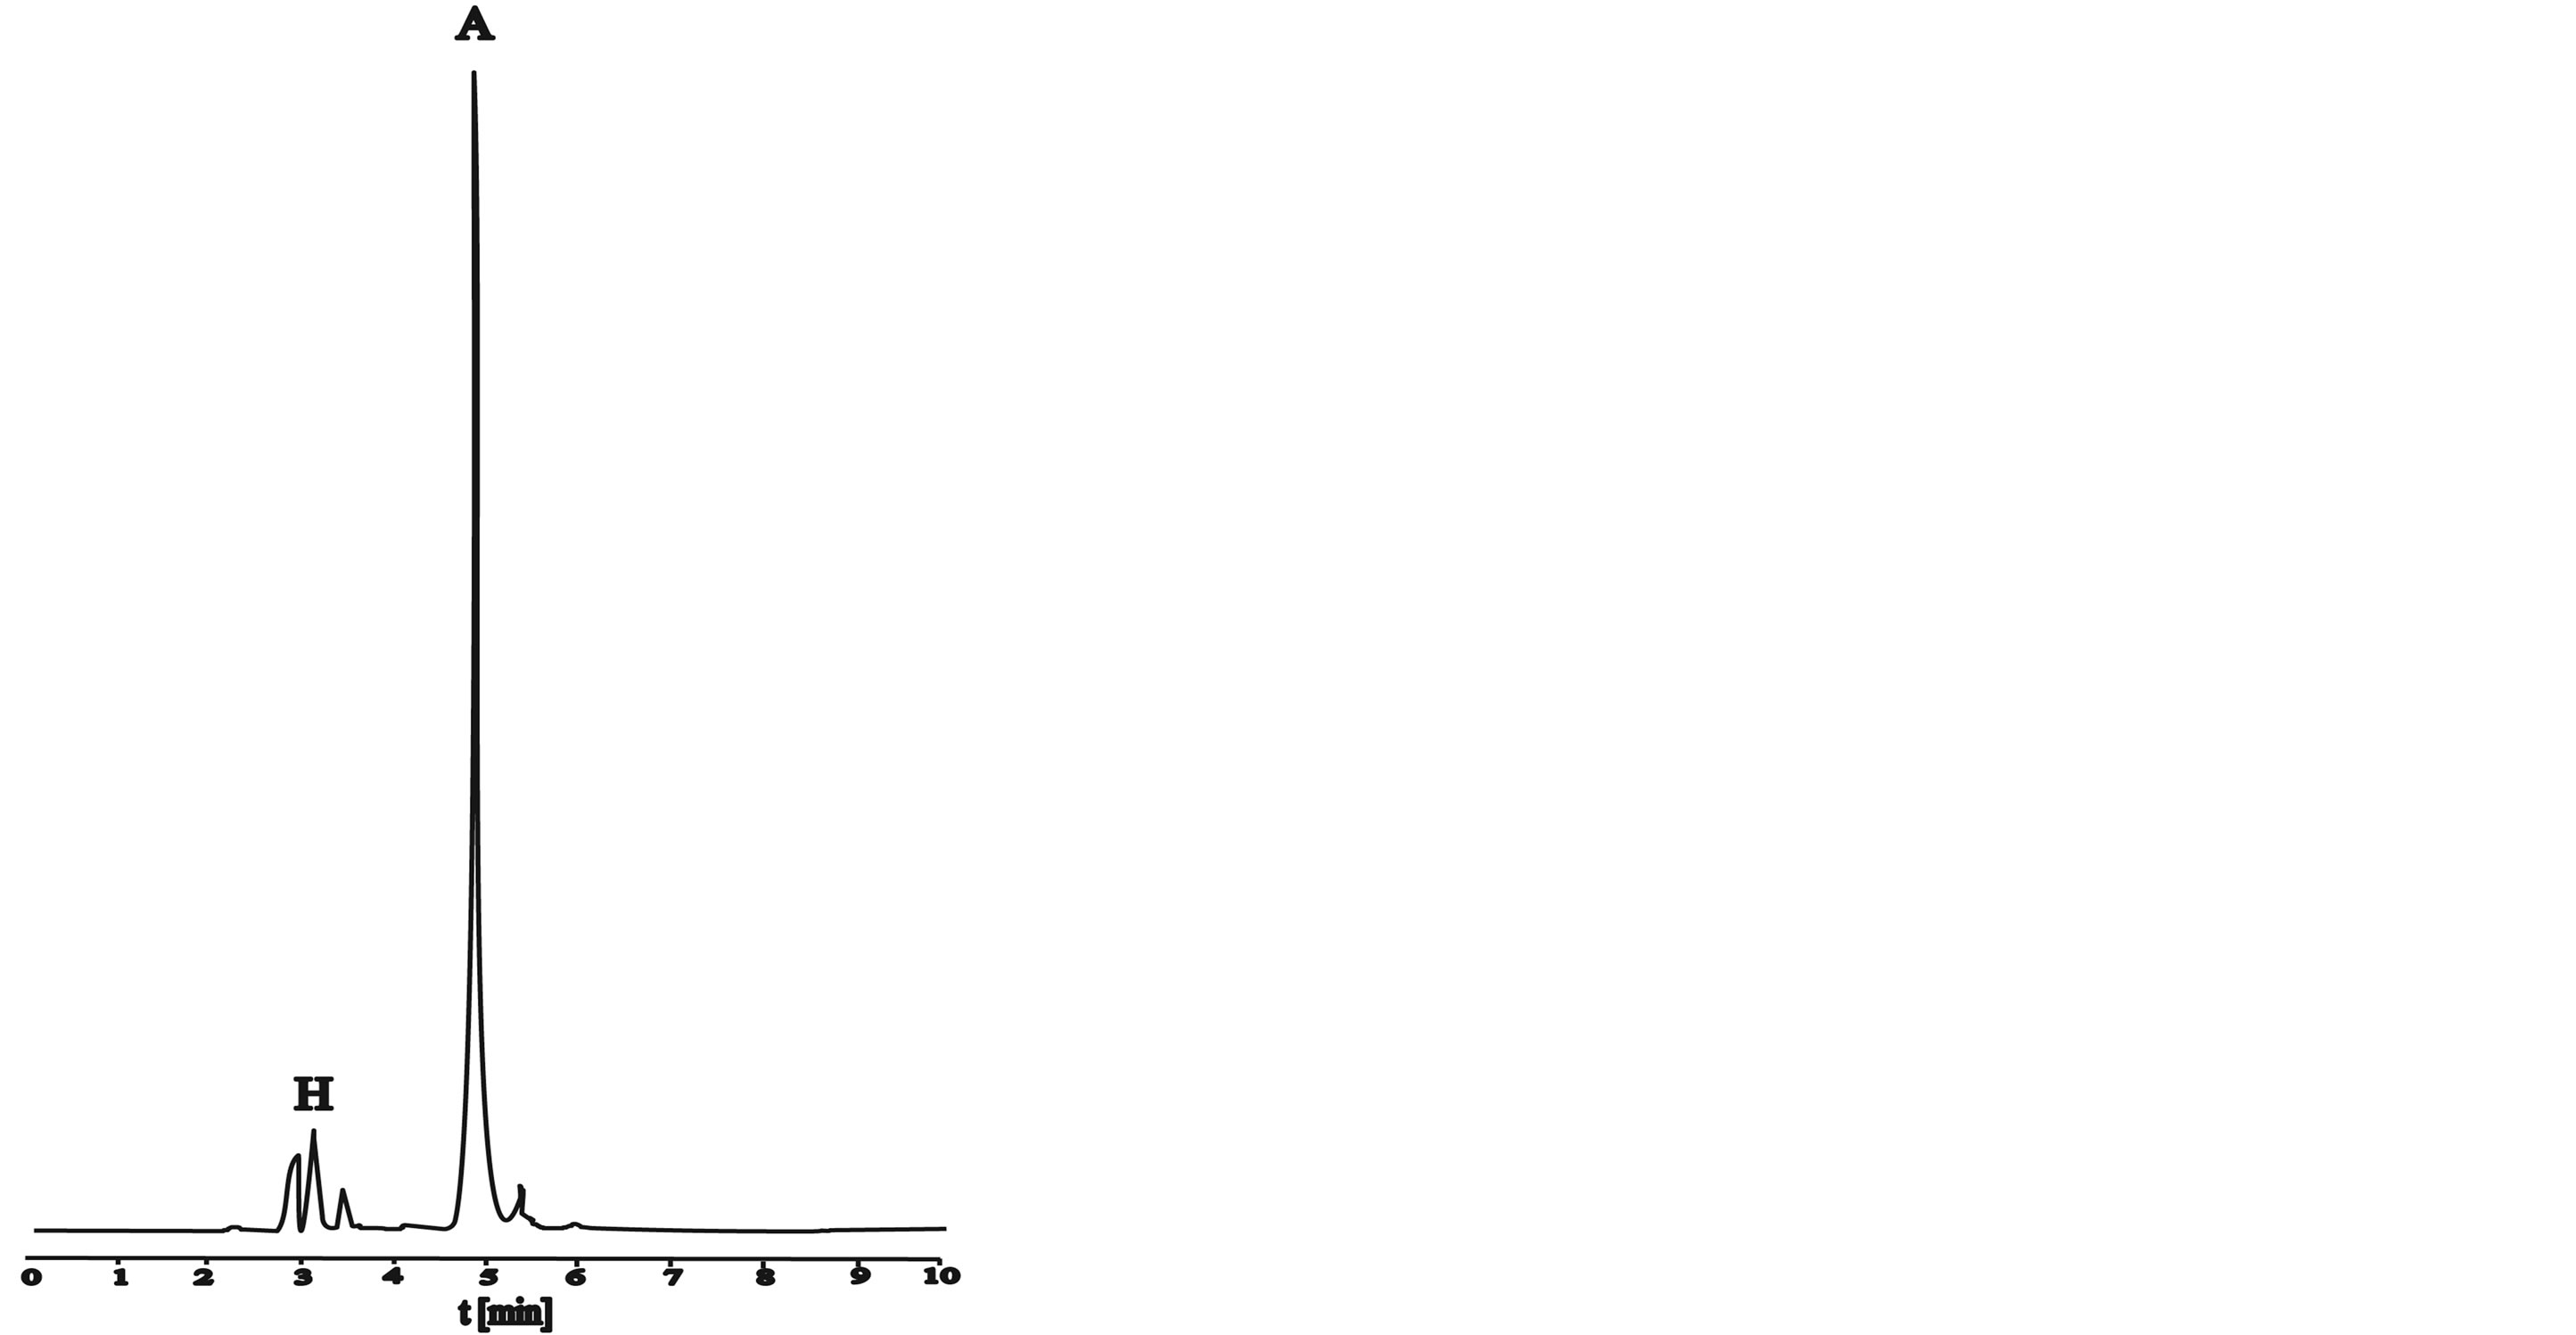
Figure 8. HPLC chromatograms of active and hydrolyzed form of dye in dyebath at procedure d: (a) At the beginning; (b) After 30 minutes; (c) After 55 minutes; (d) After 65 minutes.
Figure 8 shows HPLC chromatograms at procedure d (Figure 1(d)). Active dye form decreased in dyebath, adsorbed on the fibres and it is partly hydrolyzed what is evident from peak of hydrolyzed dye.
4. Conclusions
Although the complete process of dye purification and execution of calibration curves is pretty pretentious, it enables complete control under dyeing procedure, since we were able to define the exact amount of the hydrolyzed and active form of the dye that was adsorbed and bonded with fibres according to calibration curves made for active and hydrolyzed form of the dye and Equations (1)-(4).
Results showed that in a case of dyeing procedures when both alkalis were used, the dye bath exhaustion percentage (%E) was slightly lower than that in case when only Na2CO3 was used. However, addition of NaOH also caused an extra hydrolysis of dye in dyebath so from our results it could be concluded that the use of only Na2CO3 is more appropriate for dye used in our research.
It was also established that adsorption temperature had no influence on reaction between dye and fibres, however, up to 83.0% of dye reacted with fibres.
Acknowledgements
The Ministry of Higher Education, Science and Technology financially supported the research under the research program P2-0213, Textiles and Ecology.
References
- Cibacron, L.S. Technical Documentation. Ciba.
- Drimaren, H.F. Technical Documentation. Clariant.
- Bezactiv. Technical Documentation. Bezema.
- Procion Fast H-EXL and Remazol Ultra, R.G.B. Technical Documentation. DyStar.
- Cibacron, S. Technical Documentation. Ciba.
- Pavkov, N., Vrhunc, V. and Gorenšek, M. (2005) Zamenjava Monofunkcionalnih z Bifunkcionalnimi Reaktivnimi Barvili = Substitution of Monofunctional Reactive Dyes with New Bifunctional Reactive Dyes. Tekstilec, 48, 245-251.
- Technical Documentation, Ciba Coagulant, Flocculants, Ciba.
- Motomura, H. and Morita, S. (1979) Diffusion with Simultaneous Reaction of Reactive Dyes in Cellulose: II. Effect of Hydrolysis. Journal of Applied Polymer Science, 24, 1747-1757. http://dx.doi.org/10.1002/app.1979.070240714
- Taylor, J.A., Renfrew A.H.M. and Lovis, J.N. (1991) Reactive Dye for Cellulose. The Reaction of Alkoxychlorotriazinyl Dyes with Hydroxide Ion. Journal of Society of Dyers and Colorists, 107, 455-456. http://dx.doi.org/10.1111/j.1478-4408.1991.tb01299.x
- Smith, C.B. and Thakore, K.A. (1991) The Effects of Ultrasound on Fibre Reactive Dye Hydrolysis. Textile Chemist and Colorist, 23, 23-25.
- Wallace, M.L., Beck, K.R. and Smith, C.B. (2000) On-Line Monitoring of Reactive Batch Dyeing Exhaustion and Hydrolysis by FIA-HPLC. Textile Chemists and Colorist and American Dyestuff Reporter, 32, 39-40.
- Zotou, A., Eleftheriadis, I., Heli, M. and Pegiadou, S. (2002) Ion-Pair High Performance Liquid Chromatographic Study of the Hydrolysis Behaviour of Reactive Fluorotriazinic Dyes. Dyes and Pigments, 53, 267-275. http://dx.doi.org/10.1016/S0143-7208(02)00019-0
- Aspland, J.R. and Johnson, A. (1965) Alkaline Hydrolysis of Chloro-N-Heterocyclic Reactive Dyes Containing Ionisable Amino Groups-I. Journal of Society of Dyers and Colorists, 81, 425-429. http://dx.doi.org/10.1111/j.1478-4408.1965.tb02614.x
- Johnston, J.E. and Rattee, I.D. (1973) Further Studies of the Acid-Catalysed Hydrolysis of Type 3 Dye-Fibre Bonds between Cellulose and Triazinyl Reactive Dyes. Journal of Society of Dyers and Colorists, 89, 77-94.
- Grancarić, A.M., Tarbuk, A. and Pusić, T. (2005) Electrokinetic Properties of Textile Fabrics. Coloration Technology, 121, 221-226. http://dx.doi.org/10.1111/j.1478-4408.2005.tb00277.x
- Zollinger, H. (1987) Color Chemistry: Syntheses, Properties and Applications of Organic Dyes and Pigments. 1st Edition, Weinheim, New York.
- Clayden, J., Greeves, N., Warren, S. and Wothers, P. (2001) Organic Chemistry. 1st Edition, Oxford University Press, Oxford.
- Tišler, M. (1999) Organska Kemija. DZS, Ljubljana.
- Gorenšek, M., Recelj, P. and Bukošek, V. (2001) Effect of Zinc Chloride on the Dyeability of Cotton with Bis(Monofluoro-s-Triazine) Dye. Textile Research Journal, 71, 351-356. http://dx.doi.org/10.1177/004051750107100412
- Shamey, R. and Hussein, T. (2005) Critical Solutions in the Dyeing of Cotton Textile Materials. Textile Progress, 37, 1-84. http://dx.doi.org/10.1533/tepr.2005.0001
- (1989) The Theory of Coloration of Textiles. In: Johnson, A., Ed., 2nd Edition, Society of Dyers and Colourists, Bradford.
- Đorđević, D., Cerkovnik, J. and Gorenšek, M. (2006) The Comparison of the Kinetics of Hydrolysis of Some Reactive Dyes Before and After Purification. Fibres & Textiles in Eastern Europe, 14, 85-88.
- Đorđević, D., Kovač, F. and Gorenšek, M. (2004) The Comparison of Two Methods of Liquid Chromatography for the Determination of Reactive Dyes. 2nd International Textile, Clothing & Design Conference, Magic World of Textiles: Book of Proceedings, Zagreb, 681-685.
- Chavan, R.B. (1976) The Use of Solvent-Nonsolvent Mixtures for the Purification of Anionic Dyes. Textile Research Journal, 6, 435-437.