American Journal of Analytical Chemistry
Vol. 4 No. 7 (2013) , Article ID: 34545 , 6 pages DOI:10.4236/ajac.2013.47042
Thermal Decomposition of Some Cardiovascular Drugs (Telmisartane, Cilazapril and Terazosin HCL)
1Chemistry Department, Faculty of Science, King AbdulAziz University, Jeddah, KSA
2Chemistry Department, Faculty of Science Benha University, Benha, Egypt
3National Organization for Drug Control and Research, Cairo, Egypt
Email: lmajeed2002@yahoo.com
Copyright © 2013 L. M. Al-Harbi et al. This is an open access article distributed under the Creative Commons Attribution License, which permits unrestricted use, distribution, and reproduction in any medium, provided the original work is properly cited.
Received April 30, 2013; revised May 31, 2013; accepted June 15, 2013
Keywords: Anti-Hypertensive Drugs; Quality Control; Thermal Analysis; Thermogravimetry; Derivative Thermogravimetry; Differential Thermal Analysis
ABSTRACT
Thermal analysis of some antihypertensive drugs, Telmisartan, Cilazapril and Terazosin HCL was achieved. Thermogravimetry, derivative thermogravimetry and differential thermal analysis were used through the work. Thermogravimetric parameters such as activation energy, frequency factor and reaction order were calculated. The results show the stability value decrease in the order Telmisartan > Cilazapril > Terazosin. This method can be used in the quality control of pharmaceutical compounds because it is simple, fast and cheap.
1. Introduction
Several studies have been carried out to use the thermal analysis in the investigation of cardiovascular agents [1, 2]. Thermal analysis is used to study the properties of raw material and products [3]. One of the important application of thermal analysis in pharmaceutical science is to determinate the kinetic parameters of drugs [4,5]. In thermogravimetry (TG) the change in the mass loss at constant heat rate is plotted vs. temperature is used to study the thermal stability and the kinetic parameters of the drugs [6,7]. TG is quantitative, comparative analytical method which can produce fast and reproducible results, and this leads to use TG in the quality control of drugs to improve the final product and for the determination of drug quality via technological parameters [8]. The identification of pharmaceutical and organic compound can be performed by differential thermal analysis (DTA) [9]. Another method can be used in the pharmaceutical industry as an analytical tool of great importance for the identification and purity testing of active drug with rapid and efficient results is differential scanning calorimetric (DSC) which is also used in the quality control of raw material in pharmaceutical products [10,11]. In the present work, three cardiovascular compounds were investigated. Telmisartan, Cilazapril and Terazosin HCL, which belong to different groups of antihypertensive drugs, were chosen for study.
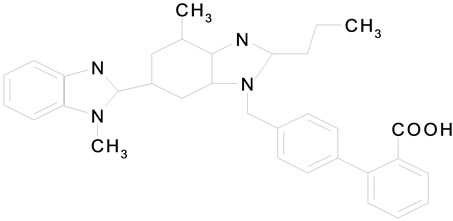
Telmisartan (TMT) Figure 1(a) is 4-[[4-methyl-6-91-methyl-2-benzimidazolyl)-2-propyl-1-benzidazolyl] methyl[-2-biphenyl carboxylic acid. It belongs to AgII blockers (antihypertensive drugs). They block the vasoconstrictor effects of AgII at receptor site. Cilazapril (CPL) (Figure 1(b)) belongs to angiotensin converting enzyme (ACE) inhibitor. It is (15, 95)-9-[[(15)-1-(ethoxycarbonyl)-3-phenyl propyl]]-10-oxooctahydro-6H-pyridazino [1,2-a] diazepine-1-carboxylic acid. Terazosin (TZC) (Figure 1(c)) is 1-(4-amino-6, 7-dimethoxy-2-quinazonyl)-4-[(tetrahydro-2-furanyl)carbonyl]-, monohydrochloride, dihydra te. Or 4-amino-6,7-dimethoxy-2-quinazolinyl)-4-(tetrahydro-2-furanyl)piperazine monohydrochloride dihydrate.
2. Experimental
Telmistran, Cilazapril, and Terazosin were obtained from Reference standard department (NODCAR); they satisfied the specifications USP and BP.
The DG/DTG and DTA measurements were made with simultaneous DTA-TG apparatus thermal analyzer (Shimadzu DTG-60). The experiments performed at heating rate 10˚C/min from ambient to 1000˚C. Dry nitrogen used as purage gas and the flow rate was measured using an electron flow meter, (Jac-scientific model
± ADM 1000).
3. Results and Discussion
The TG and DTG curves of Telmisatran TMT (Figure 2) show that the compound is thermally stable up to 262˚C, while Cilzapril CPL is stable up to 200˚C (Figure 3) and Terazosin TZC (Figure 4) up to 100˚C respectively. It can be concluded from their decomposition reaction that TZC is considered to be the least stable. It starts to decompose at lower temperature than the other two. That is, the thermal stabilities of the compounds decrease in the following order:
TMT > CZL > TZC TG of Telmisatran (TMT) (Figure 2) shows that it decomposed by two steps. First fast step between 262 and 493˚C with mass lose 54.171% is probably due to the thermal decomposition and elimination of biphenyl carboxlic acid and methylbenzimidazolyl groups while the second step with total mass loss 51% due to pyrolysis of the compound between 493˚C and 712˚C. The DTA curve of TMT shows an endothermic sharp peak with its maximum at 456.63˚C f followed by exothermic broad
 (a)
(a)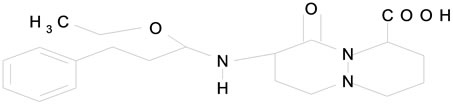 (b)
(b)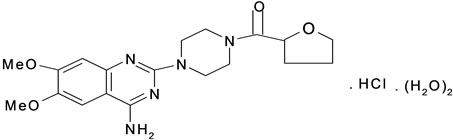 (c)
(c)
Figure 1. The structures of cardiovascular drugs (a) Telmisartan; (b) Cilazpril; (c) Terazosin HCl·2H2O.
peaks at 569˚C and 610˚C due to pyrolysis of the compound. In addition to the mentioned reaction, the compound has an endothermic peak with maximum at 273˚C with no mass loss due to melting of the compound.
The thermal decomposition of Cilzapril CPL (Figure 3) occurs between 213˚C and 1000˚C. The mass loss of 87.506% occurs with fast process at 600˚C due to the partial elimination of substitute group from the benzene ring (COOH, CH3, CH2-O, and NH). This fast process is followed by slow process with final loss of 12% due to the pyrolysis of the compound.
The DTA curve of Cilazapril CPL shows four peaks (Figure 3). The first peak has endothermic shoulder at 63.4˚C attributed to the partial melting and recrystallization of the compound, the second endothermic peak at 88.65˚C due to the melting of the compound, while the third endothermic peak at 411.19˚C is due to the decomposition of the compound followed by an exothermic one at 564.33˚C due to the decomposition of the compounds.
TG curves of Terazosin TZC (Figure 4) show four decomposition steps in range 160˚C - 500˚C. The mass loss of 8.2% is due to the dehydration with elimination of H2O at 179˚C. The second peak at 206˚C with total mass loss of 32%, suggest a loss of HCl and third steps at and 16.19% mass loss at 301˚C due partial loss of subsistent from the aromatic ring (2MeO, NH2). The last step (301˚C - 500˚C) occurs as a slow process with a loss of % is due to the final pyrolysis of the compound.
The DTA curve (Figure 4) of TZC shows first endothermic peak at 163˚C is due to dehydration, the second sharp exothermic peak at 205.79˚C is due to a polymerphic transition, and it’s followed by endothermic peak at 205.24˚C ascribed to thermal decomposition of the compound.
Table 1 presents the data concerning the main thermal reactions of the examined compounds. Table 2 gives the corresponding DTA reactions. The melting temperatures of the examined compounds are determined by using the melting points of the compounds obtained by using DTA, and the melting point apparatus, the results are compared with the data stated in the literature (9 - 11). It is clear that results of the DTA method are comparable with the literature figures, and hence can be used for melting point determination.
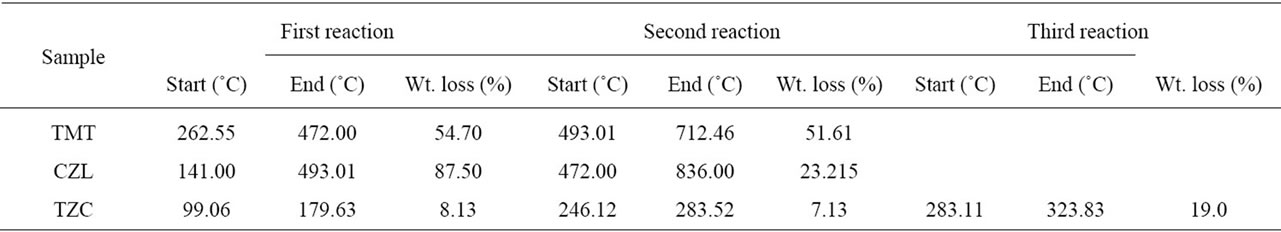
Table 1. The thermal decomposition reaction of cardiovascular drugs (Telmisartan, Cilazapril and Terazosin HCl).
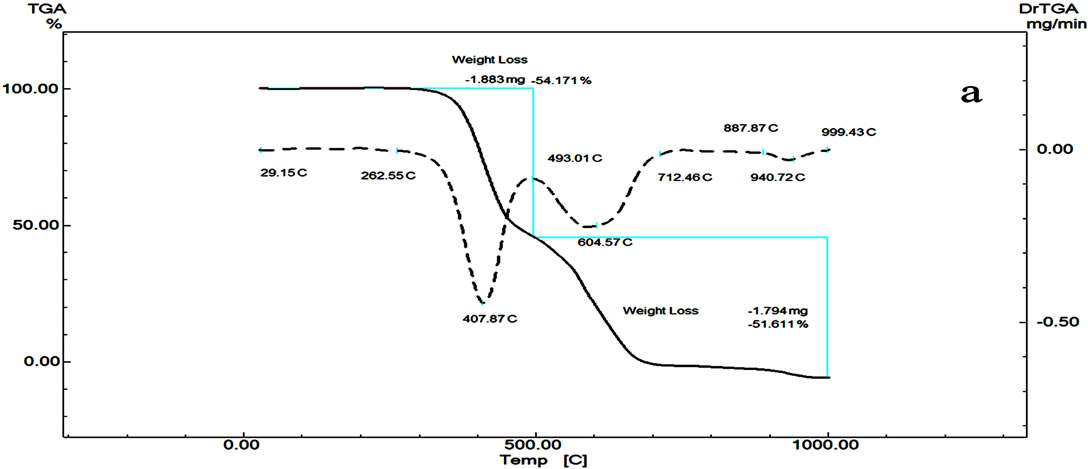
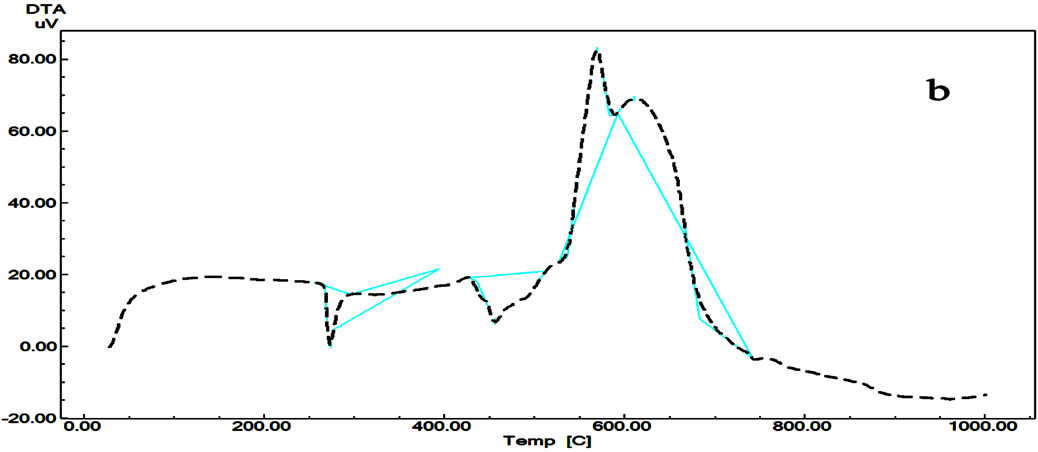
Figure 2. DTG/DTG (a) and DTA (b) curves of Telmisartan.
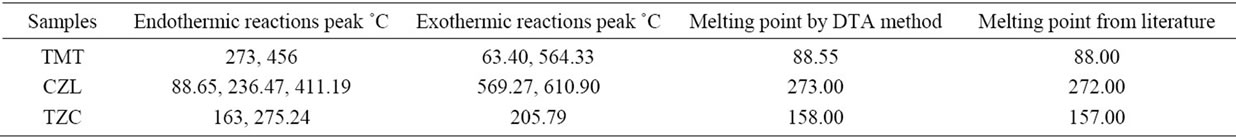
Table 2. DTA reaction and melting point of cardiovascular drugs (Telmisartan, Cilazapril and Terazosin HCL).
3.1. Kinetics and Thermodynamic Parameters
There were many methods used for the determination of the kinetic parameters. From these, Horowitz and Metzger [12] and Coats and Redfern [13] were applied.
3.2. Horowitz and Metzger Method
For the first order kinetic process, the Horowitz-Metzger equation can be represented as follow:
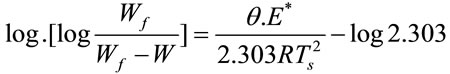
where Wf was the mass loss at the completion of the decomposition reaction, W was the mass loss up to temperature T, R was the gas constant, Ts was the DTGA peak temperature and θ = T − Ts. A plot of log[log Wf/(Wf − W)] against θ would give a straight line and E* could be calculated from the slope.
3.3. Coats-Redfern Method
For the first order kinetic process, the activation energy (E*) in J·mol−1 could be calculated from the following equation:
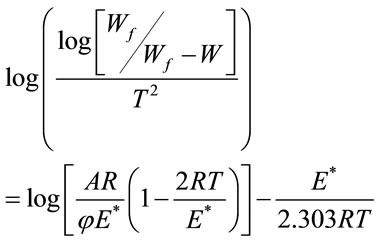
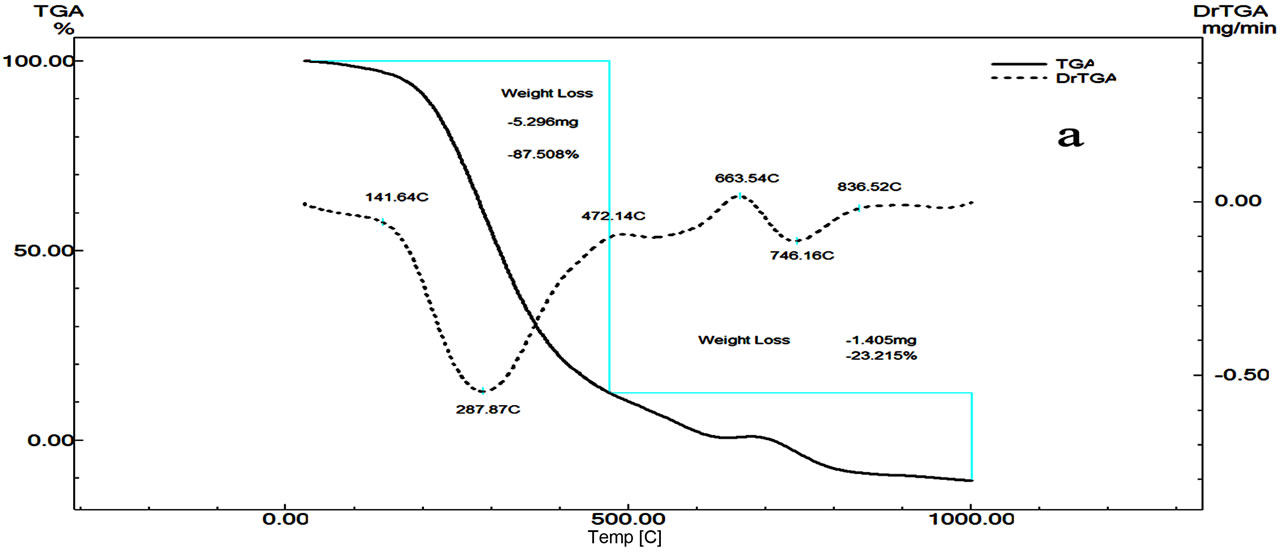
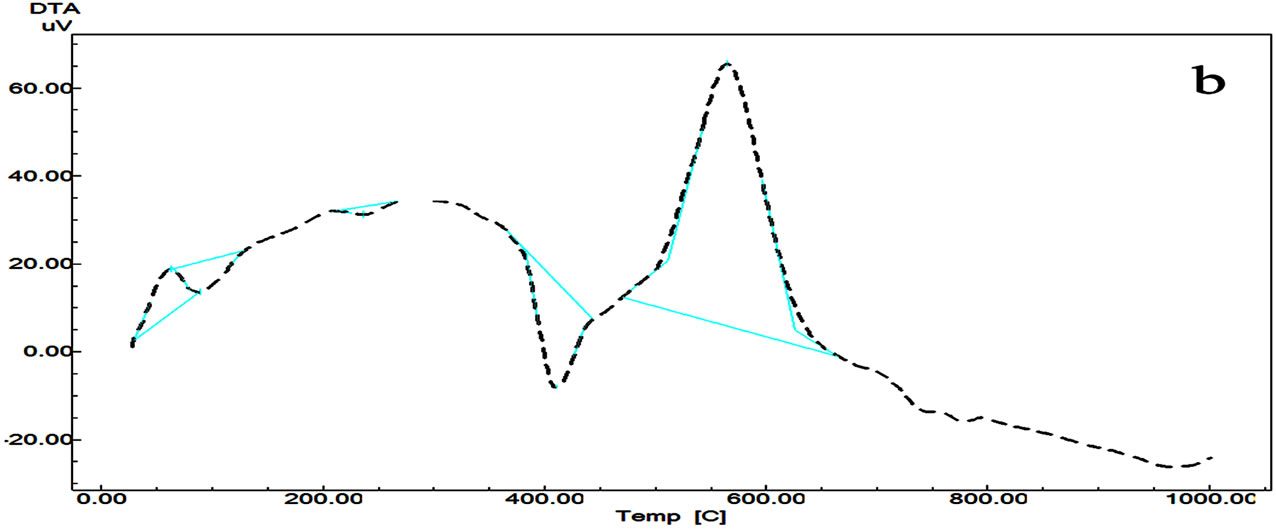
Figure 3. DTG/DTG (a) and DTA (b) curves of Cilazapril.
ø was the heating rate. Since 1 - 2RT/E* ≈ 1, the plot of the left-hand side of the above equation against 1/T would give a straight line. E* was then calculated from the slope and the Arrhenius constant (A) was obtained from the intercept. The entropy ΔS*, enthalp (ΔH* and free energy ΔG* of activation were calculated using the following equations:
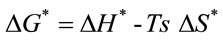

where k and h were the Boltzman and Planck constants, respectively. So the calculated values of E*, ΔS*, ΔH* and ΔG* could be obtained.
The kinetic parameter (Ea), and (A) demonstrated significant difference between the three molecules (Table 3). The activation energy values suggested the following sequence of thermal stability:
Telmisartan > Cilazapril > Terazosin
This conclusion is in accordance with previous conclusion for the thermal decomposition reaction of the compounds. The first reaction of Terazosin needs the lowest activation energy and hence the compound is the least stable and starts to decompose first.
4. Conclusion
The studied compounds are characterized by having main decomposition reaction and consisting of two or three stages. Besides stability studies, thermal analysis is of value for determining melting temperatures and water content. The use of clean techniques, the speed and the sim-
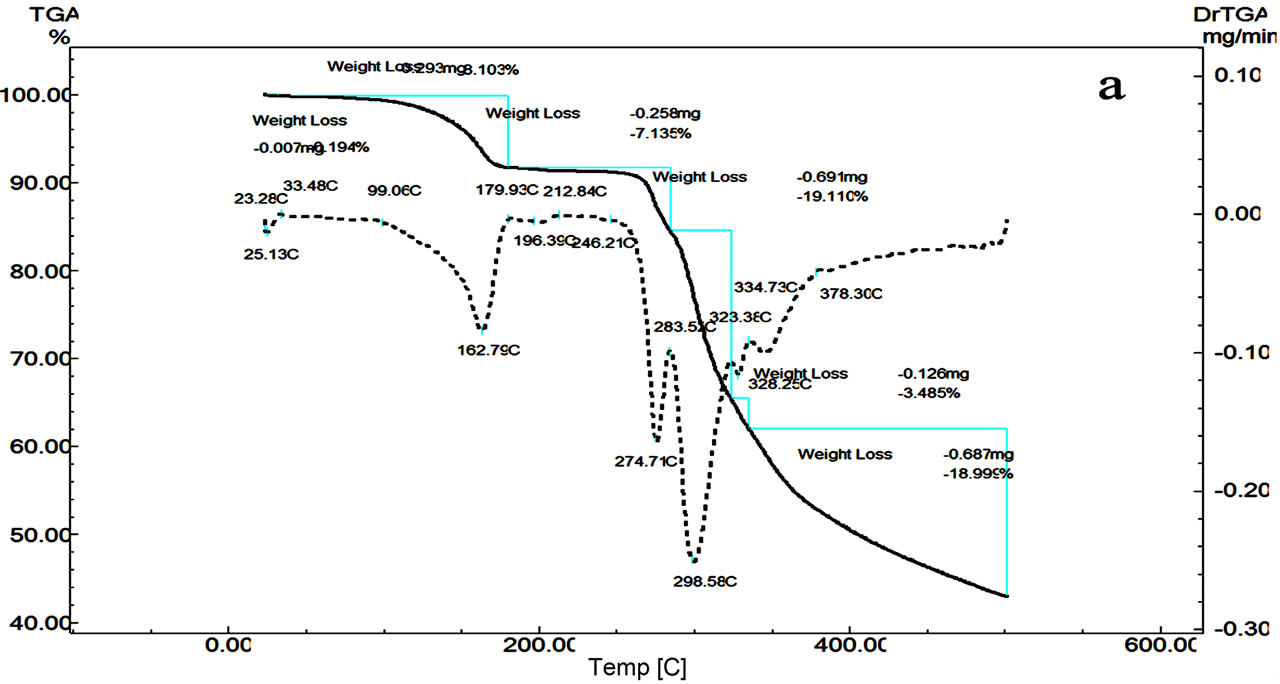
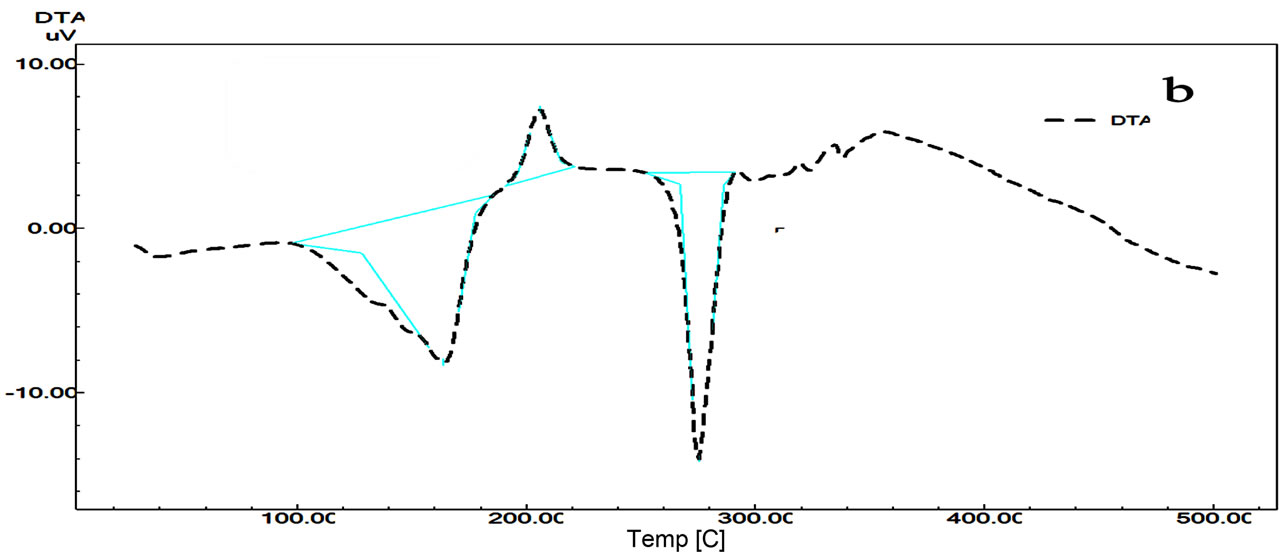
Figure 4. DTG/DTG (a) and DTA (b) curves of Terazosin.
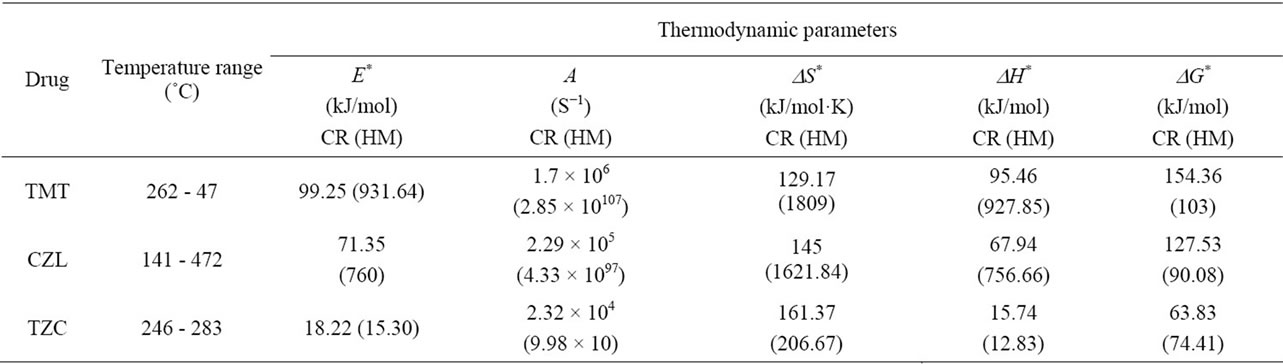
Table 3. Thermodynamic parameters of the thermal decomposition of Telmisartan, Cilazapril, and Terazosin HCl.
plicity of the analytical methods applied to obtain the results are the reasons behind the even growing importance of thermal analysis in the quality control of active ingredients for medication.
REFERENCES
- D. Giron, “Pharmaceutical Science and Technology Today (PSTT),” 1998.
- Y. I. Huang, Y. H. Cheng, K. S. Alexander and D. Dollimore, “The Thermal Analysis of the Drug Captopril,” Proceedings of the 27th Conference of the North American Thermal Analysis Society, 1999, p. 612.
- J. L. Ford and P. Timmings, “Pharmaceutical Thermal Analysis Techniques and Applications,” Ellis Harwood, Chichistero, 1989.
- R. F. Bruns, “Effects of Experimental Conditions on the Estimation of Kinetic Parameters of the Thermal Decomposition of AZT Using Factorial Design,” Journal of Thermal Analysis and Calorimetry, Vol. 79, No. 3, 2005, pp. 697-701. doi:10.1007/s10973-005-0598-5
- A. P. Barrệ, L. O. Gomes, F. S. Souza and R. O. Macedo, “Application of Thermal Analysis in the Characterization of Antihypertensive Drugs,” Journal of Thermal Analysis and Calorimetry, Vol. 64, 2001, pp. 745-650.
- L. Burham, D. Dollimore and K. S. Alekender, L. K. Burhnam, D. Dollimore and K. S. Alexander, “A Rising Temperature Kinetic Model to Describe Complex Reaction Kinetics of a Drug: Procainamide Hydrochloride,” Proceedings of the 26th Conference of the North American Thermal Analysis Society, 1998, p. 294.
- L. Burnham, D. Dollimore and K. S. Alexander, “Calculation of the Vapor Pressure-Temperature Relationship Using Thermogravimetry for the Drug Allopurinol,” Proceedings of the 27th Conference of the North American Thermal Analysis Society, 1999, p. 602.
- R. O. Macedo, T. Gomes do Nascimento, C. F. Soares Aragao and A. P. Barreto Games, “Application of Thermal Analysis in The Characterization of Anti-hypertensive Drugs,” Journal of Thermal Analysis and Calorimetry, Vol. 59, 2000, pp. 657-661.
- “Merck Index,” 14th Edition, 2006, p. 9131.
- “Merck Index,” 14th Edition, 2006, p. 2270.
- P. Holm and A. Kristensen, “A Method for Drug Formulation and a Pharmaceutical Composition,” 1992.
- H. H. Horowitz and G. Metzger, “A New Analysis of Thermogravimetric Traces,” Analytical Chemistry, Vol. 35, No. 10, 1963, pp. 1464-1468. doi:10.1021/ac60203a013
- A. W. Coats and J. P. Redfern, “Kinetic Parameters from Thermogravimetric Data,” Nature, Vol. 201, 1964, pp. 68-69.