American Journal of Analytical Chemistry
Vol.3 No.11(2012), Article ID:24440,4 pages DOI:10.4236/ajac.2012.311095
Simple Estimation of Bosentan in Tablet Formulation by RP-HPLC
Faculty of Pharmacy, AIMST University, Bedong, Malaysia
Email: *murali23pharm@hotmail.com
Received September 25, 2012; revised October 27, 2012; accepted November 3, 2012
Keywords: Estimation; Validation; RP-HPLC; Bosentan
ABSTRACT
A simple, precise, and accurate method is developed and validated for the analysis of Bosentan tablet formulation. The method has shown adequate separation of the ingredients from Tablets. Separation was achieved on a C18 column using a mobile phase consisting of acetonitrile: 10 Mm ammonium acetate (pH 4.5) buffer (70:30, v/v) at a flow rate of 1.0 ml/min and UV detection at 265 nm. This new method is validated as per the ICH, which includes accuracy, precision, selectivity, linearity and range, robustness and ruggedness. The current method demonstrates good linearity over the range of 5 - 70 ng/ml of bosentan with r2 of 0.999. The average recovery of the method is 98.6%. The degree of reproducibility of the results obtained as an outcome of small deliberate variations in the method parameters and by changing analytical operator has proven that this method is robust and rugged.
1. Introduction
Bosentan is competitive antagonist of endothelin-1 receptor acts on endothelin A and endothelin present smooth mussels of pulmonary blood vessels [1-3]. Bosentan used in the treatment pulmonary hypertension and digital ulcers in patients with systemic sclerosis. Chemically it contain 4-tertbutyl-N-[6-(2-hydroxyethoxy)-5-(2-ethoxyphenoxy)-2-(pyrimidin-2-yl) pyrimidin-4-yl] benzene-1- sulfonamide. Limited method has been reported only for spectroscopy and LC-MS-MS (Liquid Chromatography with Tandem Mass Spectrometry) [4-9]. As per our knowledge, no other method is available which is based on RP-HPLC (Reverse Phase-high Performance Liquid Chromatography) estimation. Therefore, it is very imperative to develop a simple and suitable analytical method for the measurement of bosentan and related compounds in bulk and in formulations. Such methods could be easily adapted for routine and in-process quality control analysis, dissolution or similar studies. Due to the importance of bioequivalence of the dosage forms and limitations of UV spectrophotometric methods in detection of impurities, our purpose was to develop a simple, sensitive, and reliable method for simultaneous determination of the drug and respective impurities which can be applied in quality control laboratories.
Validation of the current method was conducted for these ingredients which include accuracy, precision, selectivity, linearity and range, robustness and ruggedness.
2. Experimental
2.1. Chemicals
Acetonitrile, Methanol HPLC grade and AR grade ammonium dihydrogen phosphate are from Merck (Darmstadt, Germany). Bosentan was obtained as a gift sample from Sashan chemicals India.
2.2. Apparatus
HPLC chromatographic separation was performed on a Shimadzu liquid chromatographic system equipped with a LC-20AD solvent delivery system (pump), SPD-20A photo diode array detector, and SIL-20ACHT injector with 50 μL loop volume. LC solution version 1.25 was applied for data collecting and processing (Shimadzu, Japan).
2.3. Reference Standard Solutions
Reference standard solution was prepared by dissolving 100 mg of bosentan in 100 ml of methanol. Nominal standard solution was prepared by diluting 5 ml of stock standard solution to 50 ml with mobile phase to obtain a solution having a known concentration of 100 mcg/ml. Nominal solutions of the formulated tablets were prepared by dissolving a quantity of the powdered tablet equivalent to 62.5 mg of bosentan in 100 ml of mobile phase to get the same concentration as in the standard solution.
3. Results and Discussion
3.1. Method Development
Preliminary studies involved trying C18 columns and testing several mobile phase compositions for the effective separation of bosentan. Reverse phase column eluted with a mobile phase of acetonitrile/ammonium acetate buffer (70:30, v/v) at a flow rate of 1.0 ml/min and a detection wavelength of 265 nm afforded the best separation of these analytes. The sample chromatogram of Bosentan is presented in Figure 1.
3.2. Method Validation
After the method development [10], the validation of the current method has been performed in accordance with USP requirements for assay determination (Category-I: analytical methods for quantitation of active ingredients in finished pharmaceutical products) which include accuracy, precision, selectivity, linearity and range, robustness and ruggedness.
3.3. Linearity and Range
Linearity of this method, different concentrations of the four analytes in the range of 5 - 70 ng/ml for bosentan was analyzed and the linearity between the peak-area and the concentration was examined for each analyte. The results obtained show that the current method is linear for the three analytes in the range specified above with a correlation coefficient of better than 0.99 (Table 1 and Figure 2).
3.4. Accuracy
Accuracy of the method was studied by preparing the placebo of the drug tablet formulation according to the formulation procedure. To the required quantity of placebo, a known quantity of the four active ingredients (bosentan) with the same proportion as in the drug formulation was added to get simulated drug formulation. Results have shown that the mean recovery of the assay is within 100% ± 2.0% for bosentan, and the % CV is lower than 1.0% (Table 2).
3.5. Precision
The precision of this method was evaluated by calculateing the % CV of the peak areas of six replicate injections of the nominal standard solution of bosentan. Furthermore, the % CV of three replicates of the recovery data analyzed in accuracy study was calculated, and it was found to be less than 2.0% (Tables 3(a) and (b)). These results show that the current method is repeatable.
3.6. Selectivity
Selectivity of the current method was demonstrated by good separation of the four analytes from each other. Furthermore, excipient of the tablet formulation did not interfere with the active ingredients of the drug product.
3.7. Limit of Detection (LOD) and Limit of Quantitation (LOQ)
The LOD and LOQ for bosentan were predicted basing on the parameters of standard error of estimate and slope, calculated from linearity of the response data of bosentan 2.0 ng/ml and 7.0 ng/ml respectively.
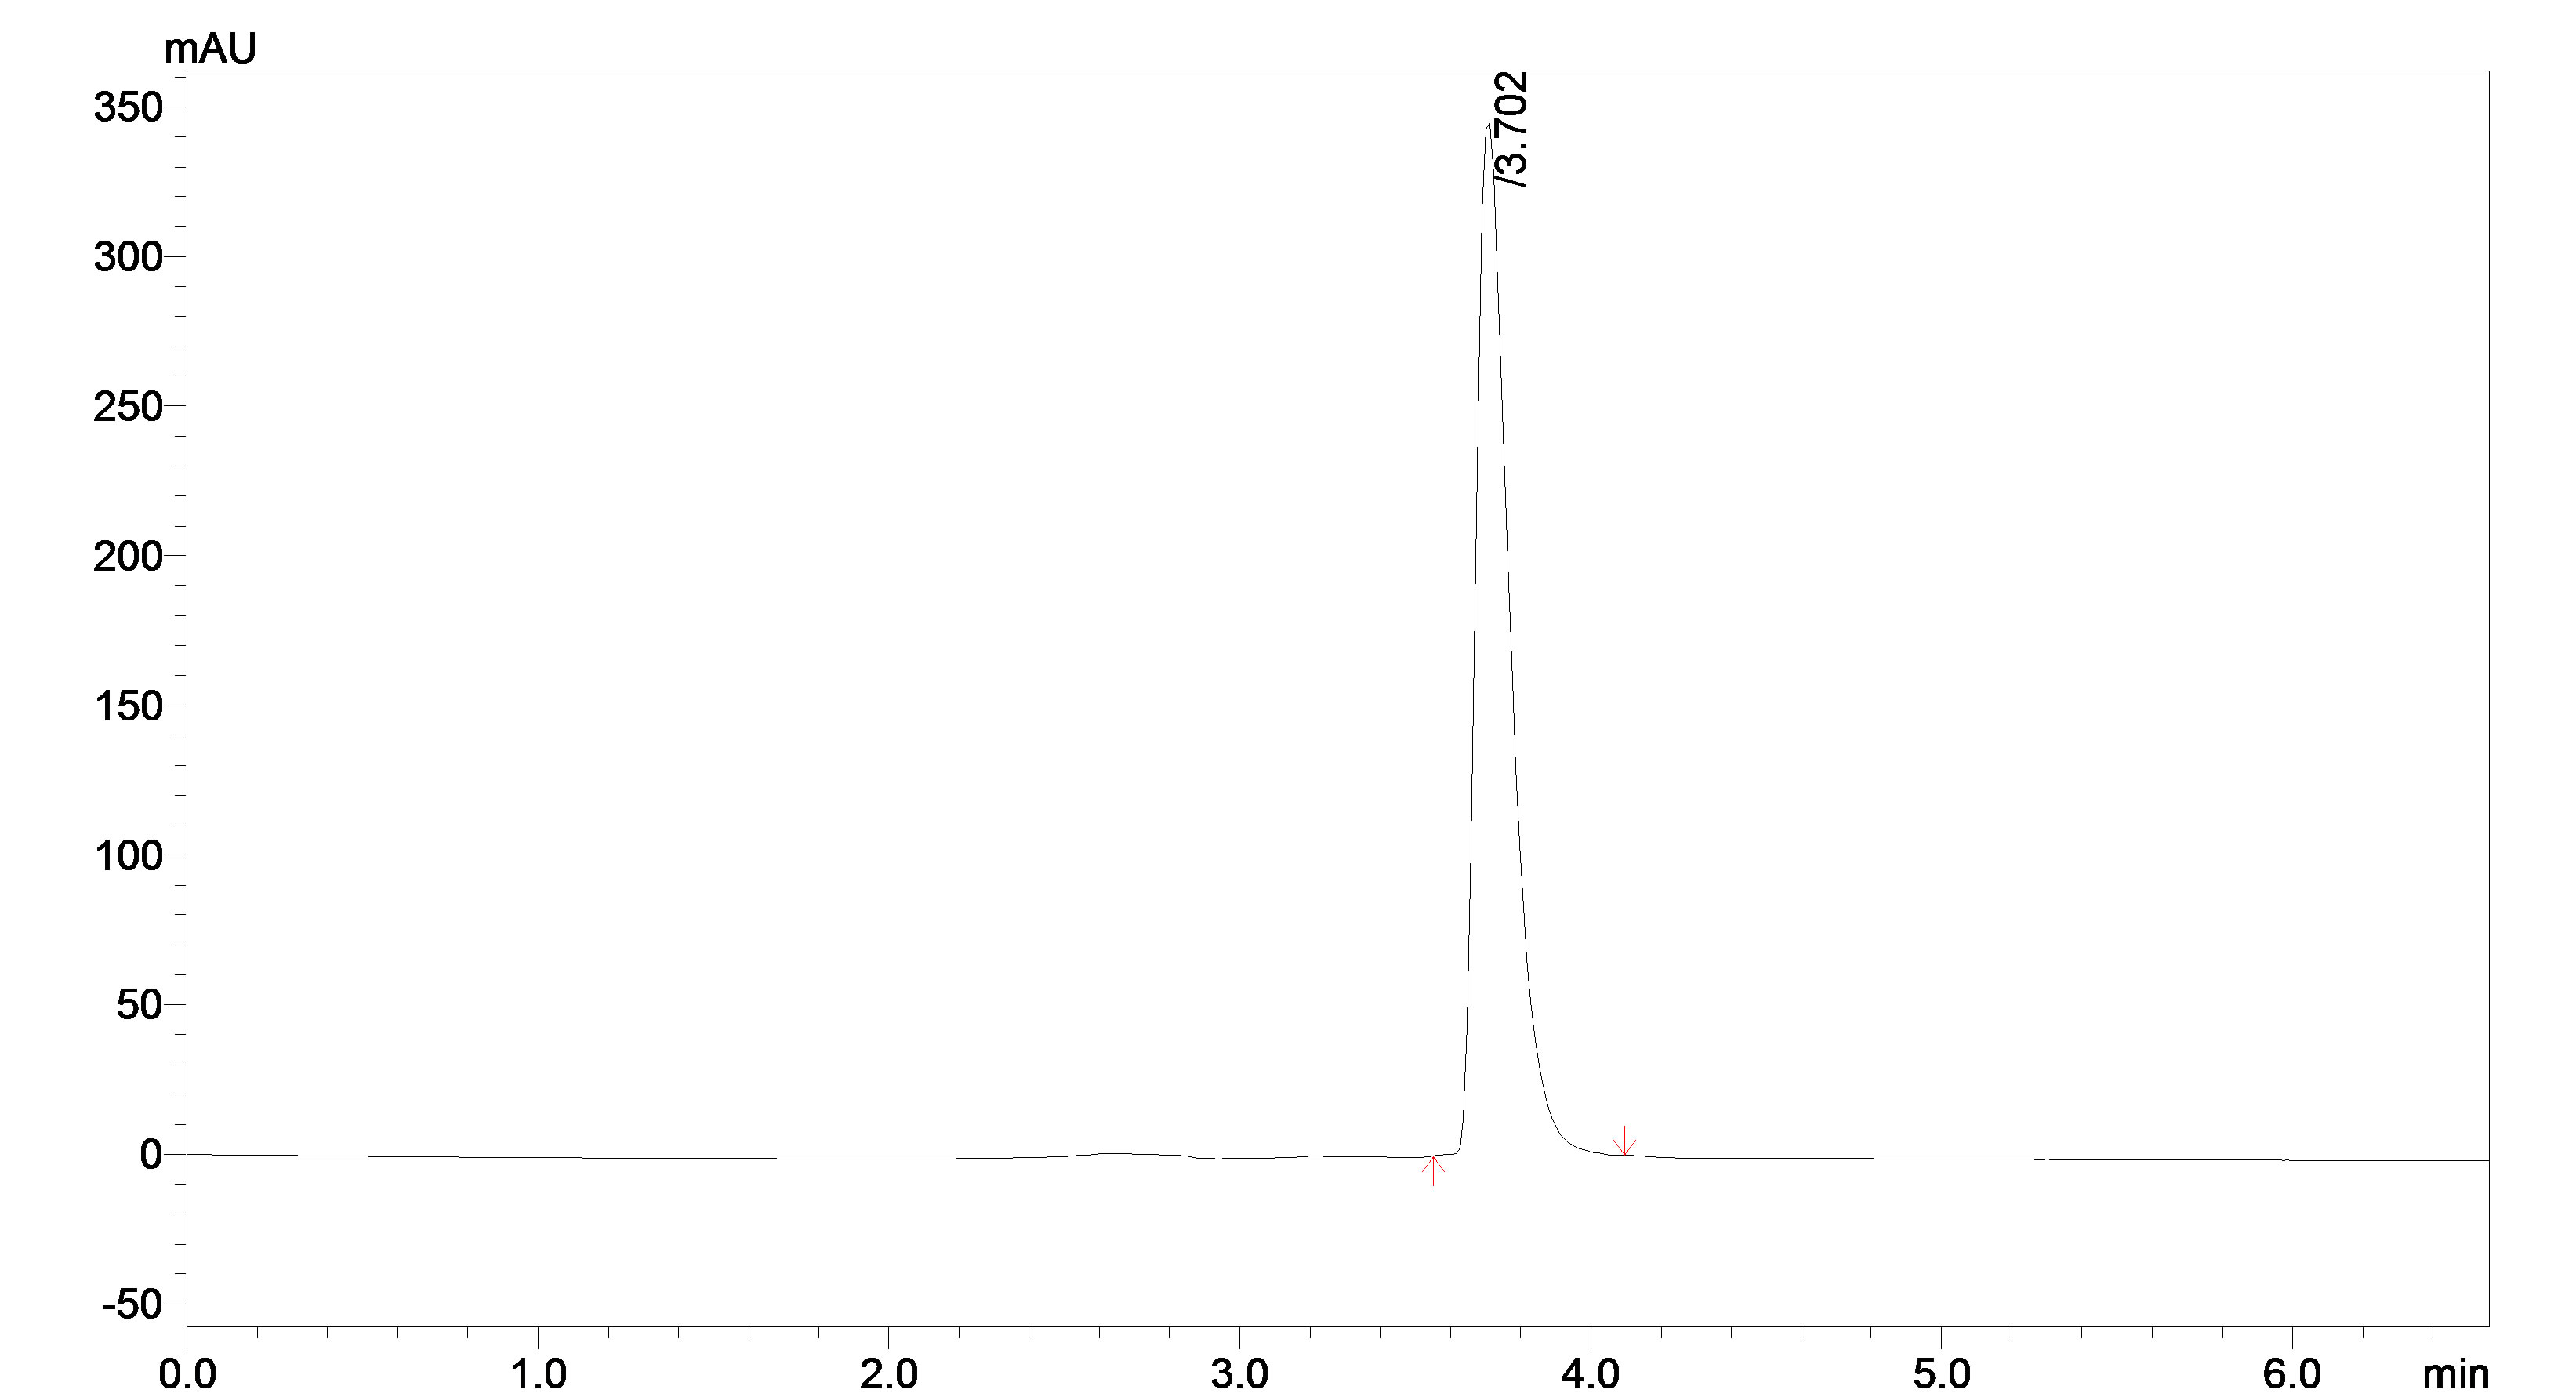
Figure 1. Typical chromatogram of bosentan sample.
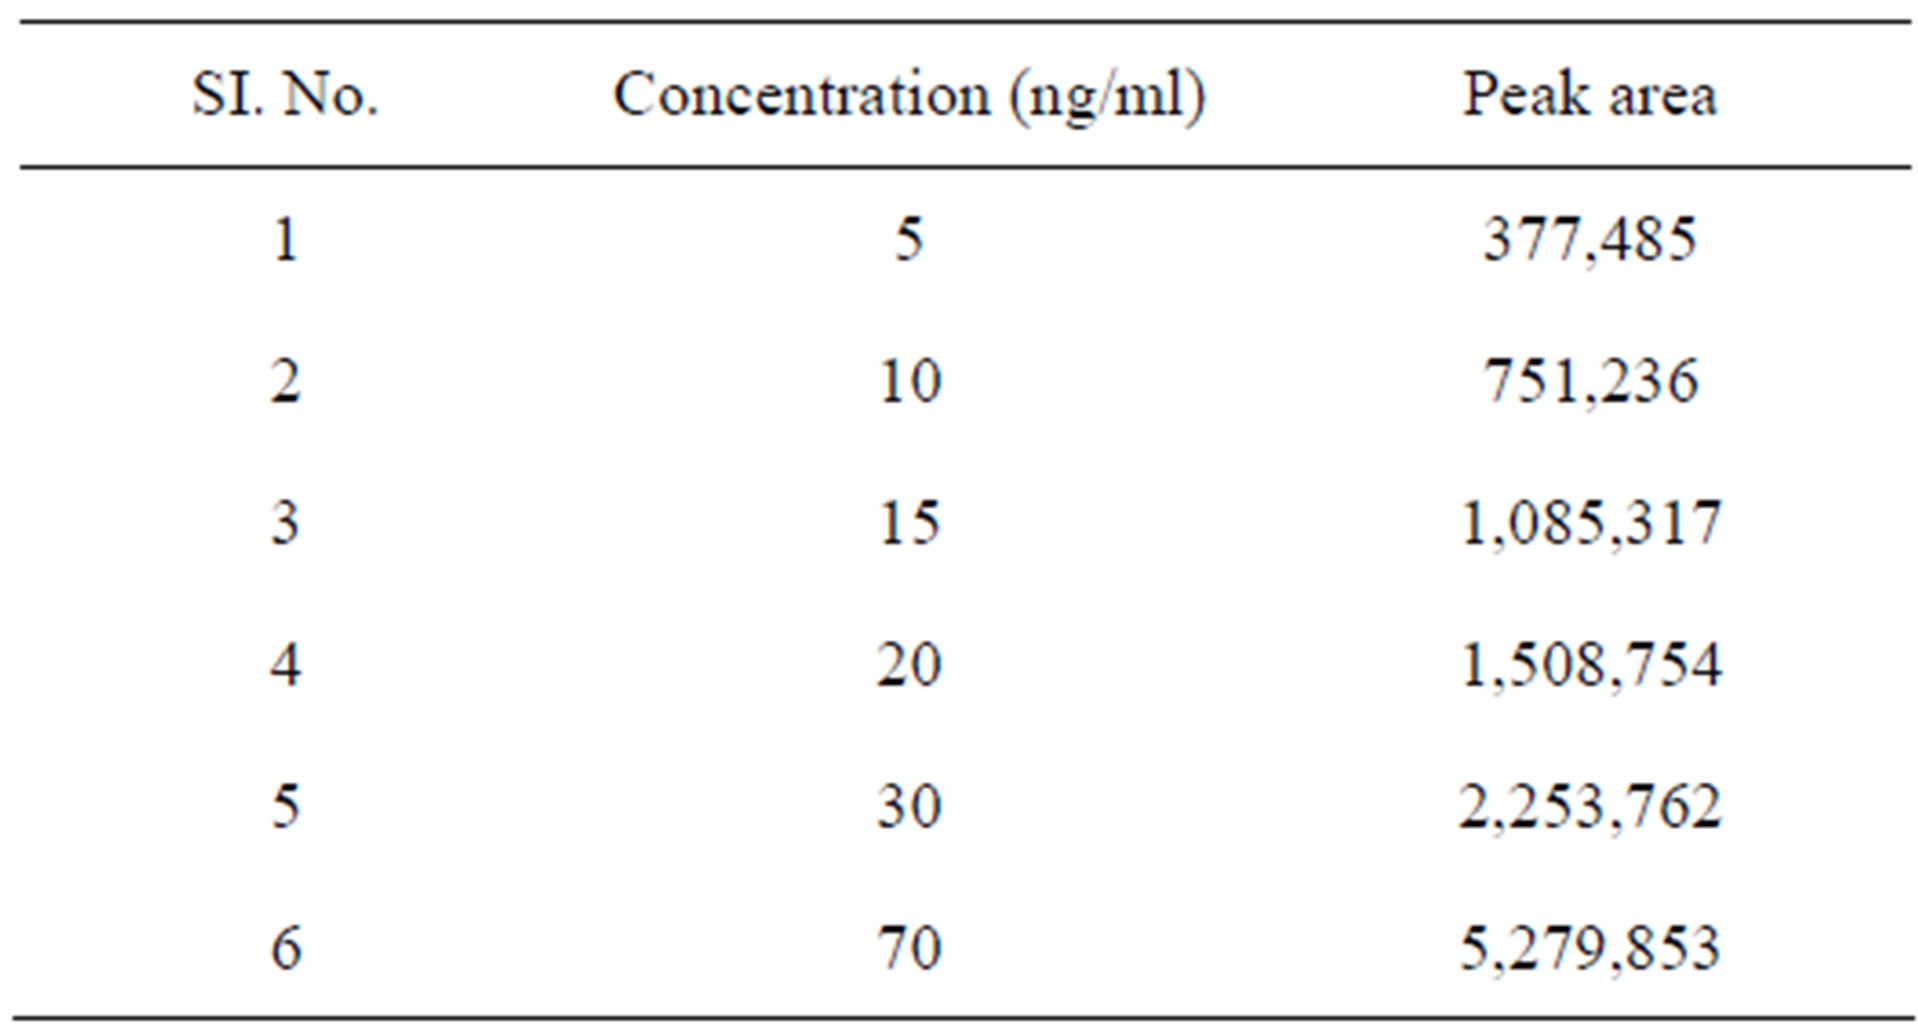
Table 1. Results of calibration curve at 265 nm for bosentan by HPLC.
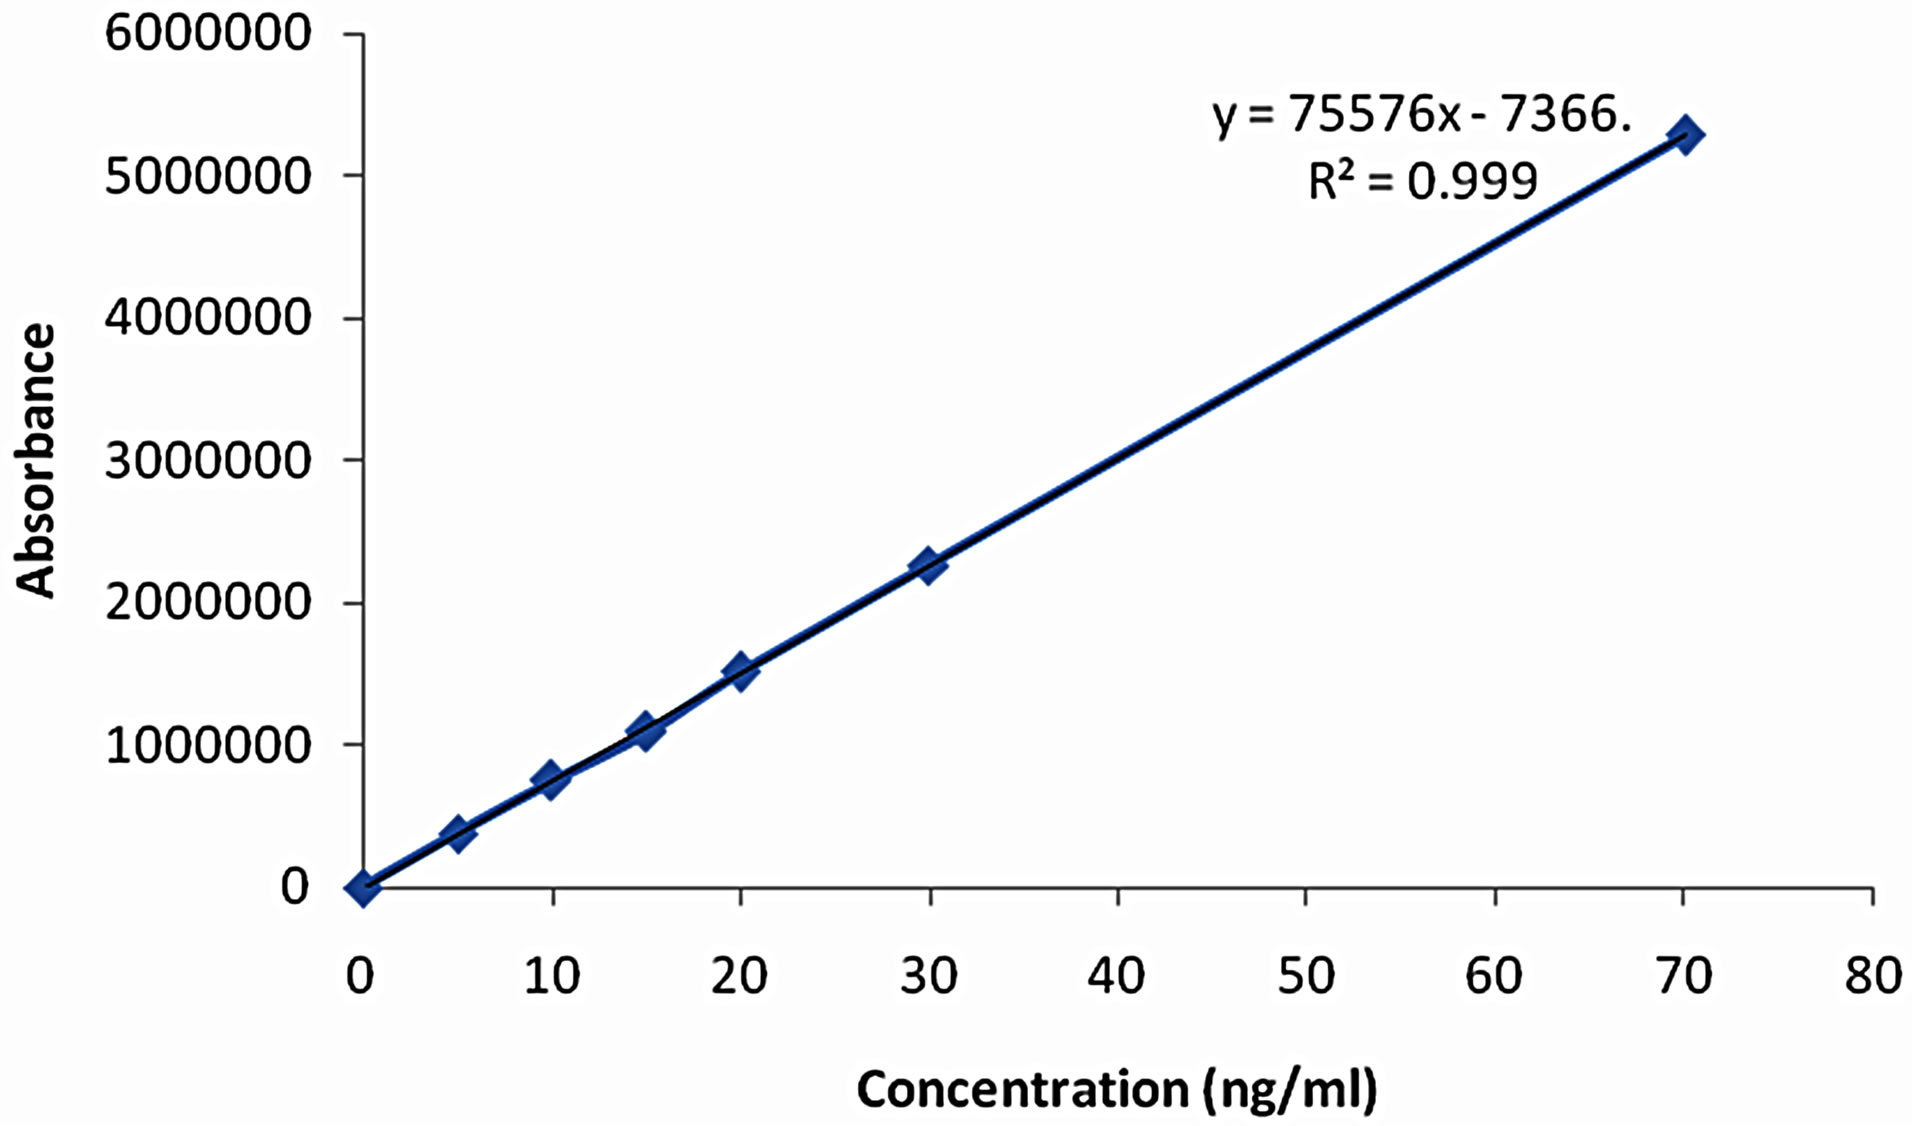
Figure 2. Calibration curve of bosentan.
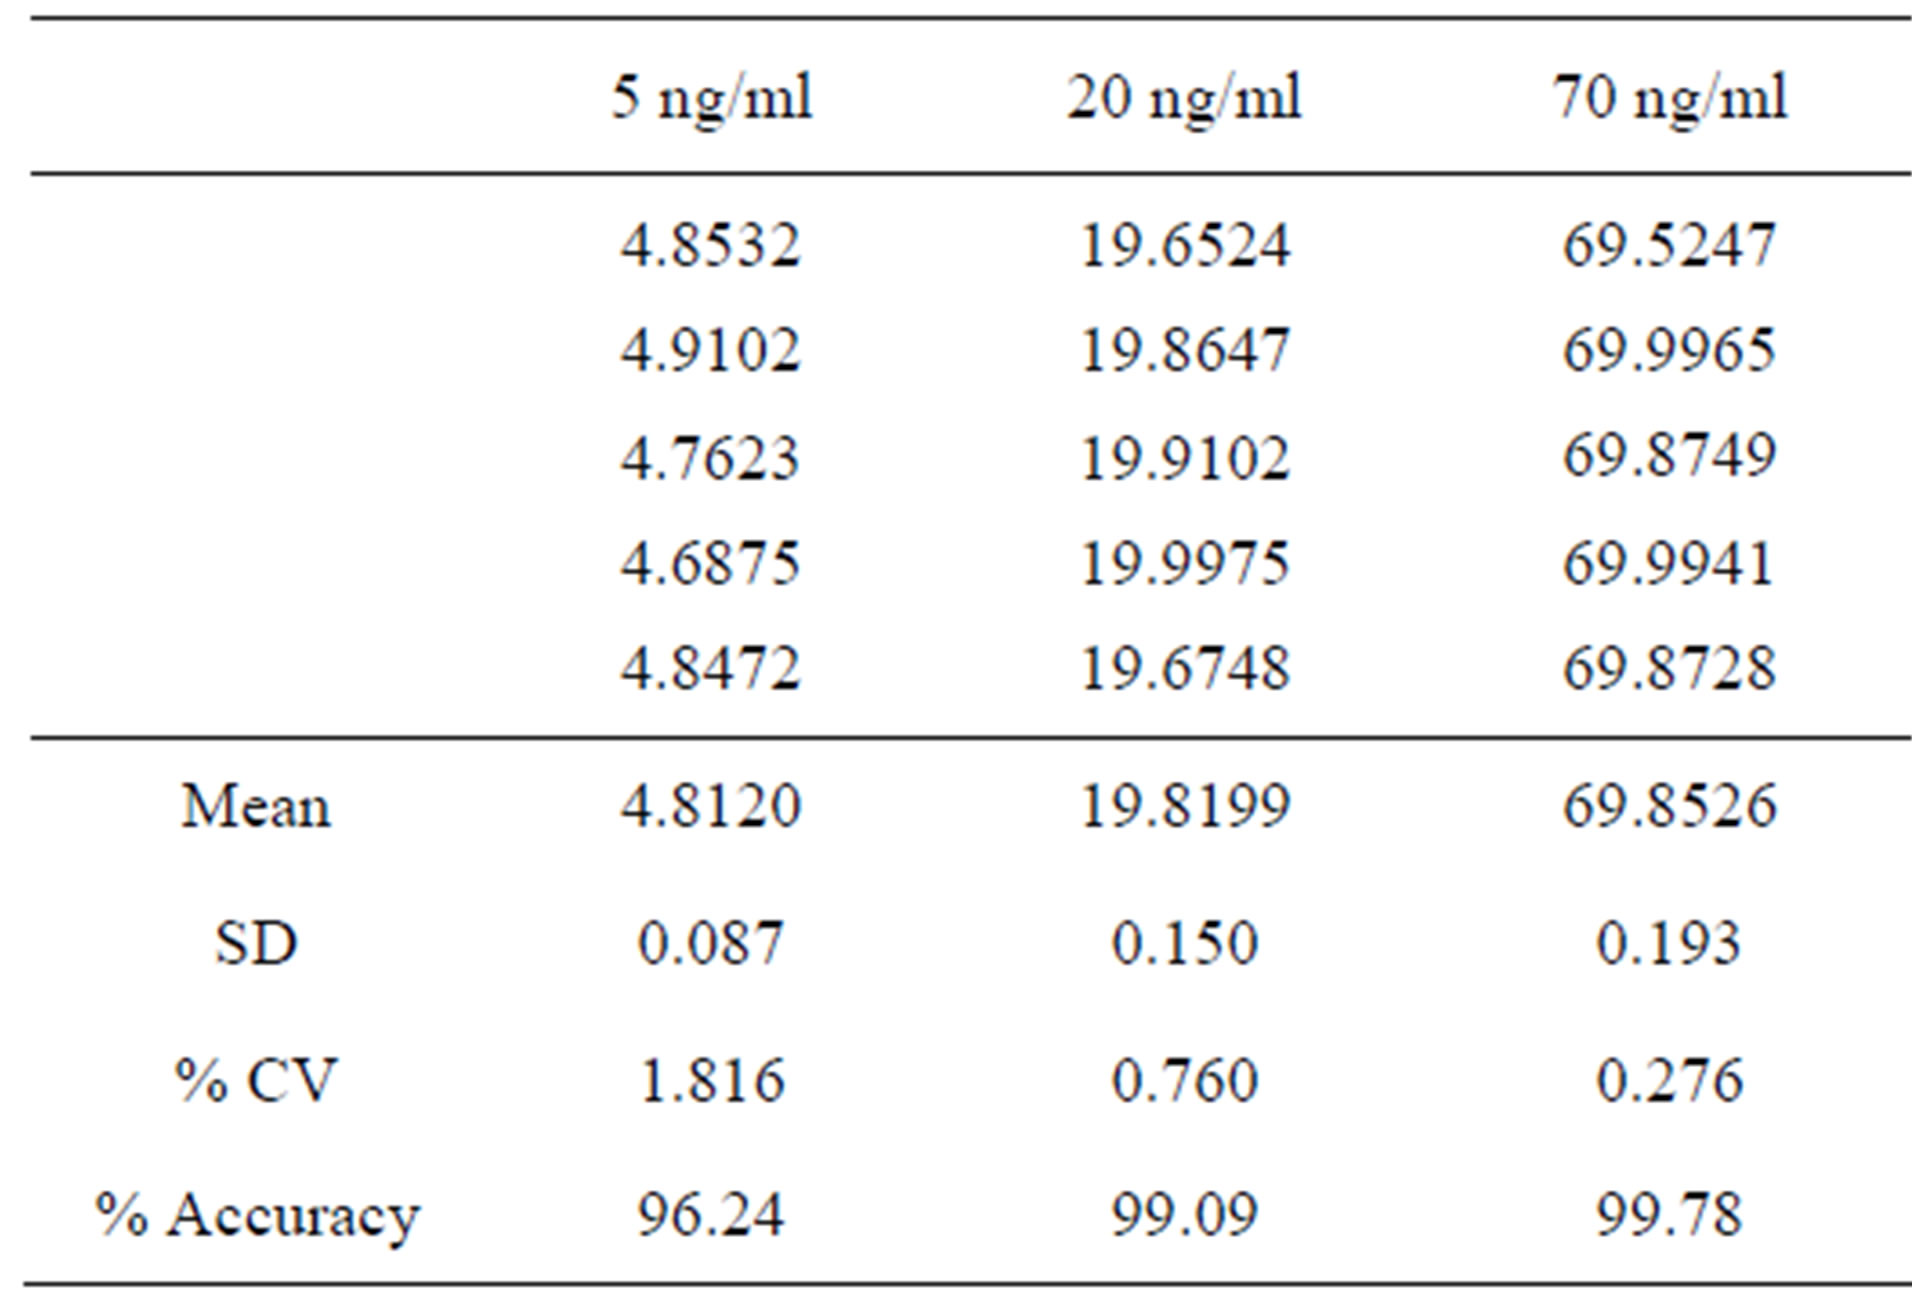
Table 2. Accuracy studies of bosentan.
3.8. Recovery Studies
The recovery studies were carried out using specified concentration range and the percentage recovery of bosentan. The results are presented in the Table 4.
3.9. Solution Stability
In order to demonstrate the stability of standard and sample solutions during analysis, both solutions were analyzed over a period of 5 h at room temperature. The results show that for both solutions, the retention time and peak area of bosentan remained almost unchanged and
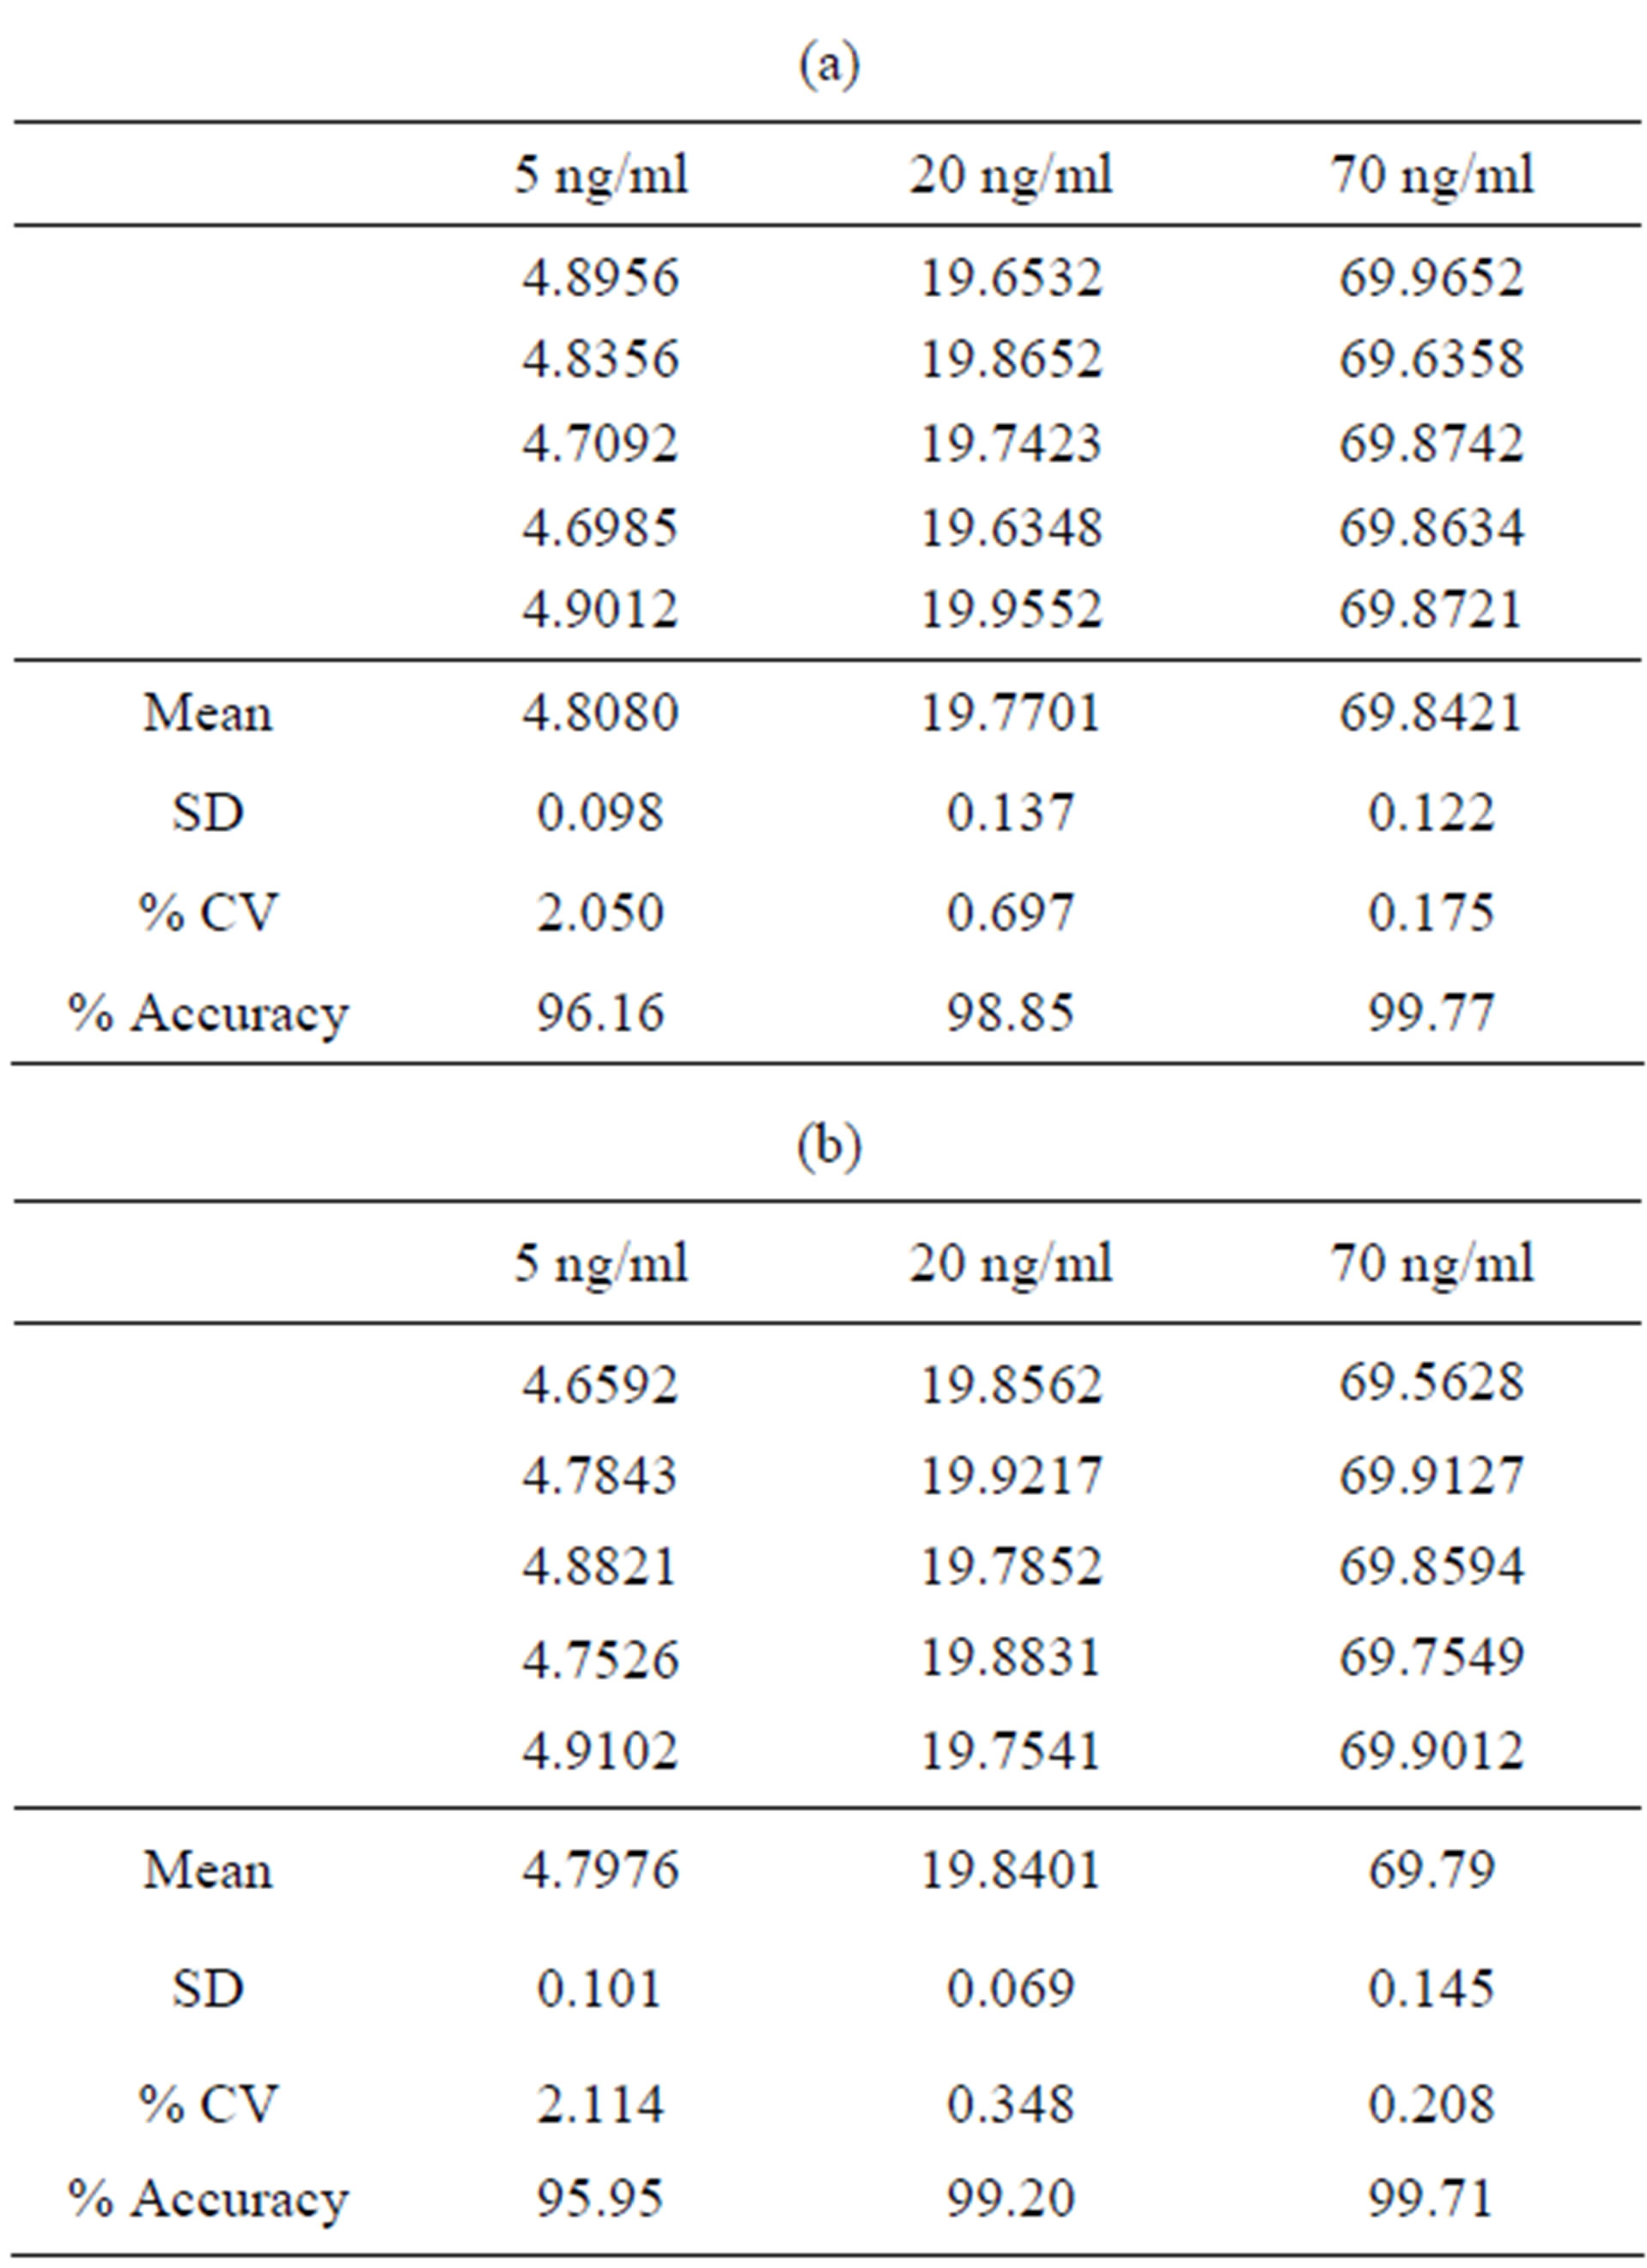
Table 3. (a) Precision result of bosentan (Intraday result); (b) Interday result.
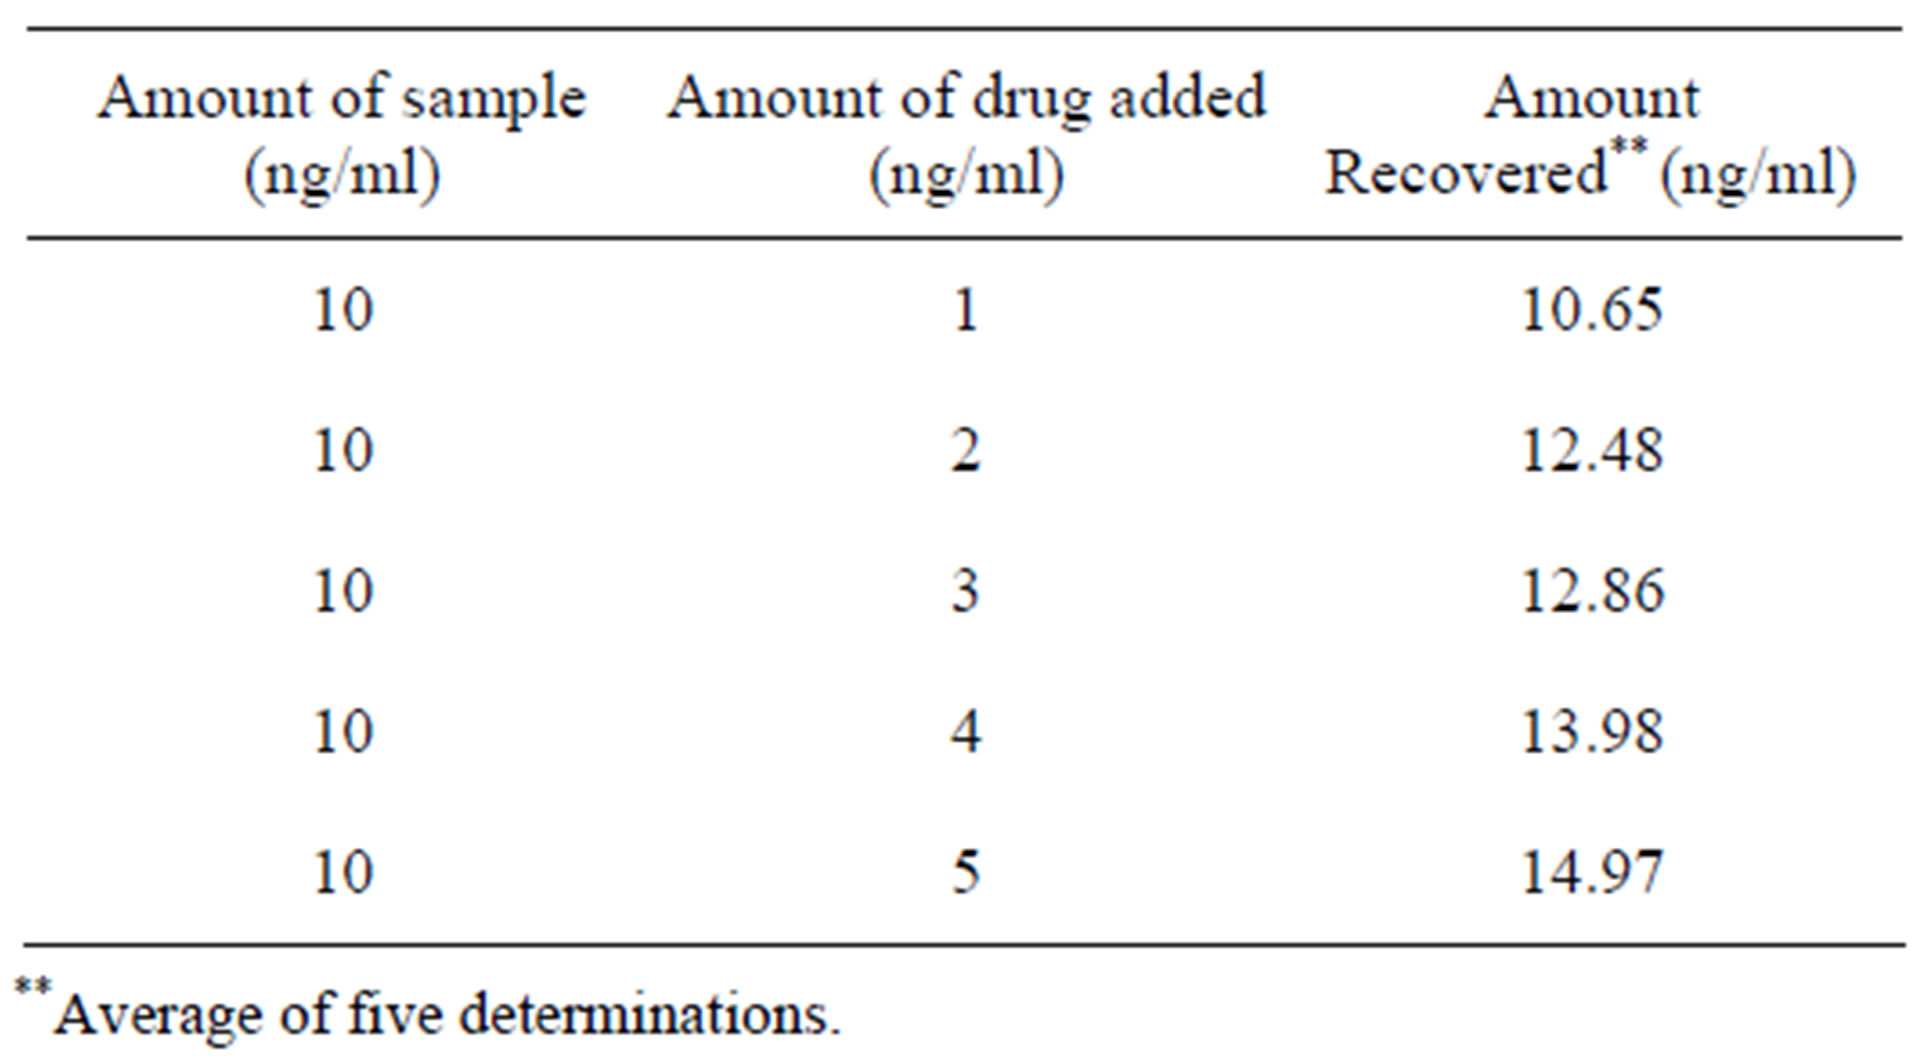
Table 4. Recovery studies of bosentan.
no significant degradation within the specified period, thus indicated that both solutions were stable for at least 5 h, which was sufficient to complete the whole analytical process.
3.10. System Suitability Studies
The column efficiency, resolution and peak asymmetry were calculated for the standard solutions. The values obtained demonstrated the suitability of the system for the analysis of this drug and the system suitability parameters fall within ±3% standard deviation range during routine performance of the method. The results are presented in Table 5.
3.11. Robustness and Ruggedness
Robustness of an analytical method is a measure of its capacity to remain unaffected by small but deliberate variations in method parameters, and provides an indication of its reliability during normal usage. Robustness of the current method was investigated by analyzing samples of the drug product using the same chromatographic conditions set forth in method development but with a small change in the chromatographic parameters (Table 6). Ruggedness of the current method was demonstrated by analyzing six samples (assay) of tablet formulation by two analysts in the same laboratory.
4. Conclusion
Proposed study describes new reverse phase high performance liquid chromatographic method for the estimation of bosentan in formulation. The method was validated and found to be simple, sensitive, accurate and pre-
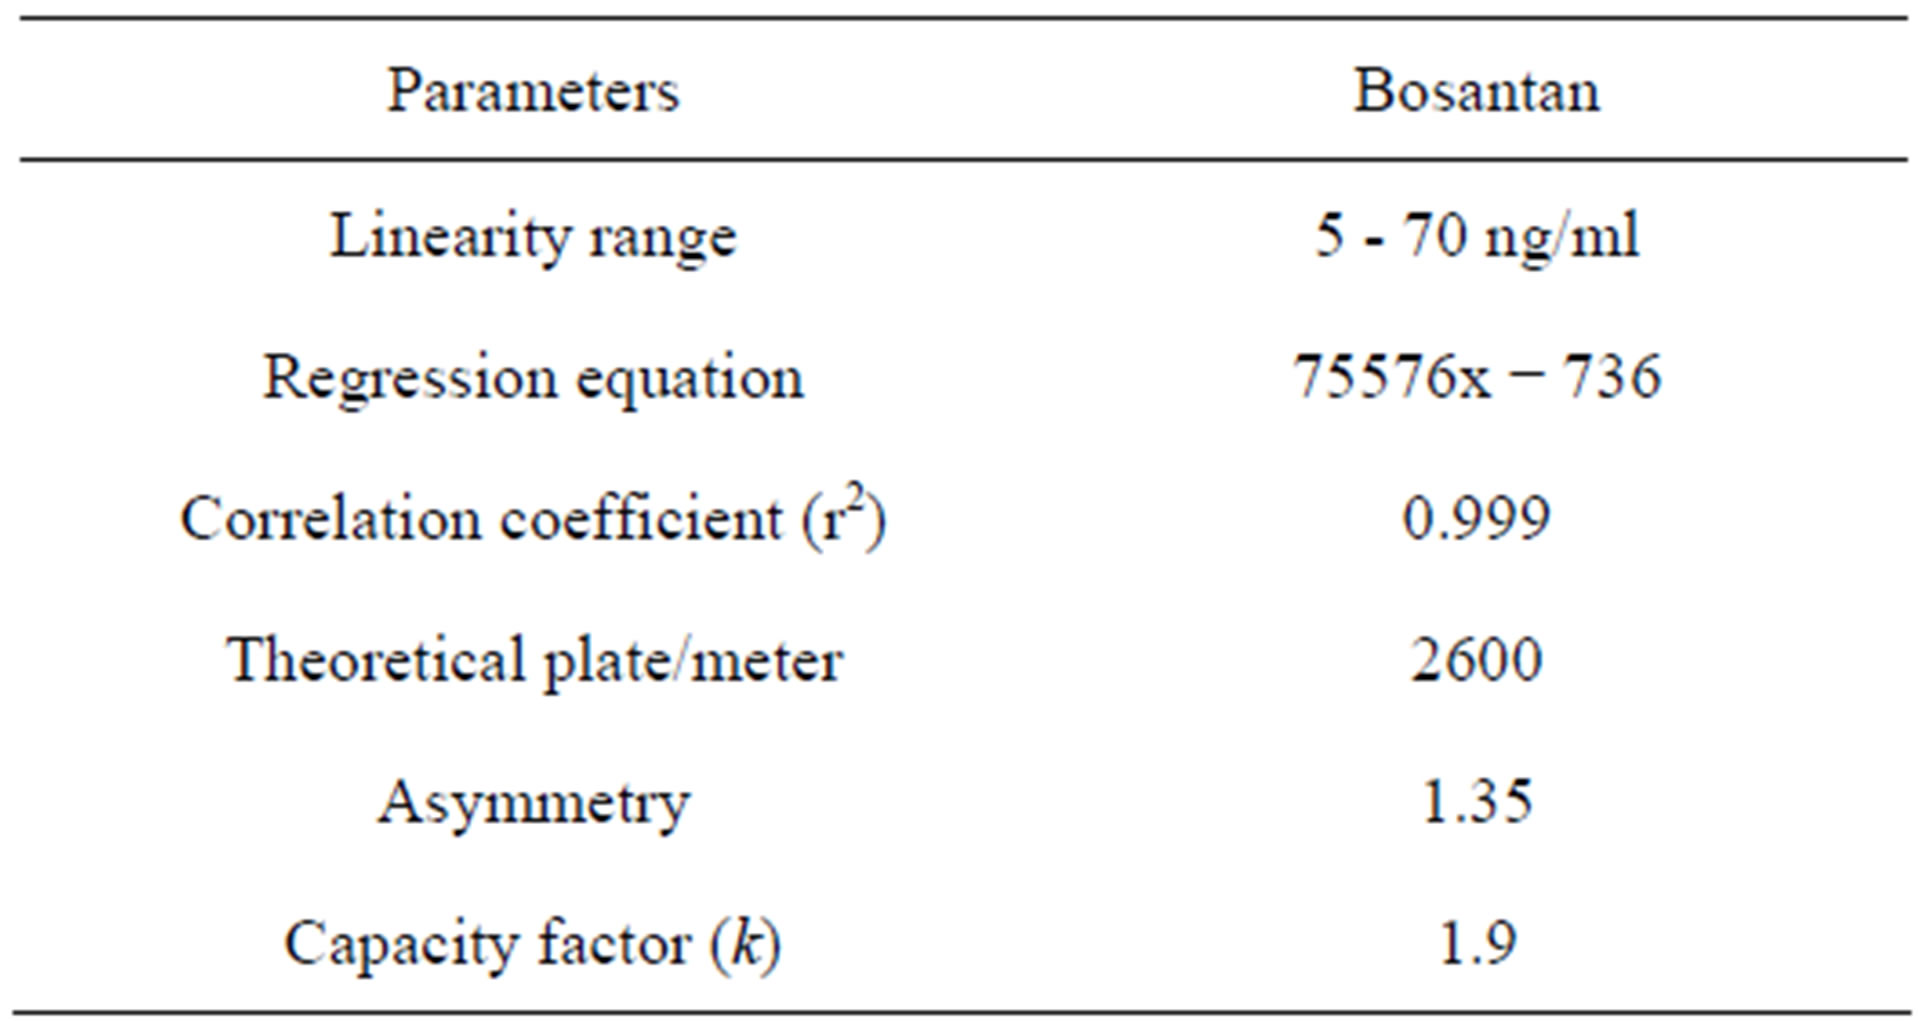
Table 5. System suitability studies.
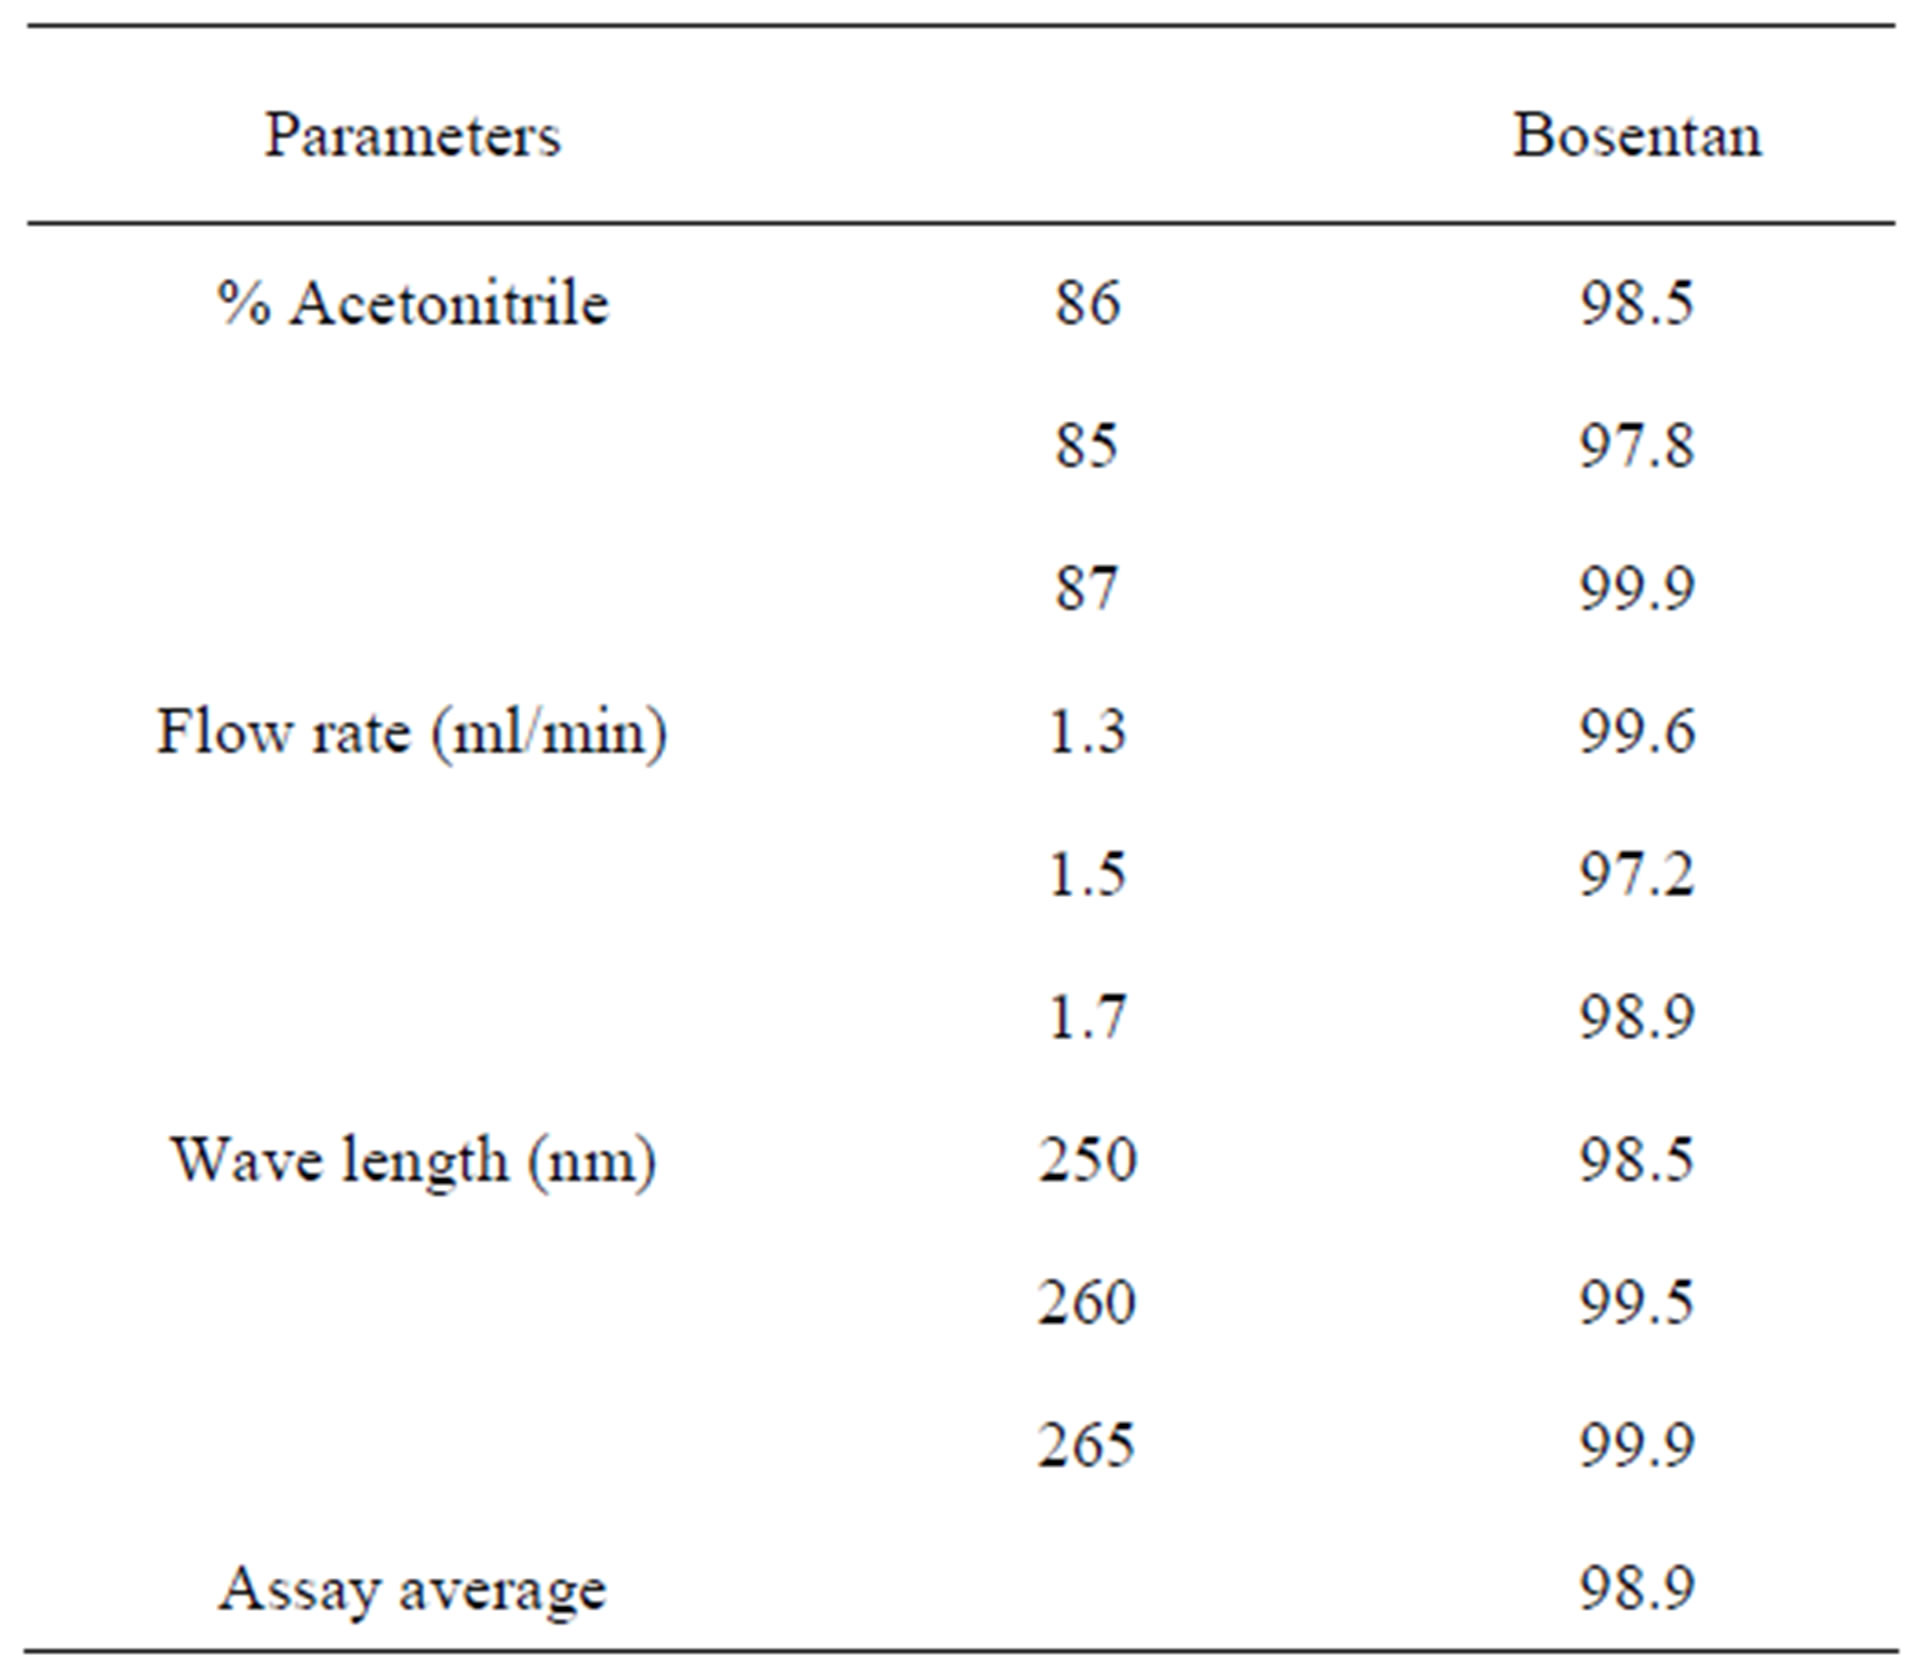
Table 6. Robustness testing of bosentan.
cise. Percentage of recovery studies shows that, the method is free from interference of the other active ingredients and additives used in the formulation. The simplicity of the method allows for application in laboratories that lack sophisticated analytical instruments such as LC-MS/MS or GC-MS/MS that are complicated, costly and time consuming rather than a simple HPLC-UV method. Thus the proposed method could be useful for the national quality control laboratories in several underdeveloped and developing countries.
REFERENCES
- www.wikipedia.org/wiki/Bosentan
- www.drugbank.ca/drugs/DB00559
- www.chemblink.com/products/147536-97-8.htm
- B. Lausecker, B. Hess, G. Fischer, M. Mueller and G. Hopfgartner, “Simultaneous Determination of Bosentan and Its Three Major Metabolites in Various Biological Matrices and Species Using Narrow Bore Liquid Chromatography with Ion Spray Tandem Mass Spectrometric Detection,” Journal of Chromatography B: Biomedical Sciences and Applications, Vol. 749, No. 1, 2000, pp. 67- 83. doi:10.1016/S0378-4347(00)00386-8
- A. S. Jadhav, B. S. Landge, S. L. Jadhav, N. C. Niphade, S. R. Bembalkar and V. T. Mathad, “Stability-Indicating Gradient RP-LC Method for the Determination of Process and Degradation Impurities in Bosentan Monohydrate: An Endothelin Receptor Antagonist,” Chromatography Research International, Vol. 2011, 2011.
- M. M. Annapurna, S. P. S. Bisht, B. V. V. R. Kumar, V. R. Kumar and A. Narendra, “Spectrophotometric Determination of Bosentan and Its Application in Pharmaceutical Analysis,” International Journal of Comprehensive Pharmacy, Vol. 2, No. 2, 2011.
- M. A. Gatzoulis, M. Beghetti, N. Galiè, J. Granton, R. M. F. Berger, A. Lauer, E. Chiossi and M. Landzberg, “LongerTerm Bosentan Therapy Improves Functional Capacity in Eisenmenger Syndrome: Results of the BREATHE-5 Open-Label Extension Study,” International Journal of Cardiology, Vol. 27, No. 1, 2008, pp. 27-32.
- J. M. Parekh, D. K. Shah, M. Sanyal, M. Yadav and P. S. Shrivastav, “Development of an SPE-LC-MS/MS Method for Simultaneous Quantification of Bosentan and Its Active Metabolite Hydroxybosentan in Human Plasma to Support a Bioequivalence Study,” Journal of Pharmaceutical and Biomedical Analysis, Vol. 70, 2012, pp. 462-470.
- G. Bansal, R. Singh, B. Saini and Y. Bansal, “ESI-MS(n) and LC-ESI-MS Studies to Characterize Forced Degradation Products of Bosentan and a Validated Stability-Indicating LC-UV Method,” Journal of Pharmaceutical and Biomedical Analysis, in Press.
- Center for Drug Evaluation and Research (CDER), “Q2B Validation of Analytical Procedures: Methodology,” Center for Drug Evaluation and Research.
NOTES
*Corresponding author.