American Journal of Analytical Chemistry
Vol. 3 No. 6 (2012) , Article ID: 20029 , 9 pages DOI:10.4236/ajac.2012.36053
NMR Chromatography: Molecular Diffusion in the Presence of Pulsed Field Gradients in Analytical Chemistry Applications
1Department of Chemistry, California State University, Fresno, USA
2Department of Pathology and Laboratory Medicine, Davis School of Medicine, University of California, Sacramento, USA
Email: krish@csufresno.edu, vvkrishnan@ucdavis.edu
Received January 23, 2012; revised February 23, 2012; accepted April 7, 2012
Keywords: NMR; Molecular Diffusion; Pulsed Field Gradients; DOSY
ABSTRACT
Nuclear magnetic resonance (NMR) spectroscopy is an excellent analytical tool for precise structural characterization of organic and bio-molecules. Though NMR is often used to characterize a single compound in solution, emerging experimental methods using pulsed-field-gradients (PFGs) allow structural dynamic characterization of several compounds, simultaneously in the same solution. NMR as a chromatography tool is often an overlooked application by analytical chemists. Therefore, in this article we introduce the concept of NMR based diffusion measurements, basic operational methods and novel applications. We expect this article to increase the overall use and appreciation of NMR-based diffusion measurements in general and in particular, in analytical chemistry applications.
1. Introduction
Nuclear magnetic resonance (NMR) measurements of self-diffusion coefficients provide useful information about the geometric properties of proteins and nucleic acids in solution. The applications of these measurements include the determination of the aggregation state of proteins [1-3], the calculations of self-association constants of peptides [4], proteins, [5] and DNA [6], the degree of ligand binding to protein substrates [7], the quantification of protein hydration [8,9] and the characterization of protein folding [10]. Self-diffusion coefficient measurements are also becoming an integral part of high throughput drug discovery in pharmaceutical research [11]. Several excellent review articles [12-20] as well as monograph [21] provide complete details of the theory, practical aspects of implementation as well as general applications. This is by no means a comprehensive review of the current status of the field and the readers are referred to the detailed reviews above for additional details.
This article is addressed to colleagues in the areas of analytical chemistry and chromatography, to highlight the use of NMR as a chromatographic technique. The focus of this article is to introduce the basic background of the diffusion coefficient measurements using NMR spectroscopy, as a routine set of applications in the area of molecular separation. The article is organized as follows: Introduction to molecular diffusion, diffusion coefficient measurements in the presence of pulsed-field-gradients beginning with the classic Hahn-echo sequence, followed by a review of the progress and advancement of these experimental methods. A select set of literature examples is presented to demonstrate the utility of “NMR Chromatography,” including the characterization of postproduction drugs and counterfeit drug mixtures, a protein ligand binding affinity analysis and methods of incorporating micelles in solution for greater NMR spectroscopic resolution. While a full understanding of the fluid dynamics of diffusion may at some point be helpful to the reader, current NMR processing software require only a background equivalent to undergraduate physical chemistry to implement these procedures into a labs repertoire.
2. Aspects of Diffusion Coefficient Measurement by NMR
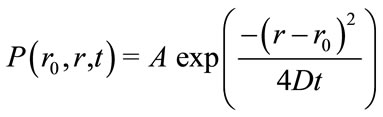
Under conditions of isotropic diffusion, or Brownian motion, the probability (P) of finding a particle at position, r, from the initial position, r0, over a time, t, results in a Gaussian function which is a solution to Fick’s second law:
 (1)
(1)
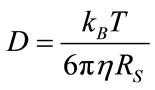
where D, is the diffusion constant with the units of area per second and A, represents a geometric volume normalization,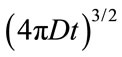 . Diffusion, D, in Equation (1) can be further defined by the Stokes-Einstein empirical relation, Equation (2), under Brownian motion:
 (2)
(2)
where kB, is the Boltzmann constant, T is temperature, η is the solvent viscosity and Rs is the Stokes radius of the analyte, a spherical approximation of a particles solvated radius in an isotropic medium. The pulsed field gradient diffusion experiment works by setting the probability distribution shown in Equation (1) as a function of the nuclear spin phase, φ, instead of the position, r. When  results in a distribution of phases based on the diffusion constant, de-phasing caused by movement during time, t, results in NMR signal intensity attenuation, which can be directly related to the diffusion constant.
2.1. Pulsed Field Gradients
Pulse field gradients (PFGs) are the cornerstone of the NMR diffusion experiment. At first glance a gradient is an applied, direct current magnetic field, whose magnetic strength changes with position. Such a field is produced by self-shielded gradient coils that are included with most commercially available NMR spectrometers for use in automatic shimming experiments. The geometry of the gradient coils allows the application of the magnetic field gradients in particular, or in a combination of axis. This change in the magnetic field as a function of position can be described by  which for our purposes can be simplified to
  so the magnetic field gradient is only along the z-axis (same as the external field). Though, it should be noted that three-axis selfshielded gradient coils do exist. This spatial effect on the magnetic field results in an increase in the Larmor frequency during the gradient pulse along the z-axis, which is then given by:
 (3)
(3)
where γ is the gyromagnetic ratio of the nucleus in question, B0 is the strength of the external magnetic field and gz is the strength of the gradient along the z-axis. Following a similar argument, the phase accumulated due to a finite gradient pulse to a nuclear spin can be written as:
 (4)
(4)
where zi is the position along the z-axis of spin i, δ is the length of the gradient pulse and t is the time the spins have been precessing. In this manner the phases of all spins in question will be dependent on the strength and width of the gradient pulse as well as and most importantly, the position of the spins relative to the z-axis.
2.2. Hahn Spin Echo PFG Experiment
The basic diffusion experiment relies on four pulses designed to encode spatial information in the phase of nuclear spins, then after a specific diffusion encoding time, Δ, determines a final position. Figure 1, shows the pulse sequence and a schematic representation of the trajectories of the spins during the pulse sequence. The Hahn pulsed field gradient spin echo (PFGSE) experiment starts with a standard 90˚ radio frequency (RF) pulse to bring the bulk magnetization into the xy-plane [22]. Soon after, a finite gradient pulse of length, δ, at power, gz, is applied. During the gradient, the phase accumulated by a spin is directly proportional to the location of the spin along the z-axis. After the gradient pulse, where spins are moving faster along the z-axis, the phase of spin i traces out a helix along the z-axis and the diffusion encoding time, Δ, begins. Halfway through the experiment, at time τ, a 180˚ RF refocusing pulse is applied (chosen so that 2τ > Δ). This pulse, called the spin echo experiment, is such that at time 2τ, different spins will be aligned as they were at the start of the sequence. In this case, the spin echo reverses the handedness of the helical phases that was produced with the first gradient pulse. At time, Δ, an identical gradient pulse is applied. Due to the reversal of the helix by the spin echo, this second gradient pulse rewinds the helix. Finally, after time 2τ the signal is acquired. If during the diffusion encoding time no spin moved, relative to the z-axis (Figure 1(a)), the first PFG and the second PFG would fully subtract and the intensity of the resulting signal would be the same as if the gradient pulses never occurred. In the case of Brownian motion, because spins are no longer at the same point along the z-axis, as they originally were, the two PFGs do not fully subtract, leading to a reduction in the amplitude of the echo signal formed at the end of 2τ (Figure 1(b)).
The greater the movement of a spin and therefore, its respective molecule along the z-axis, the greater the distribution of phases. The signal, S(2τ), at the end of the experiment, is then a function of standard attenuation during the pulse sequence by relaxation and attenuation caused by this distribution of phases:
 (5)
(5)
where S(0) is the signal at time zero, the exponential function relates to transverse relaxation and P(φ ,t), is the probability of a spin having phase, φ, at acquisition and after the two PFGs. Stejskal and Tanner solved the Bloch equations in the case of diffusion to determine intensity, E(2τ), normalized without a gradient:
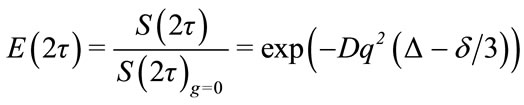 (6)
(6)
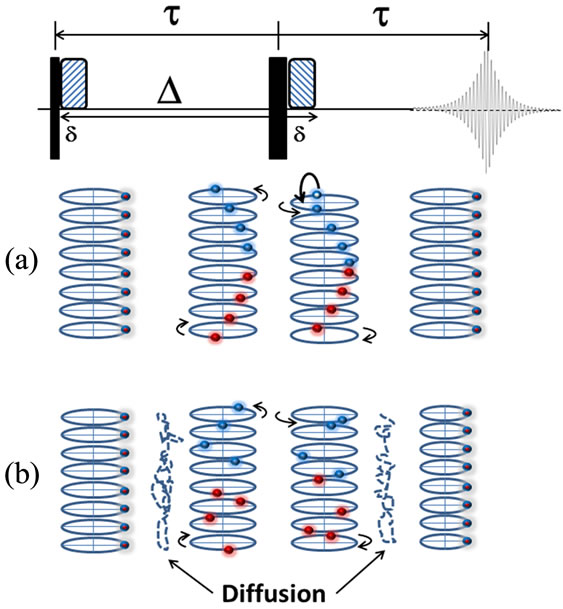
Figure 1. General description of the diffusion coefficient measurement in NMR. The Hahn spin echo sequence is shown at the top. After the first 90˚ pulse all the spins are aligned in the same direction (same phase) when looking along z-axis and after the first pulse a helical pattern of phases is seen when looking along the z-axis due to the pulsed field gradient (a). The 180˚ pulse, flips the handedness of the helical pattern and the second gradient unwinds the helix. Echo performance in the presence of molecular diffusion is shown in (b) In the case of no diffusion all the phases will realign at time 2t, in the case of diffusion some spins will “see” a different gradient strength for the second PFG then the first PFG and the phases will not align at acquisition (2τ), this causes attenuation of the resulting intensity of the spctrum. 90˚ and 180˚ pulses are represented by thin and thick bars, while the hashed bars represent pulsed field gradients.
where signal intensity is a function of the diffusion coefficient D, Δ, δ and gradient area q = gz δγ [23]. By altering any of these variables an exponential fit to E(2τ) can be made and the diffusion coefficient determined. Practically, the gradient power, gz, is usually chosen as the independent variable with between 5 and 32 gradient strengths fit to signal intensity. Also, the experiment is often repeated three or more times to determine a standard deviation in D. It is also possible to perform a linear fit of ln(E(2τ)) vs. q2(Δ–δ/3) though this may come with a loss in precision.
2.3. Advancements to the PFGSE experiment
The stimulated-echo (STE) PFG experiment is a modified version of the Hahn spin-echo [24], (Figure 2). The pulse sequence for the STE experiment sets the magnetization along the z-axis during the diffusion encoding time, choosing spin-lattice relaxation (T1) over spin-spin relaxation (T2). Spin-lattice relaxation is usually slower resulting in less loss of the intensity for larger molecules, allowing for a longer diffusion encoding time.

Figure 2. The STE diffusion experiment (a) selects for spinlattice relaxation during Δ, reducing signal loss due to attenuation for large molecules. The Longitudinal Eddy Current delay STE experiment is shown in (b) and provides a reduction in artifacts. The Bipolar Pulsed Pair LED (BPP LED) experiment is shown in (c) and can be thought of as two additional refocusing experiments (the two 180˚ pulses) which allow the two positive and negative gradients at each side of Δ to add together, increasing available gradient power from the hardware or further reducing eddy currents. Reproduced with permission from [55].
Development of the STE PFG experiment led to the longitudinal eddy current delay (LED) experiment [25]. The LED sequence removes artifacts stemming from the gradient field decay, the so called eddy currents. Further, the Bipolar Pulsed Pair LED (BPPLED) sequence provides additional eddy current reduction while also doubling the available gradient strengths from a spectrometer’s shielded gradient coil [26]. Iterations of the BPPLED experiment are most often used in diffusion ordered spectroscopy (DOSY). The ONESHOT experiment, a tuned BPPLED experiment, is one of the most common sequences used by many laboratories [27].
2.4. Diffusion Ordered Spectroscopy
Diffusion data can be expanded into higher order “spectra” by determining one axis to be the diffusion constant [28]. The basic DOSY experiment relies on a standard Fourier transform in one dimension and an inverse Laplace transform on the attenuation rates of the diffusion profile, E(2τ), leading to the diffusion coefficient in the second dimension. DOSY is powerful in its ability to separate spectra according to their diffusion constants in a mixture. This ability to separate the spectra of different species from a mixture has garnered the name, “NMR Chromatography.” This can be described by:
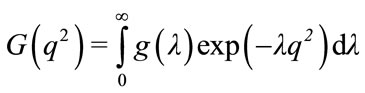 (7)
(7)
where λ = D(∆–δ/3), g(λ) is the diffusion dimension, G(q2) is the PGSE based decay function and the exponential term is the right hand side of Equation (6). The inverse Laplace transform of G(q2) results in g(λ), the ‘spectrum’ of diffusion constants.
Higher order DOSY techniques further increase the resolution in its quantitative ability to resolve structural information of individual species in a mixture. For 3D DOSY the basic experimental setup includes a BPPLED sequence followed by a standard 2D sequence. Examples of DOSY-HMQC (Heteronuclear multiple quantum coherence spectroscopy), DOSY-COSY (COrrelation Spectro-scopY), DOSY-NOESY (Nuclear Overhauser Effect SpectroscopY) and DOSY-TOCSY (Total Correlation SpectroscopY) have been described [29-40]. With 3D techniques, an experimenter further resolves species that are somewhat overlapped in the diffusion dimension by following the different spin systems.
The stimulated-echo (STE) PFG experiment is a modified version.
3. Aspects of Diffusion Coefficient Measurement by NMR
3.1. Uses in Counterfeit Medication
Recently, DOSY has been analyzed as a method for screening fake medication. The ability to resolve spectra for independent species allows for bulk tablet or solution analysis on both active and inactive ingredients. Heparins can be contaminated with oversulfated chondroitin sulfate, or over-sulfated chondroitin sulfate (OSCS), the impurity linked to adverse effects on those exposed to certain lots of heparin. Under preparative conditions where both unfractionated heparin and OSCS were both depolymerized, neither 1H-NMR nor capillary electrophoresis alone was able to detect the OSCS contamination. In 2008, Sitkowski et al. [41], were able to show OSCS contamination by 2D-DOSY without previous knowledge of the average molecular weight of either the resultant low molecular weight heparin or OSCS. The use of DOSY in this example provides a fast and accurate screening method, particularly for market samples where OSCS contamination is possible. Figure 3, summarizes the results from this study.
Trefi et al., studied eight Cialis®tablets where seven were known or suspected counterfeit formulations by 2D DOSY 1H NMR and Raman spectroscopy [42]. The DOSY spectrum created a fingerprint model which was powerful enough to distinguish all eight tablets, with spectral assignments made for key peaks such as propylene
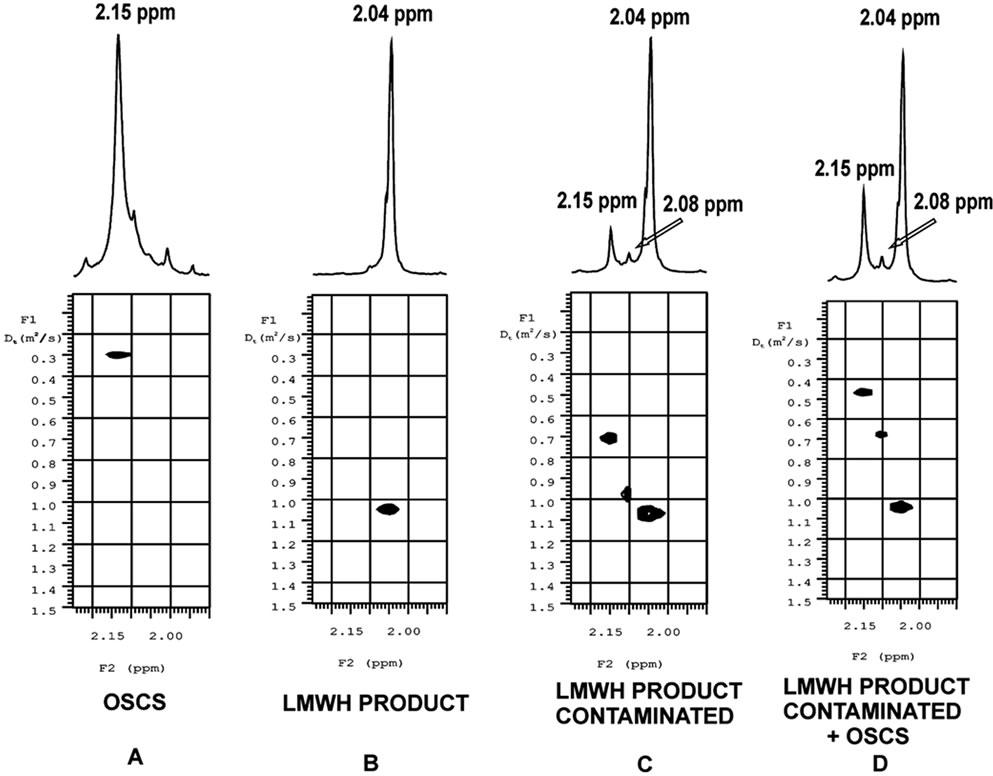
Figure 3. Application of diffusion ordered spectroscopy (DOSY) in the assessment of Oversulfated Chondroitin Sulfate (OSCS) in Low Molecular Weight and Unfractionated (LMWU) Heparins. 1H NMR DOSY traces of the N-acetyl region in the spectra of (A) OSCS; (B) Low molecular weight market product; (C) Low molecular weight market product contaminated with DS and OSCS and (D) Sample in (C) spiked with OSCS. Reproduced with permission from [41].
glycol, hydroxypropylcellulose and polyethylene glycol. The same research group used 3D-DOSY-COSY 1H NMR in a subsequent study to analyze 17 Viagra® tablets, of which 16 were counterfeit. The addition of the COSY spectrum, to the DOSY, to perform a 3D-DOSY-COSY, resulted in the full structural determination of diffusion separated spectra.
In a similar experiment, Balayssac et al. [43] analyzed two formulas marketed as an herbal medicine and an all-natural sexual dysfunction product and found, without prior knowledge of the product contents, prescription only tadalafil and hydroxyhomosildenafil, along with sucrose. They also found sucrose, phenolphthalein and sibutramine, in a prescription appetite suppressant marketed as a “natural” weight loss supplement, using 3D DOSY-COSY methods.
Diffusion experiments are a technique to quickly screen final marketed mixtures, both for ‘chemical signatures’ and detailed structural information using higher dimension experiments. These techniques can be used for drug screening of final marketed products which are often a mixture of tableting agents and non-disclosed impurities.
Examples of dispersed polymer contamination characterization, counterfeit detection and fake herbal supplement detection have all been demonstrated with high levels of spectral separation. Though NMR has a relatively high limit of detection when compared to other spectroscopic methods, this added dimension of diffusions lends itself to a unique technique that produces highly accurate structural information and thereby the power of specific chemical identification.
3.2. Applications to Drug Binding
In a wonderful example of the DOSY experiment Bocian et al., probed the binding of topotecan (TPT), an antitumor agent, to topoisomerase I (TopI) with a nicked DNA oligomer [44]. In order to answer if TPT binding is in the closed lactone or open carboxylate form a DOSY experiment was conducted. They specifically looked at the C-20 proton chemical shift, which is different in the two conformations (closed vs. open) in a mixture with a nicked DNA decamer, Figure 4. The observed diffusion coefficient in this case was a weighted average of the diffusion constants of the “free” and “bound” TPT, given by:
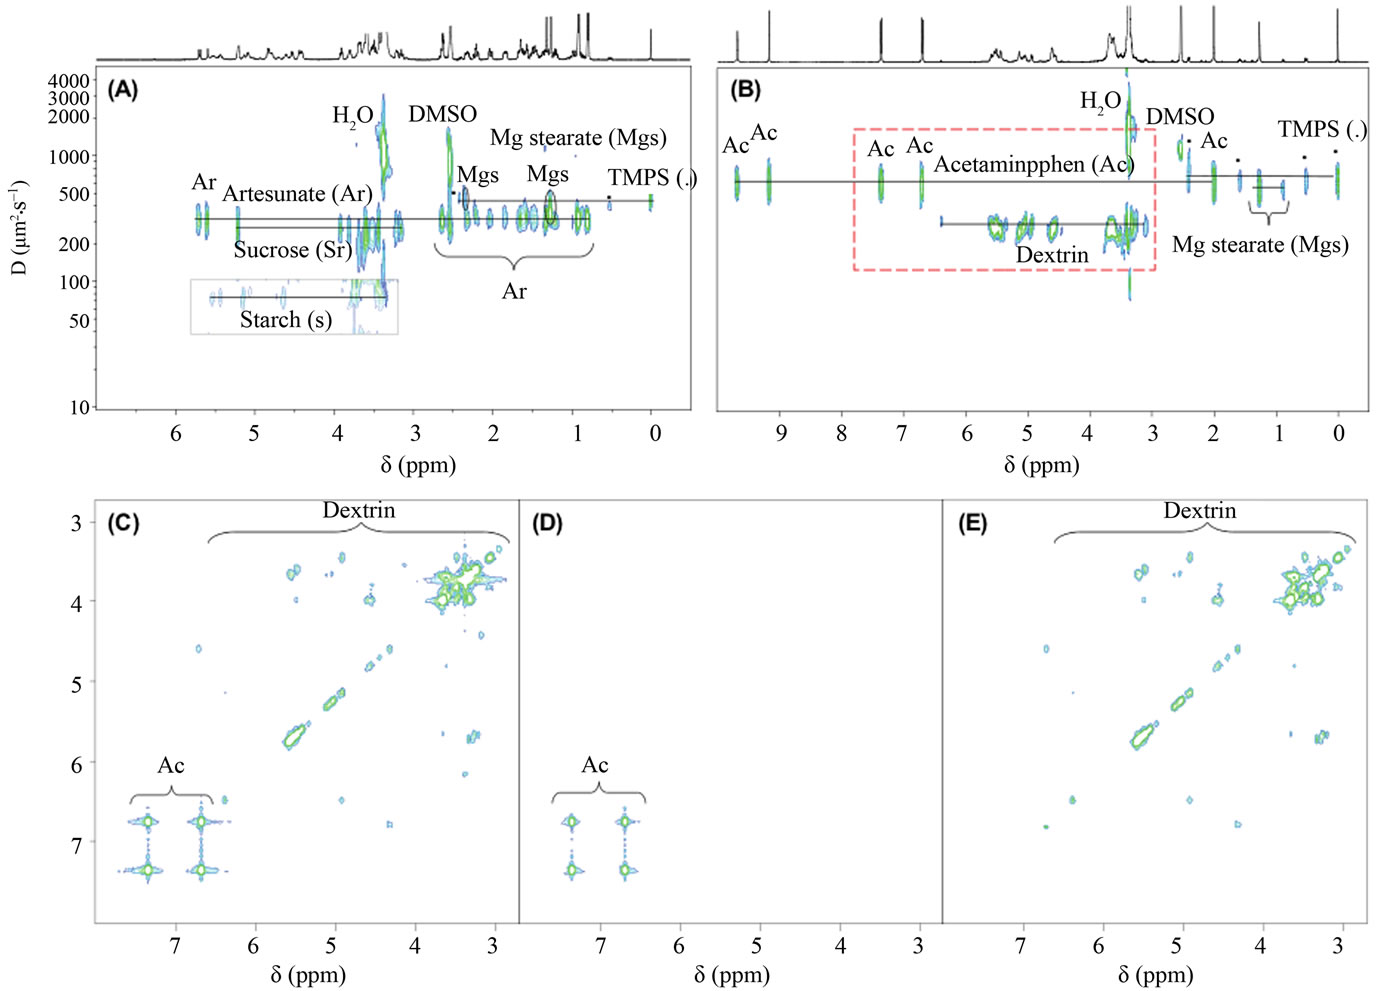
Figure 4. A DOSY spectrum showing the methyl peak off of thymine 7 from a DNA oligomer and the carboxylate and lactone peaks from topotecan. The two peaks from topotecan would have the same diffusion constant (within error) without the presence of the DNA oligomer. Reproduced with permission from [44].
 (8)
(8)
where Dobs is the observed diffusion constant, Df is the diffusion constant of the free analyte and ff is the mole fraction of free analyte, likewise Db and fb are respecttively the diffusion constant and the mole fraction of the bound analyte [45-47] . This relation holds, under the assumption that the binding exchange is much faster than the diffusion encoding time, ∆. From this relation, the binding of an analyte to a larger substrate, in this case a DNA oligomer, reduced the observed diffusion coefficient, defined by the binding constant, Ka given by
 (9)
(9)
where [R] is the concentration of unbound DNA oligomer. This approach provides a binding constant for the lactone form (Ka = 3.78 ± 0.1 mM–1) and for the carboxylate form (Ka = 0.1 ± 0.01 mM–1). To solve Equation (9), Df is the diffusion constant for the free TPT without DNA and Db is the diffusion constant of the DNA oligomer without TPT; based on the assumption that TPT binding did not significantly affect the diffusion constant of the DNA oligomer. It is worth noting again that PGSE experiments are sensitive to binding constants in the mM–1 range, though the necessity of exchange to be much faster than the duration between gradient pulses, ∆, places an upper limit on the experimentally viable exchange rates.
3.3. Matrix Assisted DOSY
As described above, reversible binding often results in changes to the observed diffusion constants. Spectral separation can be achieved by introducing a binding support to the mixture, which is a method analogous to classical chromatography. Under conditions where two species in a mixture have indistinguishable diffusion constants but have different affinity constants to a support, the observed diffusion will be different, potentially allowing for spectral separation in a DOSY experiment.
The first application of matrix-assisted DOSY looked at t-butanol and neopentanol, which have very similar diffusion constants and overlapping spectra in the diffusion dimension [48]. The addition of a surfactant (150 mM dodecyltrimethylammoniumbromide (DTAB)) at a concentration above its critical micelle concentration, allowed the two organics to be separated in the diffusion dimension based on the differential binding affinity of the two analytes to the micelles; see Figure 5.
Follow-up experiments included the spectral resolution of three dihydroxybenzene isomers in both D2O with SDS and CDCl3 in DSS, or the resolution of the dipeptides Trp-Gly (MW 261.27 D) and Leu-Met (MW 262.37 D) in the presence of d25-SDS in D2O [49]. Solid sup-
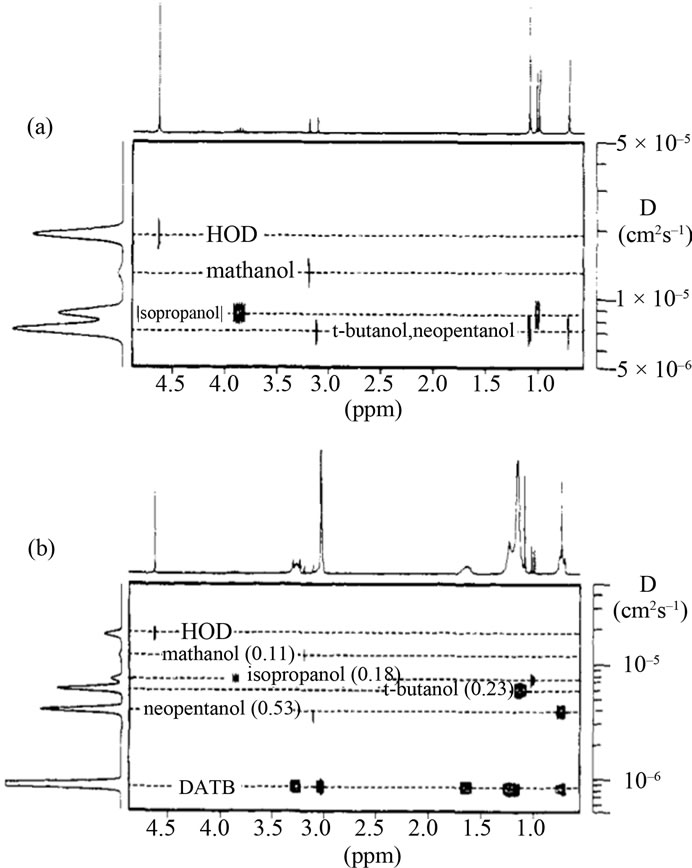
Figure 5. Shown in (a) a DOSY spectrum cannot distinguish t-butanol and neopentanol. The addition of the surfactant DTAB (b) allows for resolution due to the different affinity constants for these two analytes with the surfactant. Reproduced with permission from [48].
ports such as silica gels, have also been used for spectral separation, combined with magic spinning angle DOSY [50].
Micelle based DOSY techniques have expanded in two directions. First, towards optimization of spectral resolution of increasingly similar mixtures [51,52] and second, as a powerful probe of micelle aggregation and behavior. Tormena et al., looked at the concentration dependence of SDS and three methoxyphenol isomers [53]. In the presence of all three methoxyphenols (14 mM each), the critical micelle concentration (CMC) for SDS was reduced (to 3 mM) from the literature reported, 7 mM and with 35 mM of each methoxyphenol the CMC was 2 mM as seen in Figure 6. They further showed that resolution of the three isomers in the diffusion dimension started in the vicinity of 3 - 4 mM SDS while the methoxyphenols were at 14 - 35 mM. Maximum separation was found above 30 mM SDS (6.5 mM of each methoxyphenol), with increasing concentrations of SDS having little impact on spectral resolution, though continuing depression of the isomers observed diffusion coefficient to approximately 230 mM SDS.
In a similar probe of micelle behavior, Asaro and Savko used DOSY to determine the monomeric count of a poly-

Figure 6. SDS without the presence of di-methoxyphenols (S3) shows nominal change in diffusion through 6 - 8 mM SDS. (S1) 14 mM of three different di-methoxyphenols and (S2) 35 mM of three di-methoxyphenol show changes in diffusion between 2 and 6 mM SDS. Reproduced with permission from [53].
dispersed nonionic inverse micelle-forming surfactant (Igepal CA-520) [54]. The tert-butyl signal on the tail of this polyethyleneoxide was distinct for all eight detected ethyleneoxide oligomers (n = 2 - 9) and the observed diffusion was significantly slower with increasing monomer count. A partition constant was derived based on a standard two-state model leading to a linear correlation between Kc and the number of ethyleneoxide monomers. Finally, based on relative signal intensity, a population distribution was found in good compliance with the expected value.
4. Conclusion
From the first pulse sequence developed in the field of NMR spectroscopy, the Hahn spin echo sequence has evolved into a powerful application to study molecular diffusion properties of mixtures. The value of NMR based diffusion measurements are routinely used in both academic and industrial setups on a routine basis. It is expected to gain more importance when combined with hyphenated techniques such as LC-NMR. In this article we have made an effort to demonstrate the use of NMR chromatography in a limited area of analytical chemistry. We also caution the reader that the and it is power in interpreting the interpretation of the diffusion constants, as well as 1H NMR chemical shifts needs careful experimentation in the case of interactions as noncovalent binding of the two species in solution can influence the true diffusion, as well as the and chemical shift values.
5. Acknowledgements
KAH was supported by a graduate fellowship from the National Science Foundation (NSF Award #1059994). This work was in part supported by a RIMI (Research Infrastructure for Minority Institutions) Grant (P20 MD 002732).
REFERENCES
- A. S. Altieri, D. P. Hinton and R. A. Byrd, “Association of Biomolecular Systems via Pulsed Field Gradient Nmr Self-Diffusion Measurements,” Journal of the American Chemical Society, Vol. 117, 28, 1995, pp. 7566-7567.
- A. J. Dingley, J. P. Mackay, B. E. Chapman, M. B. Morris, P. W. Kuchel, B. D. Hambly and G. F. King, “Measuring Protein Self-Association Using Pulsed-Field-Gradient Nmr Spectroscopy—Application to Myosin Light Chain 2,” Journal of Biomolecular NMR, Vol. 6, No. 3, 1995, pp. 321-328. doi:10.1007/BF00197813
- V. V. Krishnan, “Determination of Oligomeric State of Proteins in Solution from Pulsed-Field-Gradient SelfDiffusion Coefficient Measurements. A Comparison of Experimental, Theoretical and Hard-Sphere Approximated Values,” Journal of Magnetic Resonance, Vol. 124, No. 2, 1997, pp. 468-473. doi:10.1006/jmre.1996.1082
- D. Jayawickrama, S. Zink, D. Vandervelde, R. I. Effiong and C. K. Larive, “Conformational Analysis of the BetaAmyloid Peptide Fragment, Beta(12-28),” Journal of Biomolecular Structure & Dynamics, Vol. 13, No. 2, 1995, pp. 229-244. doi:10.1080/07391102.1995.10508836
- I. V. Nesmelova and V. D. Fedotov, “Self-Diffusion and Self-Association of Lysozyme Molecules in Solution,” Biochimica et Biophysica Acta-Protein Structure and Molecular Enzymology, Vol. 1383, No. 2, 1998, pp. 311- 316. doi:10.1016/S0167-4838(97)00224-0
- J. Lapham, J. P. Rife, P. B. Moore and D. M. Crothers, “Measurement of Diffusion Constants for Nucleic Acids by NMR,” Journal of Biomolecular NMR, Vol. 10, No. 3, 1997, pp. 255-262. doi:10.1023/A:1018310702909
- A. J. Lennon, N. R. Scott, B. E. Chapman and P. W. Kuchel, “Hemoglobin Affinity for 2,3-Bisphosphoglycerate in Solutions and Intact Erythrocytes: Studies Using Pulsed-Field Gradient Nuclear Magnetic Resonance and Monte Carlo Simulations,” Biophysical Journal, Vol. 67, No. 5, 1994, pp. 2096-109. doi:10.1016/S0006-3495(94)80693-9
- V. Dötsch and G. Wider, “Exchange Rates of Internal Water Molecules in Proteins Measured Using Pulsed Field Gradients,” Journal of the American Chemical Society, Vol. 117, No. 22, 1995, pp. 6064-6070. doi:10.1021/ja00127a020
- W. S. Price, M. Nara and Y. Arata, “A Pulsed Field Gradient NMR Study of the Aggregation and Hydration of Parvalbumin,” Biophysical Chemistry, Vol. 65, No. 2-3, 1997, pp. 179-187. doi:10.1016/S0301-4622(97)00003-3
- J. A. Jones, D. K. Wilkins, L. J. Smith and C. M. Dobson, “Characterisation of Protein Unfolding by NMR Diffusion Measurements,” Journal of Biomolecular NMR, Vol. 10, No. 2, 1997, pp. 199-203. doi:10.1023/A:1018304117895
- P. J. Hajduk, E. T. Olejniczak and S. W. Fesik, “OneDimensional Relaxationand Diffusion-Edited NMR Methods for Screening Compounds That Bind to Macromolecules,” Journal of the American Chemical Society, Vol. 119, No. 50, 1997, pp. 12257-12261. doi:10.1021/ja9715962
- S. Caldarelli, “Chromatographic NMR: A Tool for the Analysis of Mixtures of Small Molecules,” Magnetic Resonance in Chemistry, Vol. 45, 2007, pp. S48-S55. doi:10.1002/mrc.2143
- S. Cozzolino, M. G. Sanna and M. Valentini, “Probing Interactions by Means of Pulsed Field Gradient Nuclear Magnetic Resonance Spectroscopy,” Magnetic Resonance in Chemistry, Vol. 46, 2008, pp. S16-S23. doi:10.1002/mrc.2345
- P. Griffiths and P. Stilbs, “NMR Self-Diffusion Studies of Polymeric Surfactants,” Current Opinion in Colloid & Interface Science, Vol. 7, No. 3-4, 2002, pp. 249-252. doi:10.1016/S1359-0294(02)00042-0
- P. Occhipinti and P.C. Griffiths, “Quantifying Diffusion in Mucosal Systems by Pulsed-Gradient Spin-Echo NMR,” Advanced Drug Delivery Reviews, Vol. 60, No. 15, 2008, pp. 1570-1582. doi:10.1016/j.addr.2008.08.006
- F. Stallmach and P. Galvosas, “Spin Echo NMR Diffusion Studies,” In: G. A. Webb, Ed., Annual Reports on NMR Spectroscopy, Vol. 61, 2007, pp. 51-131.
- S. Zhang, “Pivotal Steps towards Quantification of Molecular Diffusion Coefficients by NMR,” Chemphyschem, Vol. 8, No. 5, 2007, pp. 635-642. doi:10.1002/cphc.200600740
- W. S. Price, “Pulsed-Field Gradient Nuclear Magnetic Resonance as a Tool for Studying Translational Diffusion. 1. Basic theory,” Concepts in Magnetic Resonance, Vol. 9, No. 5, 1997, pp. 299-336. doi:10.1002/(SICI)1099-0534(1997)9:5<299::AID-CMR2>3.0.CO;2-U
- W. S. Price, “Pulsed-Field Gradient Nuclear Magnetic Resonance as a Tool for Studying Translational Diffusion: Part II. Experimental Aspects,” Concepts in Magnetic Resonance, Vol. 10, No. 4, 1998, pp. 197-237. doi:10.1002/(SICI)1099-0534(1998)10:4<197::AID-CMR1>3.0.CO;2-S
- W. S. Price, “Protein Association Studied by NMR Diffusometry,” Current Opinion in Colloid & Interface Science, Vol. 11, No. 1, 2006, pp. 19-23. doi:10.1016/j.cocis.2005.10.005
- W. S. Price, “NMR Studies of Translational Motion,” Cambridge Molecular Science, Cambridge University Press, Cambridge, New York, 2009, xxii, 393 p.
- E. L. Hahn, “Spin Echoes,” Physical Review, Vol. 80, No. 4, 1950, p. 580. doi:10.1103/PhysRev.80.580
- E. O. Stejskal and J. E. Tanner, “Spin Diffusion Measurements; Spin Echoes in the Presence of Time Dependent Magnetic Field Gradients,” Journal of Chemical Physics, Vol. 42, No. 2, 1965, pp. 288-292. doi:10.1063/1.1695690
- J. Tanner, “Use of the Stimulated Echo in NMR Diffusion Studies,” The Journal of Chemical Physics, Vol. 52, 1970, p. 2523. doi:10.1063/1.1673336
- S. J. Gibbs and C. S. Johnson Jr., “A PFG NMR Experiment for Accurate Diffusion and Flow Studies in the Presence of Eddy Currents,” Journal of Magnetic Resonance (1969), Vol. 93, No. 2, 1991, pp. 395-402.
- D. Wu, A. Chen and C. S. Johnson, “An Improved Diffusion-Ordered Spectroscopy Experiment Incorporating Bipolar-Gradient Pulses,” Journal of Magnetic Resonance, Series A, Vol. 115, No. 2, 1995, pp. 260-264. doi:10.1006/jmra.1995.1176
- M. D. Pelta, G. A. Morris, M. J. Stchedroff and S. J. Hammond, “A One-Shot Sequence for High-Resolution Diffusion-Ordered Spectroscopy,” Magnetic Resonance in Chemistry, Vol. 40, No. 13, 2002, pp. S147-S152. doi:10.1002/mrc.1107
- K. F. Morris and C. S. Johnson Jr., “Diffusion-Ordered Two-Dimensional Nuclear Magnetic Resonance Spectroscopy,” Journal of the American Chemical Society, Vol. 114, No. 8, 1992, pp. 3139-3141. doi:10.1021/ja00034a071
- H. Barjat, G. A. Morris and A. G. Swanson, “A ThreeDimensional DOSY-HMQC Experiment for the HighResolution Analysis of Complex Mixtures,” Journal of Magnetic Resonance, Vol. 131, No. 1, 1998, pp. 131-138. doi:10.1006/jmre.1997.1332
- N. Birlirakis and E. Guittet, “A New Approach in the Use of Gradients for Size-Resolved 2D-NMR Experiments,” Journal of the American Chemical Society, Vol. 118, No. 51, 1996, pp. 13083-13084. doi:10.1021/ja9627151
- E. K. Gozansky and D. G. Gorenstein, “DOSY-NOESY: Diffusion-Ordered NOESY,” Journal of Magnetic Resonance, Series B, Vol. 111, No. 1, 1996, pp. 94-96. doi:10.1006/jmrb.1996.0066
- M. Lin and M. J. Shapiro, “Mixture Analysis in Combinatorial Chemistry. Application of Diffusion-Resolved NMR Spectroscopy,” The Journal of Organic Chemistry, Vol. 61, No. 21, 1996, pp. 7617-7619. doi:10.1021/jo961315t
- M. Nilsson, A. M. Gil, I. Delgadillo and G. A. Morris, “Improving Pulse Sequences for 3D Diffusion-Ordered NMR Spectroscopy: 2DJ-IDOSY,” Analytical Chemistry, Vol. 76, No. 18, 2004, pp. 5418-5422. doi:10.1021/ac049174f
- M. Nilsson, A. M. Gil, I. Delgadillo and G. A. Morris, “Improving Pulse Sequences for 3D DOSY: COSYIDOSY,” Chemical Communications, No. 13, 2005, pp. 1737-1739. doi:10.1039/b415099f
- M. J. Stchedroff, A. M. Kenwright, G. A. Morris, M. Nilsson and R. K. Harris, “2D and 3D DOSY Methods for Studying Mixtures of Oligomeric Dimethylsiloxanes,” Physical Chemistry Chemical Physics, Vol. 6, No. 13, 2004, pp. 3221-3227. doi:10.1039/b403960b
- R. T. Williamson, E. L. Chapin, A. W. Carr, J. R. Gilbert, P. R. Graupner, P. Lewer, P. McKamey, J. R. Carney and W. H. Gerwick, “New Diffusion-Edited NMR Experiments to Expedite the Dereplication of Known Compounds from Natural Product Mixtures,” Organic Letters, Vol. 2, No. 3, 2000, pp. 289-292. doi:10.1021/ol991239r
- D. Wu, A. Chen and C. S. Johnson, “Three-Dimensional Diffusion-Ordered NMR Spectroscopy: The Homonuclear COSY-DOSY Experiment,” Journal of Magnetic Resonance, Series A, Vol. 121, No. 1, 1996, pp. 88-91. doi:10.1006/jmra.1996.0142
- D. Wu, A. Chen and C. S. Johnson, “Heteronuclear-Detected Diffusion-Ordered NMR Spectroscopy through Coherence Transfer,” Journal of Magnetic Resonance, Series A, Vol. 123, No. 2, 1996, pp. 215-218. doi:10.1006/jmra.1996.0239
- J. M. Newman and A. Jerschow, “Improvements in Complex Mixture Analysis by NMR: DQF-COSY iDOSY,” Analytical Chemistry, Vol. 79, No. 7, 2007, pp. 2957- 2960. doi:10.1021/ac061760g
- S. Viel and S. Caldarelli, “Improved 3D DOSY-TOCSY Experiment for Mixture Analysis,” Chemical Communications, No. 17, 2008, pp. 2013-2015. doi:10.1039/b802789g
- J. Sitkowski, E. B. Bednarek, W. Bocian and L. Kozerski, “Assessment of Oversulfated Chondroitin Sulfate in Low Molecular Weight and Unfractioned Heparins Diffusion Ordered Nuclear Magnetic Resonance Spectroscopy Method,” Journal of Medicinal Chemistry, Vol. 51, No. 24, 2008, pp. 7663-7665. doi:10.1021/jm801198b
- S. Trefi, C. Routaboul, S. Hamieh, V. Gilard, M. Malet-Martino and R. Martino, “Analysis of Illegally Manufactured Formulations of Tadalafil (Cialis®) by 1H NMR, 2D DOSY 1H NMR and Raman Spectroscopy,” Journal of Pharmaceutical and Biomedical Analysis, Vol. 47, No. 1, 2008, pp. 103-113. doi:10.1016/j.jpba.2007.12.033
- S. Balayssac, V. Gilard, M. A. Delsuc and M. MaletMartino, “DOSY NMR, a New Tool for Fake Drug Analyses,” Spectroscopy Europe, Vol. 21, No. 3, 2009, pp. 10-14.
- W. Bocian, R. Kawęcki, E. Bednarek, J. Sitkowski, M. P. Williamson, P. E. Hansen and L. Kozerski, “Binding of Topotecan to a Nicked DNA Oligomer in Solution,” Chemistry—A European Journal, Vol. 14, No. 9, 2008, pp. 2788-2794. doi:10.1002/chem.200700732
- J. S. Gounarides, A. Chen and M. J. Shapiro, “Nuclear Magnetic Resonance Chromatography: Applications of Pulse Field Gradient Diffusion NMR to Mixture Analysis and Ligand-Receptor Interactions,” Journal of Chromatography B: Biomedical Sciences and Applications, Vol. 725, No. 1, 1999, pp. 79-90. doi:10.1016/S0378-4347(98)00512-X
- C. S. Johnson Jr., “Effects of Chemical Exchange in Diffusion-Ordered 2D NMR Spectra,” Journal of Magnetic Resonance, Series A, Vol. 102, No. 2, 1993, pp. 214-218. doi:10.1006/jmra.1993.1093
- W. S. Price, “Recent Advances in NMR Diffusion Techniques for Studying Drug Binding,” Australian Journal of Chemistry, Vol. 56, No. 9, 2003, pp. 855-860. doi:10.1071/CH03128
- K. F. Morris, P. Stilbs and C. S. Johnson, “Analysis of Mixtures Based on Molecular Size and Hydrophobicity by Means of Diffusion-Ordered 2D NMR,” Analytical Chemistry, Vol. 66, No. 2, 1994, pp. 211-215. doi:10.1021/ac00074a006
- R. Evans, S. Haiber, M. Nilsson and G. A. Morris, “Isomer Resolution by Micelle-Assisted Diffusion-Ordered Spectroscopy,” Analytical Chemistry, Vol. 81, No. 11, 2009, pp. 4548-4550. doi:10.1021/ac9005777
- S. Viel, F. Ziarelli and S. Caldarelli, “Enhanced Diffusion-Edited NMR Spectroscopy of Mixtures Using Chromatographic Stationary Phases,” Proceedings of the National Academy of Sciences, Vol. 100, No. 17, 2003, pp. 9696-9698. doi:10.1073/pnas.1533419100
- M. E. Zielinski and K. F. Morris, “Using Perdeuterated Surfactant Micelles to Resolve Mixture Components in Diffusion-Ordered NMR Spectroscopy,” Magnetic Resonance in Chemistry, Vol. 47, No. 1, 2009, pp. 53-56. doi:10.1002/mrc.2348
- K. F. Morris, B. A. Becker, B. C. Valle, I. M. Warner and C. K. Larive, “Use of NMR Binding Interaction Mapping Techniques to Examine Interactions of Chiral Molecules with Molecular Micelles,” The Journal of Physical Chemistry B, Vol. 110, No. 35, 2006, pp. 17359-17369. doi:10.1021/jp0627224
- C. F. Tormena, R. Evans, S. Haiber, M. Nilsson and G. A. Morris, “Matrix-Assisted Diffusion-Ordered Spectroscopy: Mixture Resolution by NMR Using SDS Micelles,” Magnetic Resonance in Chemistry, Vol. 48, No. 7, 2010, pp. 550-553. doi:10.1002/mrc.2621
- F. Asaro and N. Savko, “Resolution of a Nonionic Surfactant Oligomeric Mixture by Means of DOSY with Inverse Micelle Assistance,” Magnetic Resonance in Chemistry, Vol. 49, No. 4, 2011, pp. 195-198. doi:10.1002/mrc.2732
- Y. Cohen, L. Avram and L. Frish, “Diffusion NMR Spectroscopy in Supramolecular and Combinatorial Chemistry: An Old Parameter—New Insights,” Angewandte Chemie International Edition, Vol. 44, No. 4, 2005, pp. 520-554. doi:10.1002/anie.200300637