American Journal of Analytical Chemistry
Vol. 3 No. 3 (2012) , Article ID: 18254 , 7 pages DOI:10.4236/ajac.2012.33026
Study on Resonance Rayleigh Scattering Spectra of Mercaptopurine-Cu(II)-Nucleic Acid System
1School of Chemistry and Chemical Engineering, Southwest China University, Chongqing, China
2School of Chemistry and Environmental Engineering, Chongqing Three Gorges University, Chongqing, China
Email: *flyjd6400@sina.com
Received January 2, 2012; revised February 8, 2012; accepted February 18, 2012
Keywords: DNA; Mercaptopurine; Cuprum(II); Resonance Rayleigh Scattering
ABSTRACT
In pH 4.8 Britton-Robinson (B-R) buffer solution, Mercaptopurine (MP) could react with Cu(II) to form stable chelate compound, a new Resonance Rayleigh scattering (RRS) spectrum generated and enhanced for the binary system which the highest peak located at 453 nm as detection wavelength. But the RRS spectra could be quenched after adding herring milt DNA (hsDNA), salmon milt DNA (sDNA) and calf thymus DNA (ctDNA) into the binary system, respectively. And the weakened degree of spectra was directly proportional to the concentration of DNA. The reaction product of three nucleic acid system have identical spectral features, their range of linearity for the relation of spectral intensity with concentration respectively are 0.05 - 0.9 μg·mL–1 for hsDNA, 0.1 - 0.9 μg·mL–1 for sDNA and 0.3 - 0.9 μg·mL–1 for ctDNA; their detection limit respectively are 5 ng·mL–1 for hsDNA, 6 ng·mL–1 for sDNA, 6 ng·mL–1 for ctDNA. So a new method for determination of DNA was developed and successfully applied to determine the content of the DNA in artificial synthetized samples. At the same time the spectral features of absorption spectra and RRS spectra of the three reaction system, and the eligible reaction conditions and influencing factors were investigated in this paper.
1. Introduction
Nucleic acid is an important chemical substance in life process, which provides informations, templates and tools of generating proteins. Many anti-cancer and curecancer drugs were designed by means of DNA as the drug’s target [1]. The formation of DNA targeting compounds provided a theoretical basis to search for new anti-cancer drugs, to improve the efficacy reasonably and reduce the toxicity of anti-cancer drugs. It is a valuable and significant work for vitro selection of drugs, diagnosis and treatment of some diseases as well as the design and synthesis of novel anti-cancer. In the clinical field many anti-cancer drugs were used DNA as the main targets, which interacted with the cancer cells in DNA and damaged its structure, thereby affecting gene automatic regulation and expression, showing anti-cancer activity [2-6].
Mercaptopurine is an anti-metabolic and anti-cancer drug, which is mainly used for rapid proliferating tumor such as lymphoma and leukemia. Mercaptopurine can prevent nucleic acid synthesis, suppress cancer cell division and reproduction. And nucleic acid synthesis was disrupted but protein synthesis was not stopped, the growth was unbalanced so that cancer cells were killed. Mercaptopurine belongs to cycle-specific drug, which mainly acts on the S phase and delays G1 phase. Humoral and cellular immunity were also inhibited by Mercaptopurine. However, taking this drugs easily trigger adverse effects such as bone marrow suppression and gastrointestinal inhibition [7]. In order to improve efficacy and reduce side effects, it was need to make a deep research on the reaction mechanism of drug and DNA. At the molecular lever, we study the reaction mode of anti-cancer drug and DNA, which is extremely important for us to understand the effect mechanism and toxic effects of anti-cancer drug.
Resonance Rayleigh scattering spectral method, as a new analytical technique, has attracted people’s attention due to its high sensitivity and simplicity. It has been applied to the determination of macromolecules more and more such as nucleic acids, proteins, heparin [8-15], and drugs, surfactant, metallic and non-metallic ions. In recent years, RRS has been widely applied to analyze some multicomponent system, and our work find that the RRS quenching method can also be available for the determination of DNA. The RRS method is very susceptible to volume change of material particle in system, and it is not only has high sensitivity, but also can provide more affluent structural information. At present study on the RRS spectral features of the ternary complexes of drug with metallic ions and nucleic acid were too little researched and the RRS spectra quenching method of ternary system for determination of DNA have not been reported.
Our experiment discovered that in pH 4.8 BrittonRobinson buffer medium, the RRS spectra were enhanced and the new RRS spectra was observed when MP reacted with Cu(II) to form stable chelate compound, although the RRS spectra of both MP and Cu(II) were very weak in wavelength range of 220 - 700 nm before they interacted. We have tested MP and metallic ion such as Cu(II), Pd(II), and Pt(II) etc. formed binary system, respectively, the RRS spectra of the binary system of MP and Cu(II) was the strongest. Then the RRS spectra of the binary system were quenched after adding herring milt DNA (hsDNA), salmon milt DNA (sDNA) and calf thymus DNA (ctDNA) into the reaction system and the weakened degree of spectra was linear correlation to the concentration of DNA at the same time the absorption spectrum was changed too.
The scattering quenching relative intensity (ΔI) were in the order of hsDNA > sDNA > ctDNA. In this paper, the interaction of MP and Cu(II) had been studied by RRS spectra method, and those eligible reaction conditions and influencing factor had been investigated too. Meanwhile, the reaction mechanism of the ternary system for the drug and metallic ions reacted with nucleic acid had been discussed based on absorption and RRS spectra. Therefore, a new method for the determination of DNA was established. The experiment showed the RRS method has high sensitivity as the detection limits (3σ) was 5.0 ng·mL–1 (hsDNA), 6.0 ng·mL–1 (sDNA), 7.0 ng·mL–1 (ctDNA), respectively. The RRS spectra as a useful analytical technique has been used to study the interaction of adding nucleic acid into the binary system formed by drug and metallic ions, which can be used to explore the reaction mechanism of the ternary system, understand pharmacology and toxicity of the drug at the molecular level, provide much more information on the design and synthesis drugs of novel anti-cancer. At the same time, the RRS method had also good selectivity for the determination of nucleic acid, So a simple, sensitive and rapid method has been developed for the quantitative determination of trace amounts of nucleic acid using the Cu(II)-MP as a RRS spectral probe reagent.
2. Experimental
2.1. Apparatus and Reagents
An F-4500 fluorescence spectrophotometer (Hitachi, Japan) was used to record the RRS spectra and measure the scattering intensity. A UV-3010 ultraviolet-visibility spectrophotometer (Hitachi, Japan) was used to record the absorption spectra and measure the absorbance. The determination parameters slit was set 10.0 nm. A PHS-3C pH meter (Mettle Toledo Instrument Limited Company in Shanghai) was used to adjust pH values.
6-Mercaptopurine (MP, Sigma Co.) was dissolved in a little of 0.2 mol·L–1 NaOH to prepare 100 μg·mL–1 stock solution, and the concentration of working solution was 10 μg·mL–1 while using by deliquated.
The concentration of stock solution of Cupric(II) chloride (CuCl2, Chongqing Chemical Plant, China) was 8.7 × 10⁻³ mol·L–1 and the concentration of working solution was 8.7 × 10⁻⁴ mol·L–1 while using by deliquated.
The stock solution of nucleic acids were prepared by dissolving herring milt DNA (hsDNA, Sigma Co.), Salmon milt DNA (sDNA, Sigma Co.) and calf thymus DNA (ctDNA, Sigma Co.) in deionized water. Their concentrations were determined by absorption spectrum at 260.0 nm. The working solution of nucleic acids was 50.0 μg·mL–1. All these solution were kept in a refrigerator at 1˚C - 4˚C.
Britton-Robinson buffer solutions with different pH were prepared by mixing acid (composed of 0.04 mol·L–1 H3PO4, H3BO3) with 0.2 mol·L–1 NaOH in certain proportion. The pH values were adjusted by the pH meter. All reagents were analytical reagent grade and doubledistilled water was used in the expweiment.
2.2. General Procedure
1.0 mL pH 4.8 B-R buffer solution was added, 3.6 mL μg·mL–1 of MP working solution and 1.0 mL of 8.7 × 10⁻⁴ mol·L–1 CuCl2 solution in 10 mL calibrated flask, respectively. Shaken thoroughly, standed for 5 min. Then added appropriate volume of nucleic acids solution and double-distilled water diluted the mixture to the mark, and measured after mixed thoroughly, standed 5 min. The RRS spectra of the system were recorded with synchronous scanning at λex = λem and slit width set at 10 nm by F-4500 fluorescence spectrophotometer, the scan speed was set at 2400 nm per min. At 453 nm measured the RRS spectrum intensity IRRS of the ternary system and I0 of the reagent blank; ΔIRRS = IRRS – I0. Simultaneously, the spectra of absorption were recorded.
3. Results and Discussion
3.1. RRS Spectra
3.1.1. RRS Spectra of MP-Cu(II) Binary System
In pH 4.8 BR buffer medium, both MP and Cu(II) had very weak RRS signals in wavelength range 220 - 700 nm. However, the RRS spectrum intensity was strongly enhanced when MP reacted with Cu(II) to form stable chelate compound [Cu(MP)2]. The RRS spectrum peak was broad band and the maximum RRS peak was located at 453 nm (see Figure 1). The colorless MP solution after reacted with Cu(II) changed into yellow and it further proved there was the new product generated. The results showed that the increased of RRS intensity of MP-Cu(II) system was linear correlation with an increased concentration of MP. Hence, the reagent Cu(II) has higher sensitivity could be a sensitive RRS spectral probe for the determination of trace amount of MP.
3.1.2. RRS Spectra of MP-Cu(II)-DNA Ternary System
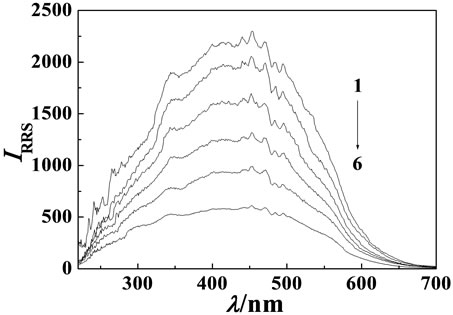
The RRS spectrum intensity of MP, Cu(II) and DNA were all very weak. But the RRS spectrum intensity of MP-Cu(II) binary system was strongly enhanced. However the RRS spectra was quenched when hsDNA, sDNA and ctDNA respectively added into the binary system, but the shape and wavelength locations of the RRS spectra were not changed (see Figure 2). Their maximum RRS wavelengths were all located at 453 nm and their relative scattering quenching intensity (ΔI) were in sequence of hsDNA > sDNA > ctDNA. The quenching intensity was directly proportional to the concentration of DNA in a certain range. In the experiment the linear ranges were 0.05 - 0.9 μg·mL–1 (hsDNA), 0.1 - 0.9 μg·mL–1 (sDNA), 0.3 - 0.9 μg·mL–1 (ctDNA), respecttively. The detection limits (3σ) were 5.0 ng·mL–1 (hsDNA), 8.0 ng·mL–1 (sDNA), 6.0 ng·mL–1 (ctDNA), respectively. The results showed that the MP-Cu(II) could be selected as higher sensitive RRS spectra probe for the determination of DNA at 453 nm.
3.1.3. Absorption Spectra of MP-Cu(II)-DNA Ternary System
The maximum absorption peak of MP was located at 322 nm, the maximum absorption peak of Cu(II) was in the far ultraviolet region, and the maximum absorption peak of hsDNA was located at 260 nm. The absorbance obviously decreased at 322 nm after fading reaction of MP by hsDNA added.
There was bigger change of the absorption spectra

Figure 1. RRS pectra of MP-Cu(II) system MP concentration, from 1 to 5: 0, 0.9, 1.8, 2.7, 3.6 μg·mL–1; Cu(II) concentration: 8.7 × 10⁻⁵ mol·L–1.
 (a)
(a)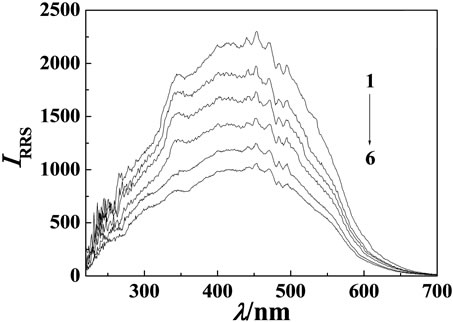 (b)
(b)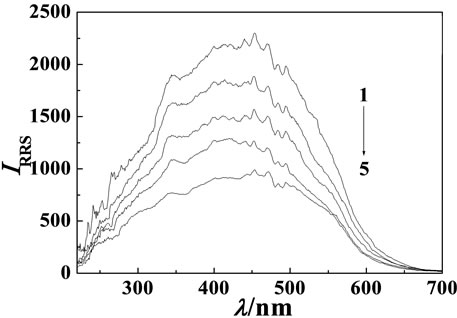 (c)
(c)
Figure 2. RRS pectra of MP-Cu(II)-DNA system. Cu(II) concentration: 8.7 × 10⁻⁵ mol·L–1; MP concentration: 3.6 μg·mL–1. (a) hsDNA concentration, from 1 to 6: 0, 0.1, 0.3, 0.5, 0.7, 0.9 μg·mL–1; (b) sDNA concentration, from 1 to 6: 0, 0.1, 0.3, 0.5, 0.7, 0.9 μg·mL–1; (c) ctDNA concentration, from 1 to 5: 0, 0.3, 0.5, 0.7, 0.9 μg·mL–1.
shape and the absorbance for the binary system of MPCu(II) which maximum absorption peak was in the far ultraviolet region, the phenomenon showed there was the new product generated. While the ternary system formed by the MP-Cu(II)-hsDNA had stronger absorbance relative to the binary system of MP-Cu(II), and the absorption spectra shape was changed (see Figure 3), The results showed the interaction of MP and Cu(II) was changed by adding hsDNA into above binary system.
3.2. Optimum Reactive Conditions
3.2.1. Effects of Acidity
The influences of different buffer solution on RRS spectra intensities of the MP-Cu(II) system were tested by using Britton-Robinson and HAc-NaAc. The results showed that the RRS spectra relative intensity (ΔI) of the binary system were very weak when we used HAc-NaAc as reaction medium, and When the Britton-Robinson was used as reaction medium, the RRS spectra relative intensity (ΔI) were stable as well as enhanced obviously. The influences of different pH on RRS spectra relative intensity (ΔI) of the system were tested by Britton-Robinson (see Figure 4). The results showed that the optimum pH range of the MP-Cu(II) system was 4.6 - 4.9, and the ΔIRRS reached the maximum and remain constant in the range. Therefore, 1.0 mL of B-R buffer solution of pH 4.8 was selected in the experiment.
3.2.2. Effects of Cu(II) Concentration
In the experiment the metal ion such as Cu(II), Pd(II), and Pt(II) etc. were tested with MP reaction formed binary system, respectively, The results showed that the RRS spectra of the binary system of MP and Cu(II) was the strongest. The influence of the concentration of Cu(II) on the RRS spectra intensity of the MP-Cu(II) system was investigated (see Figure 5). The experiment result showed that the RRS spectra intensity reached the maximum and retained stability when the concentration range of Cu(II) was from 0.87 × 10⁻⁴ mol·L–1 to 1.74 × 10⁻⁴ mol·L–1. If the concentration of Cu(II) is not enough, the reaction would be incomplete. If the concentration of Cu(II) was excessive, ΔI would decrease because of the increased of RRS spectra intensity against reagent blank. So the experiment concentration of Cu(II) was 8.7 × 10⁻⁵ mol·L–1.
3.2.3. Effects of MP Drug’s Concentration
The influence of the concentration of MP on the RRS spectra intensity of Cu(II)-MP system was investigated. The experiment result showed that the RRS spectra intensity reached the maximum and remained stabile when the concentration range of MP was from 0.24 × 10⁻⁴ mol·L–1 to 0.26 × 10⁻⁴ mol·L–1. This is coincident with composes ratio of 1:2 proved by mole ratio method in our experiment. If the concentration of MP was too small, the concentration of Cu(II) was excessive, and on the contrary, the concentration of Cu(II) was not enough, there were all had adverse influence on the complexation reaction would be incomplete. So, the experiment optimal concentration of MP was 2.5 × 10⁻⁵ mol·L–1 and suitable to used above 3.6 μg·mL–1.
3.2.4. Effects of Ionic Strength
The effect of ionic strength on the RRS spectra intensity for the ternary system was investigated with NaCl as reagent. The result showed when the concentration of NaCl solution increased, the ΔIRRS would remain con-

Figure 3. UV pectra of hsDNA-MP-Cu(II) system. Cu(II) concentration: 8.7 × 10⁻⁵ mol·L–1; MP concentration: 3.6 μg·mL–1; hsDNA concentration: 0.9 μg·mL–1 1: MP; 2: Cu2+; 3: hsDNA; 4: MP-Cu2+; 5: MP-Cu2+-hsDNA; 6: MP-hsDNA.
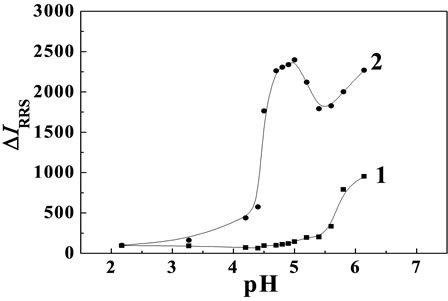
Figure 4. Effect of pH on RRS spectra. 1: Cu(II); 2: Cu(II)- MP Cu(II) concentration: 8.7 × 10⁻⁵ mol·L–1; MP concentration: 1.0 μg·mL–1.
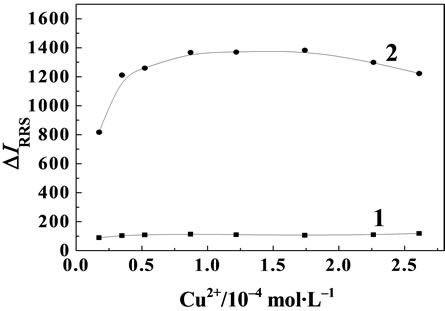
Figure 5. Effect of Cu(II) on RRS spectra. 1: Cu(II); 2: MPCu(II); MP concentration: 1.0 μg·mL–1.
stant. The effect further indicated that the ternary system formed stable chelates.
3.2.5. Effect of the Addition Order of Reagents and the Stability of the System
The effect of addition order on the RRS spectra intensity of the reaction system was tested. The result showed that the test order of buffer → MP → Cu(II) → DNA was the best order. At room temperature, the drugs could react thoroughly with metal ion to form chelates in 5 min, which could further react with DNA such as hsDNA, sDNA and ctDNA through shaking thoroughly to form ternary complexes in 5 min. The RRS spectra intensity could achieve optimum value and remain constant for 12 h at least.
3.3. The Mechanism of Interaction of MP-Cu(II)-DNA System
The RRS spectra intensity of MP, Cu(II) and DNA, while themself alone, were all very weak in weak acidic medium, because of MP was a weak acid, which was soluble in NaOH solution and mostly existed in the form of the anion [16]; MP containing multiple nitrogen atoms and sulfur atoms which has abundant electron can be easily reacted with Cu(II) to form stable chelates in the mole ratio of 1:2, which was proved with the mole ratio method in our experiment. The hydrophobic interface formed between the aromatic skeleton and water, so the RRS was enhanced.
Moreover, DNA processed negative charges, the conformation of that could be changed [17] in acidic medium. After the interaction between DNA and MP, the RRS spectra had no obviously enhancement but the absorption spectra of the drug had been cut down, due to that MP reacted with DNA base to destruct their double helix resulting in fading effect of the drug [18,19]. The N atom in DNA basic group and -OH in DNA phosphate radical could combine with Cu(II) to form coordination compound, for the valence space of Cu(II) could combined with multiple DNA, the RRS spectra intensity was not obviously enhanced but the scattering signal could been weakened when the MP-Cu(II) binary reaction system was added in DNA. From above analysis, we could speculate that MP may firstly occupy the partial space of Cu(II), then DNA integrated with the remaining space of Cu(II), thereby DNA competitively combined with Cu(II) lead to the spectra intensity of the ternary system occurrenced quenching.
3.4. Spectral Response Characteristics of MP-Cu(II)-DNA System
Under the optimum conditions, the enhanced RRS spectra intensities (ΔI) were measured while MP and Cu(II) reacted with different concentrations of Nucleic acids (hsDNA, Sdna, ctDNA), separately. The calibration graphs of ΔIRRS against the concentrations of DNA were constructed. The linear regression equation, correlation coefficients, linear ranges and detection limits (3σ) were listed in Table 1. In which the RSD (n = 11) could been

Table 1. Related parameters of the calibration graphs and the detection limits for DNA.
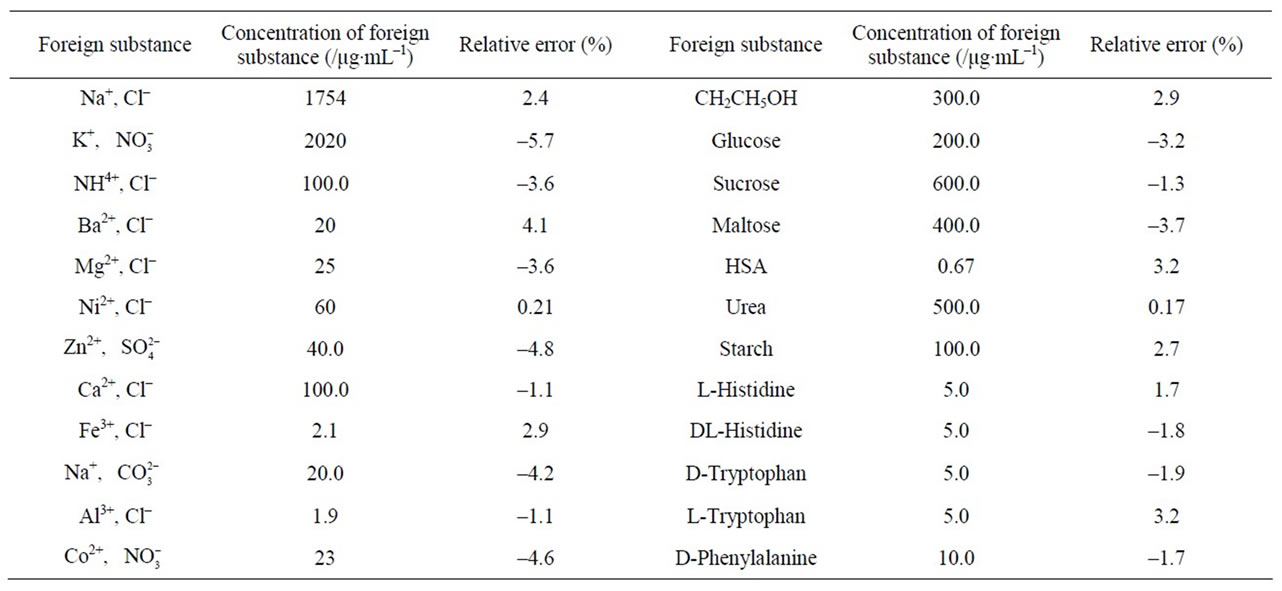
Table 2. Effect of coexisting substances (0.9 μg·mL–1 hsDNA).
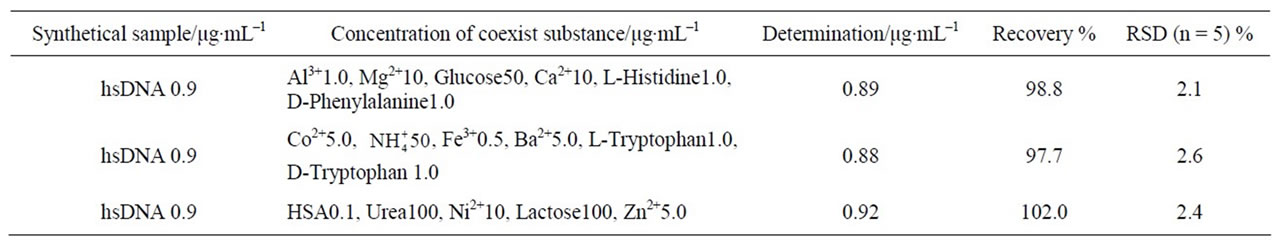
Table 3. Determination of synthesis samples.
obtained by calculated for 3.6 μg·mL–1 MP and 8.7 × 10⁻⁵ mol·L–1 Cu(II). The results show that the method for the determination of Nucleic acids has very high sensitivity.
3.5. Selectivity of the Method and Its Application
3.5.1. Effect of Coexisting Substances
Taking the MP-Cu(II)-hsDNA system as an example, under optimum conditions, we investigated the effect of some co-existing substances on the determination of hsDNA. When the concentration of hsDNA is 0.9 μg·mL–1, the tolerable concentrations (the relative deviation < ±10%) of the coexisting substances are listed in Table 2. It could be seen from the table, except for Fe(III), Al(III), most of common metal ions, nonmetal ions, and saccharides did not interfere with the determination of hsDNA. And small amount of amino acids and HSA did not interfere with the determination of hsDNA. So, the RRS spectral method would have a good selectivity.
3.5.2. Analytical Application
Determination of synthesis samples hsDNA. Three group samples were synthesized in accordance with the interfering permissible amounts of the coexistent components in Table 2, the hsDNA were determined using the RRS spectral method. The results are listed in Table 3, which shows the method had good veracity and reproducibility for determination of DNA.
4. Acknowledgements
This project was supported by “Chun hui plan” of Ministry of Education, China (No. Z2009-1-63003) and by the National Natural Science Foundation of China (No. 21175015).
REFERENCES
- J. Gallego and G. Varani, “Targeting RNA with SmallMolecule Drugs: Therapeutic Promise and Chemical Challenges,” Accounts of Chemical Research, Vol. 34, No. 10, 2001, pp. 836-843. doi:10.1021/ar000118k
- L. H. Hurley, “DNA and Its Associated Processes as Targets for Cancer Therapy,” Nature Reviews Cancer, Vol. 33, No. 2, 2002, pp. 188-200. doi:10.1038/nrc749
- X. K. Teng and H. S. Xiao, “Perspectives of DNA Microarray and Next-Generation DNA Sequencing Technologies,” Science in China Series C: Life Science, Vol. 52, No. 1, 2009, pp. 7-16. doi:10.1007/s11427-009-0012-9
- F. L. Jin, X. L. Dong, X. X. Xu and S. X. Ren, “cDNA Cloning and Recombinant Expression of the General Odorant Binding Protein II from Spodoptera Litura,” Science in China Series C: Life Science, Vol. 52, No. 1, 2009, pp. 80-87. doi:10.1007/s11427-009-0001-z
- L. Li, Z. H. Qu, H. Wang and Z. H. Li, “Methylation Reaction for Four DNA Base Molecules by Methanediazonium Ions,” Science in China Series C: Life Science, Vol. 52, No. 1, 2009, pp. 26-30.
- J. J. Zhang, Y. Shao, L. Wei, Y. Li, X. Sheng, et al., “Design of Artificial Nucleases and Studies of Their Interaction with DNA,” Science in China Series C: Life Science, Vol. 52, No. 4, 2009, pp. 402-414.
- V. W. Rmstrong and M. Oellerich, “New Developments in the Immunosuppressive Drug Monitoring of Cyclosporine, Tacrolimus, and Azathioprine,” Clinical Biochemistry, Vol. 34, No. 1, 2001, pp. 9-16. doi:10.1016/S0009-9120(00)00175-2
- Z. P. Li, K. A. Li and S. Y. Tong, “Determination for Micro Amounts of Nucleic Acids by a Resonance Light Scattering Technique with Dequalinium Chloride,” Talanta, Vol. 55, No. 4, 2001, pp. 669-675. doi:10.1016/S0039-9140(01)00423-4
- S. P. Liu, X. L. Hu, H. Q. Luo and L. Fan, “Resonance Rayleigh Scattering Spectral Characteristics of Interaction of Nucleic Acids with Some Cationic Surfactants and Their Analytical Applications,” Science in China Series B: Chemistry, Vol. 45, No. 2, 2002, pp. 173-183. doi:10.1360/02yb9024
- S. P. Liu, L. Fan, X. L. Hu, Z. F. Liu and Y. H. Chen, “Study on the Interaction between Proteins and Some Complexon Dyes by Resonance Rayleigh Scattering Method,” Acta Chimica Sinica, Vol. 62, No. 17, 2004, pp. 1635-1640.
- G. C. Zhao, P. Zhang, X. W. Wei and Z. S. Yang, “Determination of Proteins with Fullerol by a Resonance Light Scattering Technique,” Analytical Biochemistry, Vol. 334, No. 2, 2004, pp. 297-302. doi:10.1016/j.ab.2004.07.007
- S. P. Liu, H. Q. Luo, N. B. Li and Z. F. Liu, “Resonance Rayleigh Scattering Study of the Interaction of Heparin with Some Basic Diphenyl Naphthylmethane Dyes,” Analytical Chemistry, Vol. 26, No. 6, 2001, pp. 3907-3914. doi:10.1021/ac001454h
- H. Q. Luo, S. P. Liu and Z. F. Li, “Resonance Rayleigh Scattering Spectra for Studying the Interaction of Heparin with Some Basic Phenothiazine Dyes and Their Analytical Application,” Acta Chimica Sinica, Vol. 449, No. 1-2, 2001, pp. 267-270.
- J. D. Yang, S. X. Deng, Z. F. Liu, L. Kong and S. P. Liu, “Fluorescence Quenching of Serum Albumin by Rifamycin Antibiotics and Their Analytical Application,” Luminescence, Vol. 22, No. 6, 2007, pp. 559-566. doi:10.1002/bio.1001
- J. D. Yang, T. W. Cao and S. P. Liu, “Resonance Rayleigh Scattering Spectra of Rifamycins Antibiotics-Cu(II)-Nnucleic Acid System,” Acta Chimica Sinica, Vol. 66, No. 19, 2008, pp. 2131-2137.
- X. Q. Wang, T. Y. You, X. R. Yang and E. K. Wang, “End-Column Amperometric Detection of 6-Mercaptopurme by Capillary Zone Electrophoresis,” Chinese Journal of Analytical Chemistry, Vol. 27, No. 10, 1999, pp. 1141-1145.
- J. S. Su, X. M. Chen, H. A. Luo, et al., “Determination of Deoxyribonucleic Acid with New Mmagenta by a Resonance Light-Scattering Technique,” Journal of Instrumental Analysia, Vol. 24, No. 1, 2005, pp. 60-63.
- V. Vijayanathan, T. Thomas and T. J. Thomas, “DNA Nanoparticles and Development of DNA Delivery Vehicles for Gene Therapy,” Biochemistry, Vol. 41, No. 48, 2002, pp. 14085-14094. doi:10.1021/bi0203987
- S. A. Woodson, “Metal Ions and RNA Folding: A Highly Charged Topic with a Dynamic Future,” Current Opinion in Chemical Biology, Vol. 9, No. 2, 2005, pp. 104-109. doi:10.1016/j.cbpa.2005.02.004
NOTES
*Corresponding author.