American Journal of Analytical Chemistry
Vol. 3 No. 1 (2012) , Article ID: 16807 , 5 pages DOI:10.4236/ajac.2012.31001
Comparison between Two FT-IR Spectroscopy Analytical Procedures for Micrograms Determination of Asbestos Species in Bulk Materials
1Institute for Microelectronics and Microsystems, Unit of Naples, National Research Counsi, Napoli, Italy
2Technology Department, University of Naples “Parthenope”, Napoli, Italy
Email: *luca.destefano@na.imm.cnr.it
Received October 14, 2011; revised November 18, 2011; accepted December 3, 2011
Keywords: Asbestos Containing Materials; Quantitative Methods; Infrared Spectroscopy
ABSTRACT
The Fourier Transform Infrared (FT-IR) spectroscopy is by far known to be a useful technique for qualitative and quantitative analysis of asbestos in bulk samples, since all asbestos species exhibit intense absorption peaks in the 4000 - 400 cm–1 region of the infrared spectrum. In the present work, we compare the accuracy and precision of two analytical procedures (the Linear Calibration Curve Method and the Method of Addition) for the quantitative determination of asbestos in a host matrix. We have found that, providing careful samples preparation, both techniques quantify the asbestos content at the level of few micrograms with good precision. Due to less expensive equipment requirements and shorter analysis time, FT-IR can be a competitive analytical technique in the characterization of asbestos containing material with the respect to diffractometry or electron microscopy.
1. Introduction
Although more then ten years passed from the publication of the Italian law n. 257/92, which has imposed a general ban on asbestos containing materials (ACM), there are at least three good reasons to care about their environmental monitoring: first of all, it is often necessary, especially during buildings demolitions or renovations, to analyze and identify ACM for a correct planning of disposal operations and protecting workers and public health conditions. Asbestos wastes are classified as hazardous and they must be inertised in some way (thermally, chemically, mechanically and so on) before their disposal in controlled landfills, as stated by the new Italian directive (Ministerial Decree n. 248 July 29, 2004, Italian Ministry of Public Health), so that fast and reliable analytical techniques for their control are needed [1,2]. Furthermore, due to global marketing, it’s also very important to be able to reveal asbestos traces in products imported from foreign countries which still use it in order to prevent their involuntary introduction into the fabrication process [3].
In Italy, the Ministerial Decree issued on September 6, 1994 indicates some analytical techniques and methods for qualitative and quantitative ACM characterization: X ray diffraction (XRD), Fourier Transform Infrared Spectroscopy (FT-IR), and Scanning Electron Microscopy (SEM). In the law recommendations, it is stated that the first two can be adopted for identification and quantitative determination of asbestos in bulk materials if the fibers content is greater then 3 × 10⁵ ff/mg; under this limit the samples must be analyzed by SEM. It is clear that these three technology, properly used, allow a specific characterization of every minerals, included asbestos. On the other hand, it is not trivial nor straightforward obtaining quantitative data of asbestos content in a complex matrix, such as an ACM can be, just analyzing the XRD or FT-IR spectra or the SEM images. Detailed analytical procedures, such those currently used in other spectroscopic methods, should be adapted and correctly formulated for the specificity of asbestos. Moreover, while these procedures are carefully described (sample preparation, instrumentation set up and settings, and so on) in case of both XRD and SEM in the text of the Ministerial Decree issued on September 6, 1994, and also the detection limits (D.L.) are explicitly declared (1% w/w and 0.1% w/w for the two techniques respectively), in the case of FT-IR instead, there is not any indication regarding the D.L. nor the measurement protocol [4].
It is well known that qualitative and quantitative determination of different types of asbestos, by means of FTIR spectroscopy (transmittance or absorbance), is based on the use of some characteristic, strong and sufficiently sharp peaks. Several studies have demonstrated that FTIR is suitable for quantification of micrograms of differrent kinds of asbestos in host matrices and, in general, the sensitivity of FT-IR could be even less then 1% w/w when applied to bulk samples [5-8]. For these reasons, although samples require careful treatment before analysis, FT-IR is a valid alternative to the other cited techniques; furthermore FT-IR instrumentation is light, compact, and can be portable.
In this work, we have applied and compared two analytical procedures in the quantitative determination of few micrograms of asbestos in bulk materials. The Italian laws 257/92 and D.M. 6/9/1994 classify as hazardous the materials with a content of asbestos greater than 1% (w/w). Therefore, the calibration curves have been built in the range 0.1% - 6 % (w/w) of asbestos, in order to be able to collect useful data for bulk materials classification.
2. Theory
The Linear Calibration Curve Method (LCM) is commonly used in quantitative chemistry and it has been adopted successfully for the determination of asbestos in bulk materials by means of XRD [4,9]. This analytical procedure can be also used in FT-IR quantitative spectrometry: in this case, the calibration curves are obtained by plotting the intensity of the absorption peak, IM, as a function of the concentration Cx (w/w) of the analyte for standard mixtures containing known quantities of a given species of asbestos. Through this paper, the intensity IM is defined as the net area of the peak integrated from the baseline to its minimum of absorption.
The calibration curve can be always approximated to a straight line, at least for very small ranges of concentration where its equation is: IM = A + B Cx. It is therefore possible to find the best line that interpolates the experimental points and determine the line parameters A and B, and also the relative error δA and δB. The unknown concentration of asbestos in the analyzed sample, denoted as, is, thus, determined by using the following formula:
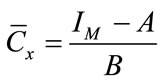 (1)
(1)
Relative and absolute error on this quantity, εr and εa respectively, are calculated by usual formulas of errors propagation:
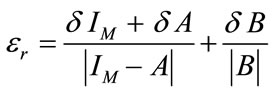 (2)
(2)
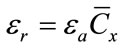 (3)
(3)
where the error on IM, δIM, is the statistical indetermination of several independent measurements on the same sample. Even if LCM is largely adopted in spectroscopy, quantitative results from LCM procedure can be strongly affected by the interference of the matrix in which the asbestos are embedded. As it happens with most spectrometric techniques, some peaks of the analyte can be partially or fully masked by other substances peaks, preventing correct quantitative measurements [10].
The Method of Additions (MOA) has been developed for the quantitative determination of an analyte in a complex matrix and therefore is less dependent on its composition and complexity [10]. The MOA calibration curve evaluates IM for a series of mixtures obtained by multiple additions of known quantities of standard asbestos to the original matrix. The unknown weight concentration of asbestos in the sample is given by the intersection between the calibration line and the X-axis i.e.:
 (4)
(4)
The relative error is in this case:
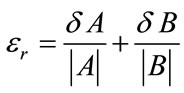 (5)
(5)
First, confirm that you have the correct template for your paper size. This template has been tailored for output on the custom paper size (21 cm × 28.5 cm).
3. Experimentals
In the experimental measurements, we have used samples of pure asbestos certified by the USA National Institute of Standard and Technology. These materials have been mixed with calcium carbonate, used as matrix and also as an interfering substance. While calcium carbonate can be found as a dry and fine powder, asbestos materials are sold as fiber bundles with very different lengths, ranging from about 100 mm up to centimeters. Since infrared spectra are strongly affected by preferred orientation and, in general, by particles size, it is of great importance to careful reducing their linear dimensions down to approximately few microns. The following procedure has been used in preparing the FT-IR samples, both for pure and mixed materials.
We have used a micro-mortar Retzsch (mod. RM-100), and a surfactant solution for reducing mechanical stresses, to grind every sample to particles having maximum length of about 5 µm. Under this value, the scattering losses can be ignored [11]. SEM observations have shown that about 30 minutes milling are necessary for Chrysotile and 10 minutes for Amosite and Crocidolite.
For each ground sample, about 1 g of powder was mixed with pure KBr, then homogenised in Agata mortar by hand and dried at 105˚C for 1 hour. Three or more transparent pellets of about 300 mg each and diameter of 13 mm were obtained by applying a force-weight of 10 tons for 5 minutes. The 400 - 4000 cm–1 interval was scanned24 times for each pellet, with a resolution of 4 cm–1, using a Perkin-Elmer FT-IR spectrometer, mod. 2000. After a careful analysis of the infrared spectrum of the pure minerals, the analytical peaks for each asbestos species were identified. The Chrysotile characteristic peak is at 3691 cm–1, the Crocidolite one at 451 cm–1 and the Amosite peak at 998 cm–1.
The LCM curves, reported in Figure 1 for Chrysotile, Amosite and Crocidolite, have obtained by plotting the IM as function of the weight concentration. Curve parameters are summarized in Table 1.
The MOA linear curves, for Amosite and Chrysotile, are shown in Figure 2 and the relevant parameters are reported in Table 2.
In order to check accuracy and precision of the LCM and MOA, some test mixtures of asbestos in CaCO3 were prepared and measured following the procedure above described. Tests results are reported in Tables 3 and 4, where the relative errors respect to the known weight percentage of asbestos can also be found.
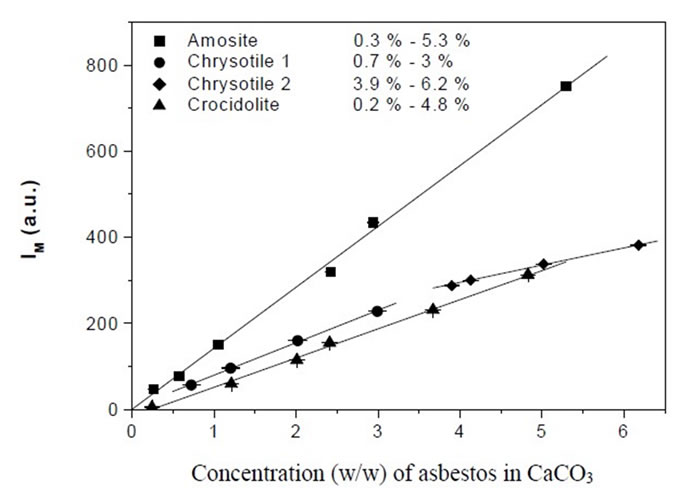
Figure 1. Linear calibration curves for Amosite, Crocidolite and Chrysotile.
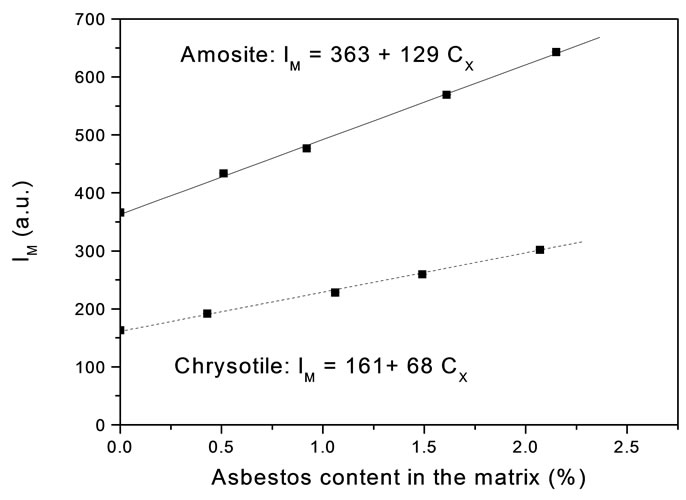
Figure 2. Method of additions curve for Amosite and Chrysotile.
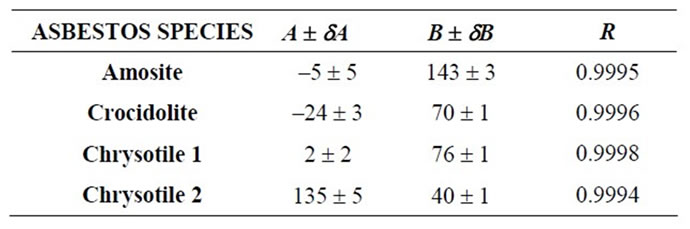
Table 1. LCM curve parameters.
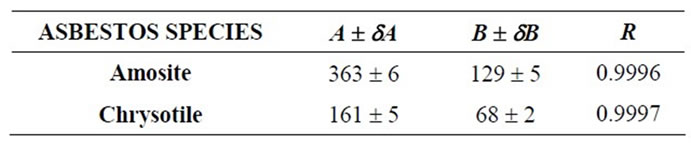
Table 2. MOA curve parameters.
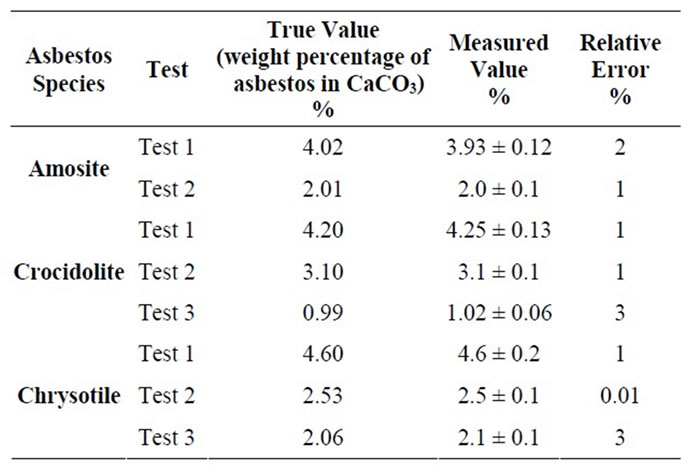
Table 3. Results obtained from the test mixtures by LCM.
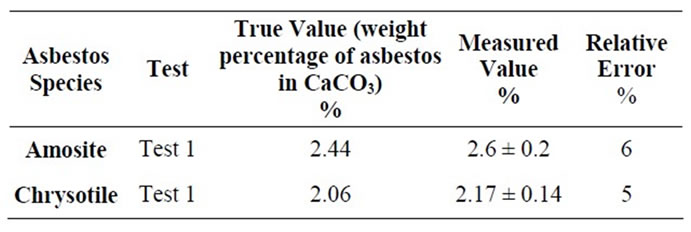
Table 4. Results obtained from the test mixtures by MOA.
4. Results and Discussion
One basic assumption of both the analytical methods proposed is the existence of a linear relationship between IM and Cx. We have experimentally verified that in any concentration range we have considered the dependence of IM on Cx is strictly linear: the linear regression coefficient of all the curves reported in Figures 1 and 2 is always grater than 0.99.
The linearity assumption is not true in general, and the relationship should be verified case by case. For example, in an extended concentration range, we have experimentally found that the peak intensity is a quadratic-like function of the concentration as it is shown in Figure 3 in the case of Chrysotile. Of course, the quadratic dependence does not prevent a quantitative determination of unknown mixtures, but it becomes quite cumbersome.
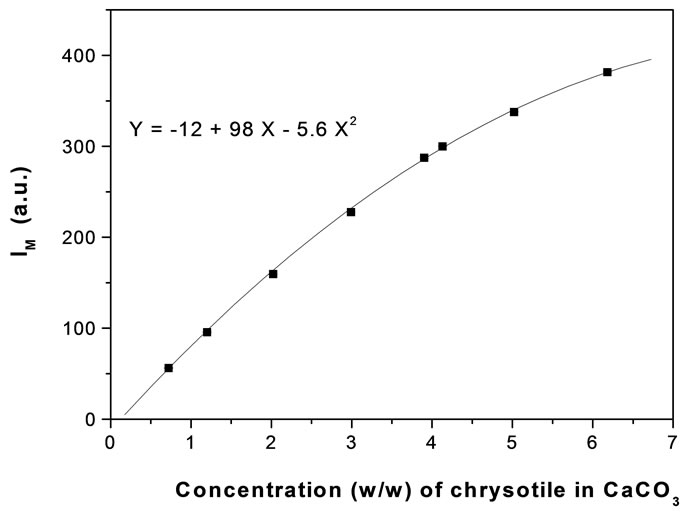
Figure 3. IM as function of Chrysotile weight concentration.
It is better to prepare the calibration curves in those intervals of concentration where the linearity is experimentally measured.
We have specified samples preparation and data acquisition procedure, which are very important in order to maximize the accuracy and the precision of the method for quantify the concentration of asbestos. The homogeneity of the sample was checked by making several measurements on different pellets prepared from the same powder. Pellets giving odd results, probably due to mechanical damages or humidity affected, were rejected because they were not representative of the mixture. Three pellets were analyzed for each sample and, the FT-IR spectrum was registered three times for each pellet. Therefore, nine independent values of the analytical peak intensity were used for each sample: the final estimate of IM was just the weighted average of nine values. In this way, each measurement is supported by a significant statistic.
Data reported in Tables 3 and 4 show that FT-IR is a reliable technique for the quantitative determination of asbestos in bulk materials. As a matter of fact, in all the test measurements the revealed concentration is very close to the true value, within the error interval of 3%, if the Linear Calibration Curve Method is used, and 6% with the Method of Addition.
As expected, the relative errors increase as the weight concentration decreases: at very low concentrations of asbestos, the IM determination can became difficult. In fact, the area of the analytical peak becomes smaller and smaller as the concentration of asbestos tends to the theoretical limit of 0.1% (w/w) [10], and the peak broadening also increases, so that the uncertainty about the starting and ending points of integration also increases, as it can be seen in Figure 4, where the analytical peak of Amosite, at different concentrations, is shown.
But even at very low concentration (see Crocidolite test 3 in Table 3, 0.99 % w/w) experimental data show
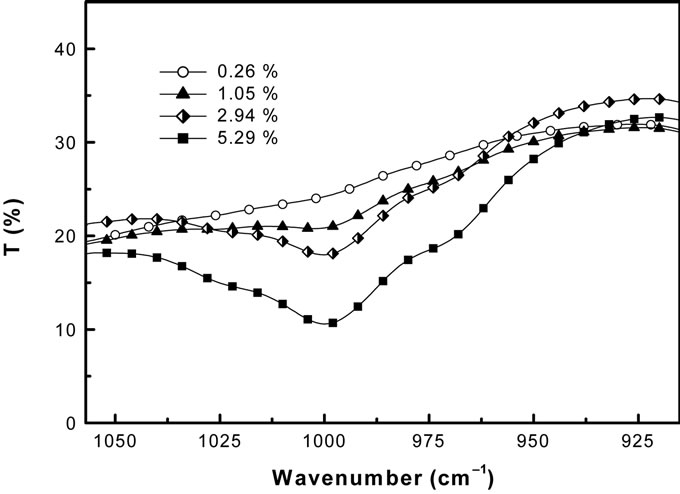
Figure 4. FT-IR Amosite analytical peak at different concentration (w/w).
not so high dispersion around the true value which proofs a good overall accuracy of both methods.
5. Conclusions
In conclusion, the two analytical procedures for quantitative determination of asbestos in bulk materials appears to be quite reliable, supposed that particular care is devoted to sample preparation, in particular about its comminution. The data acquisition methodology and data analysis also require attention for guaranteeing the quality of outputs. Relative errors between 0.01% and 6% have been found in quantify asbestos concentration of about 2% (w/w) in tests measurements. FT-IR spectroscopy can be thus considered very appealing as an analytical technique for bulk determination.
REFERENCES
- F. Colangelo, R. Cioffi, M. Lavorgna, L. Verdolotti and L. De Stefano, “Treatment and Recycling of Asbestos-Cement Containing Waste,” Journal of Hazardous Materials, Vol. 195, 2011, pp. 391-397. doi:10.1016/j.jhazmat.2011.08.057
- C. Giacobbe, A. F. Gualtieri, S. Quartieri, C. Rinaudo, M. Allegrina and G. B. Andreozzi, “Spectroscopic Study of the Product of Thermal Transformation of ChrysotileAsbestos Containing Materials (ACM),” European Journal of Mineralogy, Vol. 22, No. 4, 2010, pp. 535-546. doi:10.1127/0935-1221/2010/0022-2038
- S. Pereira da Silva, A. P. Wander, R. Bisatto and G. B. Galland, “Preparation and Characterization of Chrysotile for Use as Nanofiller in Polyolefins,” Nanotechnology, Vol. 22, No, 10, 2011, pp. 105701-105707.
- L. De Stefano, G. Buccolieri and F. De Luca, “Analytical Methods for Quantitative Asbestos Determination by XRay Diffraction,” Annali di Chimica, Vol. 88, 1998, pp. 839-847.
- G. A. Luoma, L. K. Yee and R. Rowland, “Determination of Microgram Amounts of Asbestos in Mixtures by Infrared Spectrometry,” Analytical Chemistry, Vol. 54, No. 12, 1982, pp. 2140-2142. doi:10.1021/ac00249a064
- A. Marconi, “Application of Infrared Spectroscopy in Asbestos Mineral Analysis,” Annali Istituto Superiore Sanità, Vol. 19, No. 4, 1983, pp. 629-638.
- I. R. Lewis, N. C. Chaffin, M. E. Gunter and P. R. Griffiths, “Vibrational Spectroscopic Studies of Asbestos and Comparison of Suitability for Remote Analysis,” Spectrochimica Acta A, Vol. 52, No. 3, 1996, pp. 315-328. doi:10.1016/0584-8539(95)01560-4
- M. Ristić, I. Czakó-Nagy, S. Musić and A. Vértes, “Spectroscopic Characterization of Chrysotile Asbestos from Different Regions,” Journal of Molecular Structure, Vol. 993, No. 1-3, 2011, pp. 120-126. doi:10.1016/j.molstruc.2010.10.005
- L. De Stefano, G. Buccolieri, F. De Luca and P. Plescia, “Milling Effects upon Quantitative Determination of Chrysotile Asbestos by the RIR Method,” Powder Diffraction, Vol. 15, No. 1, 2000, pp. 26-29.
- D. C. Harris, “Quantitative Chemical Analysis,” W. H. Freeman & Co., San Francisco, 2002.
- J. Salisbury, “Infrared Spectra of Minerals,” Johns Hopkins University Press, Baltimore, 1992.
NOTES
*Corresponding author.