Journal of Geoscience and Environment Protection
Vol.06 No.02(2018), Article ID:82266,19 pages
10.4236/gep.2018.62001
Spatial Analysis Applied for Gas Theft Modelling in Tabriz City, Iran
Seyed Reza Rahnamay Touhidi1, Ismael Davoudi2*
1East Azerbaijan Provincial Gas Company, National Iranian Gas Company, Tabriz, Iran
2Department of Remote Sensing and GIS, University of Tabriz, Tabriz, Iran

Copyright © 2018 by authors and Scientific Research Publishing Inc.
This work is licensed under the Creative Commons Attribution International License (CC BY 4.0).
http://creativecommons.org/licenses/by/4.0/


Received: December 28, 2017; Accepted: January 30, 2018; Published: February 2, 2018
ABSTRACT
Unauthorized use of energy is the major source of the non-technical losses of the energy in developing countries. Gas theft as a kind of energy theft is an increasing issue in a number of countries particularly in developing countries. This study is an attempt to address the issue of gas theft through the deployment of Geographic Information System (GIS) capabilities (Spatial Analysis) to import external factors into the current gas theft detection methods, improve data mining processes, and offer some management solutions. To achieve the intended goals in the study, two types of data sources were collected and analyzed: internal data such as reported instances of gas theft, and some customer properties, and external data such as some demographic data. In order to analyze and modeling the gas theft and the relationships between variables we used Hotspot analysis, Ordinary Least Squares regression (OLS) and Geographically Weighted Regression (GWR) analysis with ArcGIS tools. The results from clustering test indicated that the gas theft is not a random phenomenon in all areas of Tabriz and there are underlying factors. Mapping clusters by the hotspot techniques suggested the locations of clusters and areas at risk. The results of the regression analysis illustrated the importance of external factors clearly. According to the results, we recommend a conceptual GIS framework to select high risk areas as a subset data for a meter data analysis. Results of this research are of great importance for GIS based spatial analysis and can be used as base of future researches.
Keywords:
GIS, Gas Theft, Spatial Statistics, Proactive Analytics, Tabriz City

1. Introduction
Unauthorized use of energy is the major source of the non-technical losses of the energy in developing countries. Due to the poor underlying infrastructure, detection and control of potential causes of non-technical losses tend to be too difficult in developing countries [1] [2] . Gas theft as a kind of energy theft is an increasing issue in a number of countries particularly in developing countries [3] . According to many sources, gas theft is considered as a number of offences when a customer alters a meter from correctly registering the amount of gas supplied, damages equipment, or reconnects the supply without permission [4] [5] . Theft of gas increases the costs paid by consumers and can trigger serious safety consequences. It also leads to a misallocation of costs among suppliers which can distort competition and block the efficient activity of the market [5] [6] . Where such issues exist, the gas utility companies must provide a holistic and proactive approach to the problem with employment of new technologies to detect and prevent the gas theft [7] [8] [9] [10] . Technically speaking, there are two kinds of methods and efforts in detecting and tackling energy theft [11] . The first types use management functions and regulatory compliances [3] [12] - [17] and the second types employ technical approaches [8] [9] [18] - [25] . Current theft detection solutions use a combination of methods and several data sources called proactive analytics approach [8] .
Natural gas utility companies in Iran detect gas theft cases based on meter readers, service personnel and in some cases based on Meter Data Analytics (MDA) on monthly records in Customer Information System (CIS). Lack of adequate company control procedures for meter tampering and theft, ease of theft and low level of detection and high level of poverty are some important factors that can result in the gas theft [26] . Using information from a wide variety of sources, advanced analytics and proven processes, utility resources can focus on cases that have the highest likelihood of uncovering theft and the maximum potential for revenue recovery. Traditionally, utilities detected gas theft cases based on meter readers and service personnel. Today, some of the utilities throughout the globe are using Smart Grid (Automatic Meter Reading and Advanced Metering Infrastructure) capabilities along with proactive analytical software solutions to monitor and identify instances of gas theft. Although the smart meters help to detect gas thefts, it does not seem to be a perfect system for detecting gas theft. This is because many smart utilities have discovered many false alarms as well as many customers have discovered clever tricky ways to bypass or tamper with the meter [8] [19] [20] [27] [28] . Due to poor infrastructure in developing countries, the technical feasibility of using AMR and AMI systems has not been provided. Large changes in the economy and the government’s decision to raise gas prices resulted in increasing gas theft in Iran. According to the Iranian law, gas theft is considered a crime. In light of analyzing the reasons for gas theft, socioeconomic problems could be considered as one of the serious motivations for gas theft [18] [21] [22] [24] [29] [30] . Thieves hire more sophisticated and creative ways to steal gas. Energy theft, especially gas theft, typically occurs in two ways: tampering and diversion. The most common methods to tamper with the meter are: Altered disc rotation, “tilt” or inverted meter, meter swapping, tapping and jumping around meter.
Today, GIS plays a significant role in analyzing and modeling to examine data and reveal its relationships, patterns, trends and anomalies that we are unable to detect directly at maps [31] . Improving the data mining techniques [19] [27] , extending the role of external and third-party data [8] [9] [32] [33] , and integrating with GIS [33] [34] are the essential areas in the development of proactive approaches. So it seems that the foregoing areas are the best topics for further investigations and our study stands here to improve current efforts in energy theft detection even in traditional utilities. Spatial Analysis as the core of GIS is defined as the analysis of phenomena distributed in geographical space with physical dimensions [35] . Spatial Analysis, moreover, is the process of examining the locations, attributes, and relationships of features in spatial data through overlay and other analytical techniques in order to address a question or gain useful knowledge. Spatial analysis extracts or creates new information from spatial data [36] . Based on the argument, this study is an attempt to address the issue of gas theft through the deployment of GIS capabilities (Spatial Analysis) to import external factors into the current gas theft detection methods, improve data mining processes, and offer some management solutions.
2. Materials and Methods
2.1. Study Area
The study area was Tabriz city which is located in northern west part of Iran as center of East Azerbaijan province (Figure 1). Tabriz with a population of about 1.5 million is known as the largest and most important city in northwest of Iran. Tabriz city covers a total area of 245 square kilometers and is one of the most densely populated urban centers in Iran. The number of natural gas consumers is 700,000 units and gas supply is available for 100% of city households. The missing gas volume in large cities and northwest provinces of Iran is significant [37] [38] and the gas theft from distribution network turned on as a serious challenge for East Azerbaijan Gas Company (Tabriz Region). Tabriz gas distribution system is traditional and there are no AMR/AMI systems to help gas theft detection process, thus it is very important to apply GIS based methods for assisting gas theft detection in Tabriz city.
2.2. Dataset
In this research the census blocks were used as the spatial mapping unit. There were a total of 7260 blocks and each block had its population and other joined attributes in a related table.
To achieve the intended goals in the study, two types of data sources were collected and analyzed: internal data such as reported instances of gas theft, and some customer properties, and external data such as some demographic data. In

Figure 1. Location of the study area in East Azerbaijan Province and Iran.
order to model the gas theft we employed the following dataset based on GIS statistical analysis.
・ Reported gas theft cases (2012-2013, EAGC): point locations.
・ G-rates (meter capacity) and unit counts for costumers.
・ Census blocks data (2012, Statistical Centre of Iran): population, high education rate, unemployment rate, immigrant rate, income level and type of buildings (non-apartment ratio).
・ Administrative borders (2014, Tabriz Municipality).
Detected gas theft cases were collected for a two-year period based on EAGAS utility agent reports and then they were geocoded by x and y coordinates in study area as a layer map. The capacity of meters (G-Rate) and number of units for each costumer was extracted from EAGAS CIS (Costumer Information system). G-Rate and Units are two important technical indicators that we used in spatial analysis of gas theft. Census blocks data were collected from Statistical Centre of Iran. Census block level data have a comprehensive demographic data but for the purpose of this study we selected population, education, immigration, unemployment, income and type of buildings as main socio-economic factors for spatial analysis of gas theft.
2.3. Data Processing
Within this research we developed a GIS based dataset as base of GIS spatial analysis. The reason behind using census block level data is important that this data leads to a rich set of variables that might help explain gas theft volumes. Gas theft data was in the form of excel tables, therefore we converted it to location points GIS based shape format with attributes in the ArcGIS software. Incident gas theft data are points of those events with required costumer attributes, and for the purpose of analysis we needed to join them to adjacent census blocks for representing the number of gas thefts and mean attributes (mean of G-Rates and mean of Unit counts) in each census block. To better analyze the points, we aggregated near points (30 meter) with each other too (Figure 2). Candidate variables for regression models are also listed in Table 1.
2.4. Methods
Our research makes use of GIS spatial statistics capabilities for exploring and mapping spatial relationships in gas theft. The spatial statistics comprises a set of techniques for describing and modeling spatial data [39] . Based on this potentiality, for a better deployment of spatial aspects of internal and external data in gas theft detection approaches we employed spatial statistical techniques as effective method in this study. We employed spatial statistics to identify statistically significant clusters and assess spatial patterns of gas theft. We also aimed to
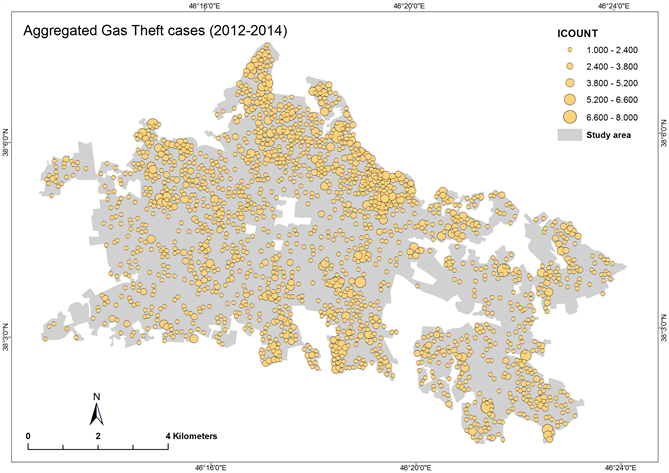
Figure 2. Aggregated gas theft points.

Table 1. Candidate variables for regression analysis.

Figure 3. The proposed conceptual GIS framework.
model spatial correlation of some factors for gas theft. Figure 3 shows the proposed conceptual GIS framework and implemented steps within this research.
2.5. Analyzing the Spatial Patterns of Gas Theft
Within this research in order to examine clustering and provide better understanding of the Gas theft patterns, we employed Average Nearest Neighbor tool in ArcGIS software for incident points of gas theft. The average nearest neighbor tool calculates the distance between each feature and its nearest neighbor, then computes the average for all nearest neighbor distances [40] . It then compares the computed average distance to a theoretical one that would be obtained if the points were randomly distributed inside a circle with the same area.
(1)
where is the observed mean distance between each feature and its nearest neighbor;
(2)
And is the expected mean distance for the features given in a random pattern;
(3)
In the above equation, equals the distance between feature i and its nearest neighboring feature (census block), n corresponds to the total number of features, and A is the area of a minimum enclosing recangle around all blocks, or it’s a user-defined area value.
The average nearest neighbor z-score for the feature is calculated as;
(4)
where;
(5)
After test of clustering, we used hotspot analysis for identify the locations of statistically significant hotspots and cold spots in data. The Hot Spot Analysis tool calculates the Getis-Ord Gi* statistic for each feature in a dataset. This tool looks at each feature within the context of neighboring features. For being statistically significant hotspot, a feature must have a high value and be surrounded by other features with high values as well [40] . In this regard, Getis and Ord present a local clustering test based on the concentration of values in the neighborhood of a unit [39] . This technique makes use of the following statistics;
(6)
The other form of local Getis-Ord is Getis-Ord G* [36] . The Gi* statistic includes the contribution of the ith unit in the calculation of local concentration. The Getis-Ord G* is given as;
(7)
where is the variable for location j, is the spatial weight between locations i and j, n is equal to the total number of locations and;
(8)
(9)
The Gi* statistic returned for each location is a z-score. A positive value indicates clustering of high values and a negative value indicates a cluster of low values.
2.6. Modeling the Spatial Relationships of Gas Theft
In order to analyze the relationships between variables we used Ordinary Least Squares regression (OLS) and Geographically Weighted Regression (GWR) analysis with ArcGIS tools. OLS is a global model [39] and is a proper starting point for all spatial regression analyses [40] . It provides a global model of the variable or process we are trying to understand or predict. In this research we use OLS tool as a start point for main analysis. In the case of a model with p explanatory variables, the OLS regression model writes;
(10)
In the Equation (10), y is the dependent variable, the xs are the explanatory variables, the βs are regression coefficients, and the is random error or residuals. Over the study area some variables might be strong in predicting the gas theft in some locations of our study area, but perhaps a weak predictor in other locations. For this reason we used GWR. For each location, , the GWR model is as below [36] ;
(11)
In the Equation (11), is the dependent variable at location i, is the value of the kth covariate at location i, is the intercept, is the regression coefficient for the kth covariate, p is the number of regressions, and is the random error at location. There is a distinction between regression terms and regression coefficients, and the number of regression coefficients is np.
The implemented GWR Analysis consists of four steps:
1) Exploring the Data and OLS Regression: We used scatter plot matrix and histograms to elucidate the relationships among all variables and examine extreme data values. The first step in identifying relationships between variables is performing Ordinary Least Squares (OLS) linear regression to model a dependent variable in terms of its relationships to a set of explanatory variables. In this research, after removing outliers based on the scatter plot matrix we ran an OLS regression on 8 variables: G-Rate Mean, Units Mean, Population, Low Income Level Ratio, Education Rate, Immigrant Rate, Unemployment Rate and Non- apartment Ratio. The obtained report from the OLS suggested that a test should be conducted to determine the existence of spatial autocorrelation in the residuals. The results provided by the OLS regression analysis tend to be invalid if the residuals are poorly autocorrelated. For this purpose, Moran’s I appears to be a proper test. That is to say, the test being available under Spatial Statistics Tools /Analyzing Patterns/Spatial Autocorrelation attempts to measure the level of spatial autocorrelation in the residuals.
2) Model Development: The OLS regression is the starting point for model development and performing a proper GWR analysis. To evaluate combination of variables to make a properly specified OLS model, we used exploratory regression tool. Exploratory regression method evaluates all possible combinations of the variables and determines predictor importance. Exploratory regression tests all variable combinations for redundancy, completeness, significance, bias and performance.
3) Performing the GWR: After finding the best combination of variables, we performed the GWR with that combination to create a local model for understand or predict the gas theft by fitting a regression equation to every block in the dataset.
4) Prediction of Gas Theft: Eventually, after verification of the model we predicted future behavior of gas theft in the study area by GWR tool.
3. Results
The Average Nearest Neighbor on gas theft cases indicates statistically significant clustering. In order to validate results, we apply the average nearest neighbor tool on the parcel layer for comparing the result against to the clustering for individual cases. The z-score for both parcels and individual cases are quite different. For gas theft cases, the z-score is −15.5 and there is less than 1% likelihood that this clustered pattern could be the result of random chance (Figure 4). But for parcel points the z-score is 21.6 (Figure 5). It means that, results indicate that the gas theft pattern is completely clustered. In conclusion, according to the results of the ANN, it is safe to argue that the gas theft is not a random phenomenon in Tabriz and is related to the underlying factors.
After aggregating data and selecting appropriate distance band for polygon data, we used Hot Spot Analysis (Getis-Ord Gi*) tool for mapping patterns of gas theft. The result of the Hot Spot Analysis tool is a new map that is symbolized based on whether it is part of a statistically significant hotspot, a statistically significant cold spot, or is not part of any statistically significant cluster. The red color areas are identified as hotspots or areas where high numbers of Gas Thefts are surrounded by other areas with high numbers of Gas Thefts. The blue
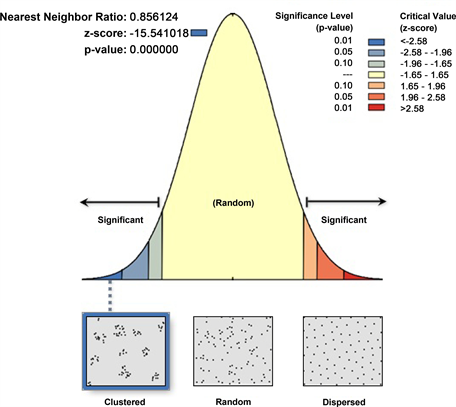
Figure 4. Average nearest neighbor results for gas theft cases.

Figure 5. Average nearest neighbor results for parcel points.
areas are cold spots or areas where low numbers of Gas Thefts are surrounded by other areas with low numbers of Gas Thefts. Statistical significance is based on p-values and z-scores that are calculated when we apply the Hot Spot Analysis. Figure 6 shows results of Hot Spot Analysis.
The results of regression analysis showed a global relationship between some variables (Figure 7).
Model performance according to adjusted R-squared is 0.48. This indicates that the implemented model (the explanatory variables modeled using linear regression) explains approximately 48 percent of the variation in the dependent variable. To put it differently, our model explains approximately 48 percent of the gas theft story.
Regression models with statistically significant non-stationary are often proper candidates for Geographically Weighted Regression (GWR) analysis. In the OLS map (Figure 8) the red areas are under predictions (where the actual numbers of GT is higher than the model predicted) and the blue areas are over predictions (actual call volumes are lower than predicted). When a model is performing well, the over/under predictions reflect a random noise. The Jarque- Bera statistic indicated that the residuals are not normally distributed and we
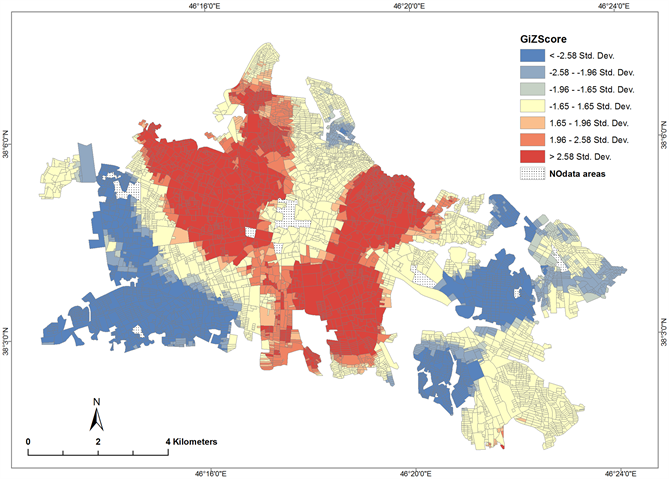
Figure 6. Hot spot analysis of aggregated point data to census tracts (polygon data).
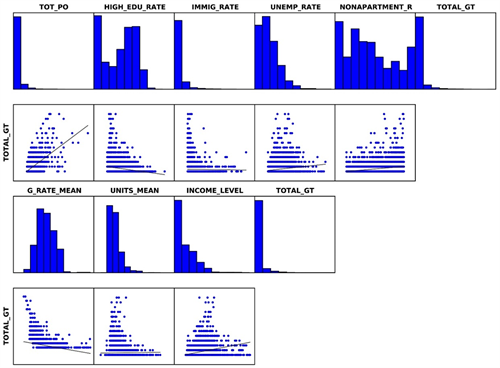
Figure 7. Variable distributions and relationships.

Figure 8. Map of standardized residuals.
have statistically significant spatial autocorrelation for residuals (Figure 9).This proves that there is a strong heteroscedasticity or a key variable is missing from the model and so we need a non-stationary model. The histogram of standardized residuals (Figure 10) matches the normal curve and this shows that there is no biased model in the implemented approach.

Figure 9. Spatial autocorrelation report for residuals.
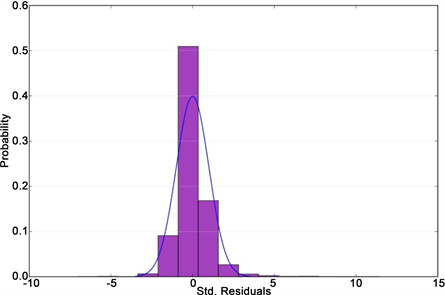
Figure 10. Histogram for standardized residuals.
The OLS regression, however, fits a global regression for all dataset. With regard to the spatial differences of variables (non-stationary) and complexity of the study area, we cannot use the OLS for modeling or predicting gas theft. Rather, we need a model that has the required potential to explain the differences locally. But the OLS can tell us global statistics for selecting the best combination of explanatory variables as a starting point for running a local regression model. The outputs generated from the GWR tool include a feature class (map) and a report of overall model results. The results of GWR analysis revealed a better relationship between variables and gas theft. Model performance according to Adjusted R-Squared is 0.6 (Table 2). This indicates that our model explains approximately 60 percent of the variation in the dependent variable (Gas Theft). In addition to total model performance (R2 Adjusted), the GWR calculates the locally weighed R2 between the observed and fitted values for each feature (Figure 11) which indicated how well the GWR model replicated the local GT around variables.
As mentioned previously, over and under-predictions for a well-specified regression model will be randomly distributed. Examine the patterns (Spatial Autocorrelation Moran’s I) of the output in our GWR model residuals indicates that the GWR model is a well-specified model (Figure 12).
As with any regression, GWR can be used to predict. The obtained from GWR for the prediction of gas theft include two maps, predicted gas theft values per blocks and predicted gas theft hotspots (Figure 13 and Figure 14).
The results from clustering test indicated that the gas theft is not a random phenomenon in all areas of Tabriz and there are underlying factors. Mapping clusters by the hotspot techniques suggested the locations of clusters and areas at risk. The results of the regression analysis illustrated the importance of external factors clearly. The comparison of OLS regression results and GWR results revealed that the impact of factors differ from a location to another location. For example, the impact of educations is more distinct in the northern and southern parts of the city, but the impact of population density is almost the same and close in many neighborhoods. The accuracy of the model strongly depends on the number and combination of factors (data sources); so we can improve the
Table 2. GWR results.

Figure 11. Spatial mapping of the locally weighed coefficient of determination (R2) between the observed and fitted values by GWR.

Figure 12. Spatial autocorrelation results for GWR residuals.
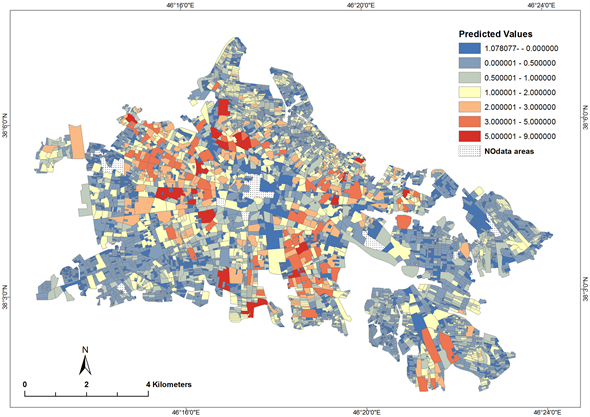
Figure 13. Predicted gas theft values per census tracts.

Figure 14. Predicted gas theft hot spots.
model by more data sources. According to the results obtained, there is overwhelming evidence corroborating the presence of spatial relationships that can help to better understanding about gas theft.
4. Conclusion
Today there is no need for data mining approaches offered by many vendors to process all data, they prioritize data for analysis based on a number of data sources and then execute data mining. In the current research, we employed gas theft instances, third-party and internal data to check spatial aspects of gas theft and finally indicated some areas as priority areas for further analysis and investigations. Data integration and using plenty of data sources are considered as the fundamental tasks in today’s analytic energy theft detection methods. In our investigation, every attempt was made to use some different data sources to reveal some spatial aspects of gas theft. We believe that GIS is a complete repository for utilities to cover all spatial and non-spatial data from external and internal sources in an integrated space. Interoperability of GIS technology with other technologies and systems is opportunity that leading utilities are using it perfectly. In this research, we tried to show some capabilities of GIS for integration with utilities specifically for revenue protection programs. It is obvious that when a utility company wishes to properly take advantage of the capabilities of a GIS in revenue protection, they must develop an enterprise GIS. Planning for the deployment of an enterprise GIS is a critical managerial activity for utilities to move from traditional to smart utility. To sum up, the obtained research findings show a meaningful spatial correlation that we can use this potential and GIS capabilities to use external and internal data sources for proactive analytics more effectively. Therefore, according to the results and the literature review, we recommend a conceptual GIS framework to select high risk areas as a subset data for a meter data analysis. Results of this research are of great importance for GIS based spatial analysis and can be used as base of future researches.
Acknowledgements
Authors would like to thank you for EA Gas Company for providing dataset and Professor Jean-Fabrice Lebraty from University of Lyon. IAE for his supports and remarkable comments on the early version of this paper.
Cite this paper
Touhidi, S.R.R. and Davoudi, I. (2018) Spatial Analysis Applied for Gas Theft Modelling in Tabriz City, Iran. Journal of Geoscience and Environment Protection, 6, 1-19. https://doi.org/10.4236/gep.2018.62001
References
- 1. Depuru, S.S.S.R., et al. (2010) Measures and Setbacks for Controlling Electricity Theft. Proceedings of North American Power Symposium (NAPS), Arlington, 26-28 September 2010, 1-8. https://doi.org/10.1109/NAPS.2010.5619966
- 2. Masoor, A. (2013) Pakistan’s Gas Crisis due to Gas Theft & Unaccounted for Gas (UFG). International Journal of Renewable Energy Technology Research, 2, 53-58.
- 3. Millard, R. and Emmerton, M. (2009) Non Technical Losses—How Do Other Countries Tackle the Problem? Proceedings of 22nd AMEU Technical Convention, Pretoria. http://www.eepublishers.co.za
- 4. BritishGasPlc. Gas Act (1986). http://www.legislation.gov.uk/ukpga/1986/44/contents.
- 5. Ofgem (2012) Tackling Gas Theft: New Requirements for Gas Suppliers. Ofgem, UK.
- 6. Targosz, R. (2009) Electricity Theft—A Complex Problem. Leonardo Energy. http://www.leonardo-energy.org/blog/electricity-theft-complex-problem
- 7. SE, E.G. (n.d.) (2017) Deterrent and Detection of Smart Grid Meter Tampering and Theft. http://www.elstersolutions.com/en/deterrent-and-deection-of-smart-grid-meter-tampering-and-theft
- 8. Madrazo, M. (2010) Today’s Energy Theft Detection Models Help Protect Revenues While Enhancing Neighborhood Safety. Pipeline & Gas Journal, 237, 16-18.
- 9. Madrazo, M. (2009) Bridging the Knowledge Gap to Identify Energy Theft. Electric Energy T&D Magazine, Canada, 57-61.
- 10. Madrazo, M. (2006) Integrating Data from Many Sources Provides New Opportunities in Energy Theft Detection. Electric Energy T&D Magazine, Canada.
- 11. CORDIS (2015) Socio-Economic Energy Research. http://cordis.europa.eu/home_en.html
- 12. Ofgem (2017) Market Review and Reform—Gas Theft. https://www.ofgem.gov.uk/gas/retail-market/market-review-and-reform/gas-theft
- 13. UKRPA (2017) Revenue Protection. http://www.ukrpa.co.uk/about-the-ukrpa-energy-theft/revenue-protection
- 14. UKRPA (2017) Report Fraud Online Form. http://www.ukrpa.co.uk/report-energy-fraud
- 15. Singhal, S. (1999) The Role of Metering in Revenue Protection. 9th International Conference on Metering and Tariffs for Energy Supply, Birmingham, 25-28 May 1999, 223-228. https://doi.org/10.1049/cp:19990141
- 16. EYPower&Utilities (2015) Power & Utilities. http://www.ey.com/GL/en/Industries/Power---Utilities
- 17. Suriyamongkol, D. (2002) Non-Technical Losses in Electrical Power Systems. MS Thesis, Ohio University, Athens.
- 18. Depuru, S.S. (2012) Modeling, Detection, and Prevention of Electricity Theft for Enhanced Performance and Security of Power Grid. PhD Thesis, University of Toledo, Toledo.
- 19. Carolsfeld, R. (2014) Security Sessions: In-Grid Data Analytics Helps Utilities Slash Grid Losses and Power Theft. Electric Energy T&D Magazine.
- 20. Chartwell (2006) Using AMR and Other Tools to Guard against Theft and Unintentional Losses, in Revenue Protection. Chartwell Inc., Atlanta.
- 21. Angelis, B. and Miller, E. (2011) Integrated Data Collection, Anomaly Detection and Investigation, Such as Integrated Mobile Utility Meter Reading, Theft Detection and Investigation System. US Patent No. 7986246 B2.
- 22. Stockton, G.R. and Lucas, R.G. (2012) Using Aerial Infrared Thermography to Detect Utility Theft of Service. Proceedings of the SPIE Defense, Security, and Sensing Conference of International Society for Optics and Photonics, Baltimore, 23-27 April 2012, 83540T. https://doi.org/10.1117/12.921993
- 23. IRINFO.ORG (2009) RecoverIRTM Announces Breakthrough Capabilities for Detecting Utility Energy Theft. http://www.irinfo.org/news-12-17-09/
- 24. Christopher, D. and Giles, M. (2014) A Case Study on the Revenue Protection Software: Sacramento Municipal Utility District Smart Grid Demonstration. Electric Power Research Institute (EPRI), Palo Alto.
- 25. SilverLink (2014) Unleash the Power of Smart Grid Big Data, S.S. Networks. Silver Spring Networks, Redwood City.
- 26. INOGATE (2012) SEMISE Project: Reduction of Non-Technical Natural Gas Losses in Transmission Gas Pipelines System and Gas Distribution Network. INOGATE Programme.
- 27. Jiang, R., et al. (2014) Energy-Theft Detection Issues for Advanced Metering Infrastructure in Smart Grid. Tsinghua Science and Technology, 19, 105-120. https://doi.org/10.1109/TST.2014.6787363
- 28. Leite, J.B. and Mantovani, J.R.S. (2016) Detecting and Locating Non-Technical Losses in Modern Distribution Networks. IEEE Transactions on Smart Grid, PP, 1. https://doi.org/10.1109/TSG.2016.2574714
- 29. Never, B. (2015) Social Norms, Trust and Control of Power Theft in Uganda: Does Bulk Metering Work for MSEs? Energy Policy, 82, 197-206. https://doi.org/10.1016/j.enpol.2015.03.020
- 30. Yurtseven, Ç. (2015) The Causes of Electricity Theft: An Econometric Analysis of the Case of Turkey. Utilities Policy, 37, 70-78. https://doi.org/10.1016/j.jup.2015.06.008
- 31. Longley, P.A., et al. (2011) Geographic Information Systems and Science. 3rd Edition, John Wiley & Sons, Hoboken.
- 32. Bradford, B. (2013) Guest Editorial 2: The Role of Big Data Visualization and Analytics in the Utility Industry. Electric Energy T&D Magazine.
- 33. Meehan, B. (2007) Empowering Electric and Gas Utilities with GIS. ESRI, Inc., Redlands.
- 34. ESRI (2017) ESRI Industries. http://www.esri.com/industries
- 35. De Smith, M.J., Goodchild, M.F. and Longley, P. (2007) Geospatial Analysis: A Comprehensive Guide to Principles, Techniques and Software Tools. Troubador Publishing Ltd., Leicester.
- 36. ESRI (2015) Online GIS Dictionary. http://support.esri.com/en/knowledgebase/Gisdictionary/browse
- 37. General Inspection Organization of Iran (GIO) (2015).
- 38. Iranian Fuel Conservation Company (IFCO) (2017). http://ifco.ir/index.php/en/
- 39. Fischer, M.M. and Getis, A. (2009) Handbook of Applied Spatial Analysis: Software Tools, Methods and Applications. Springer Science & Business Media, Berlin.
- 40. ESRI (2015) ArcGIS 10.3 Help. http://resources.arcgis.com/en/help/