Journal of Geoscience and Environment Protection
Vol.05 No.12(2017), Article ID:80816,27 pages
10.4236/gep.2017.512001
Anomalous Atmospheric Circulation Associated with Recent West African Monsoon Rainfall Variability
Ugochukwu K. Okoro1,2*, Wen Chen1, Chidiezie Chineke2, Okey Nwofor2
1Center for Monsoon System Research, Institute of Atmospheric Physics, Chinese Academy of Sciences, Beijing, China
2Department of Physics, Atmospheric Physics Group, Imo State University, Owerri, Nigeria

Copyright © 2017 by authors and Scientific Research Publishing Inc.
This work is licensed under the Creative Commons Attribution International License (CC BY 4.0).
http://creativecommons.org/licenses/by/4.0/


Received: September 21, 2017; Accepted: November 28, 2017; Published: December 1, 2017
ABSTRACT
The recent West African Monsoon (WAM) wet season (May to October) rainfall’s interannual variability has been examined with emphasis on the rainfall zones of Guinea Coast (GC), Western Sudano Sahel (WSS) and Eastern Sudano Sahel (ESS) in wet and dry years. Rainfall observations from Climate Research Unit (CRU) and Climate Prediction Center (CPC) Merged Analysis of Precipitation (CMAP), and atmospheric circulation fields from National Center for Environmental Prediction (NCEP) were evaluated from 1979 to 2014. The objectives are to evaluate the trends across the zones and their linear relationship with the identified oceanic pulsations, as well as examine the evolution of the anomalous atmospheric circulation associated with the wet and dry years during the wet season months. The results show remarkable variability across the rainfall zones. The areal averaged rainfall anomalies show significant correlation values of −0.2 with Ocean Nino Index (ONI) only on WSS and ESS respectively, whereas with South Atlantic Ocean Dipole Index (SAODI) it shows significant correlation value of 0.3 only on GC, at 95% Confidence Level from a t-test. The analysis of trends in spatial and temporal patterns of the atmospheric circulation fields has extensively presented attributes associated with the wet seasonal rainfall anomalies in the wet and dry years. FGOALS-s2 model showed an outstanding simulation of the spatial and temporal patterns of these attributes, with the discrepancies noted, hence presenting itself as a viable tool in the prediction of seasonal rainfall extremes over West Africa.
Keywords:
West African Monsoon, Wet Season, Rainfall Variability, Atmospheric Circulation

1. Introduction
The global climate is changing and the population of West Africa (WA), with about 65% of it dwelling in rural areas, mostly depends on rain-fed agriculture for their livelihood [1] [2] [3] . Rainfall producing systems over this region primarily occur during the West African Monsoon (WAM), which accounts for more than 75% of the region’s annual rainfall [4] [5] . The WAM is associated with tropical seasonal reversals in both atmospheric circulation and the associated rainfall. These circulations are typically characterized by the low-level southwesterly monsoon flow, the African Easterly Jet (AEJ) in the middle troposphere between 600 - 650 hPa that is closely linked with the African Easterly Waves (AEW) and the Mesoscale Convective Systems (MCS), and the Tropical Easterly Jet (TEJ) occurring at the upper levels around 150 hPa [6] - [14] . The Saharan Heat Low (SHL) is another important feature of the WAM, located by the relative maximum thickness between the geopotential heights at 700 hPa and 925 hPa [15] - [20] . Also, the roles of the African Westerly Jet (AWJ) over the continent and the West African Westerly Jet (WAWJ) over the Atlantic have been established recently [21] . These seasonal reversals are influenced by the Inter-Tropical Convergence Zone (ITCZ) or the Inter-Tropical Discontinuity (ITD), as it shifts northwards with the wet tropical maritime air mass (causing the rainy season) from a quasi-stationary location at 5˚N to another quasi-stationary location at 10˚N and then recedes southward with the dry tropical continental air mass (causing the dry seasons) [22] [23] . Nonetheless, interest of most scientists has been drawn to the variability of the associated WAM rainfall since the severe drought over the region between the 1970’s and 80’s [24] - [29] with emphasis being on its inhomogeneity, noting its high temporal and spatial variability [30] .
Some of the identified driving mechanisms of the interannual variability in the WAM rainfall such as the El Nino-Southern Oscillation (ENSO) have had varying opinions on its role. A number of studies suggest that its influence is minimal whereas some opine that its positive (El Nino) and negative (La Nina) phases have varying influence on rainfall over the region [29] [31] - [38] . Also, the role of the Atlantic Nino over the rainfall variability over the region has long been identified with the emphasis on its role in the Guinea Coast rainfall [39] [40] [41] [42] . But some other studies [43] [44] [45] suggest that the South Atlantic Ocean (SAO) dipole (SAOD), which has a life cycle of about eight months and is strongly correlated with that Atlantic Nino, is the dominant factor that controls the interannual variations of rainfall over the Guinea Coast. In furtherance to understanding the variability of the WAM rainfall, many studies have investigated precipitation departures on different temporal and spatial scales over the region using precipitation indexes [46] - [55] . Different studies have also investigated the relationship between the underlying atmospheric circulation as well as mechanisms associated with their identified wet and dry years [12] [13] [21] [56] - [61] . However, from recent studies on the interannual and interdecadal variability, there has been the question of “recovery” of the Sahel rainfall, which is greatly influenced by the data, duration, area studied and methodologies used [21] [62] [63] . Nevertheless, there are still posers in understanding the variability of the WAM rainfall and an investigation into the variability, therefore, is inexhaustible.
This work presents trends in recent (1979-2014) WAM wet season (May-October) rainfall variability and its linear relationship with oceanic pulsations, with emphasis on the three rainfall zones of Guinea Coast (GC), Western Sudano Sahel (WSS) and Eastern Sudano Sahel (ESS). Also examined, is the evolution of the anomalous atmospheric circulation associated with the simultaneous extreme wet and dry years in the wet season months. The ability of the second spectral version of the Flexible Global Ocean-Atmosphere-Land System (FGOALS-s2) GCM outputs, which is developed by the author's host institute, in representing the spatial and temporal features has been examined. The paper consolidates earlier works as well as proposes a frontier on divergence during the WAM. It puts FGOALS-s2 in view as a viable tool in supporting research in data sparse WA region on WAM research. It is noteworthy that the roles of the oceanic pulsation in the seasonal variability are not part of the study scope. This paper is sectioned as follows: Section 2 is the data; Section 3 is the methodology; Section 4 is the results and discussion and Section 5 is the conclusion.
2. Data
The observational monthly rainfall datasets used were from the Climatic Research Unit (CRU), University of East Anglia UK Time Series (TS) version 3.23 and the Climate Prediction Center (CPC) Merged Analysis of Precipitation (CMAP). CRU is constructed by interpolation of month-by-month variations in climate variables on a high-resolution of 0.5˚ by 0.5˚ global grids. [64] further show the procedures in the data preparation and their presentation. The data is provided by the National Centre for Atmospheric Science (NCAS) British Atmospheric Data Centre online at http://badc.nerc.ac.uk/view/badc.nerc.ac.uk__ATOM__dataent_1256223773328276. CMAP interpolation includes rain gauge and model data as well as values obtained from 5 kinds of satellite estimates (GPI, MSU, OPI, SSM/I emission and SSM/I scattering) prepared on a resolution of 2.5˚ by 2.5˚ global grid. The procedure is further discussed in [65] . The data is provided by National Oceanic and Atmospheric Administration (NOAA) online at http://www.esrl.noaa.gov/psd/data/gridded/data.cmap.html. Both datasets have shown a good measure of agreement over the region [66] .
The atmospheric circulation fields are from the National Center for Environmental Prediction (NCEP) reanalysis [67] [68] . The products are available at a resolution of 2.5˚ by 2.5˚ global grid and 28 vertical levels. The reanalysis system consists of background forecast model and data assimilation routine [69] . Its accuracy in describing both interannual and synoptic timescale variability over West Africa has been verified [70] [71] [72] [73] . The variables used in this study include the monthly specific humidity from the Reanalysis 1 whereas the monthly meridional and zonal wind components, surface pressure and mean sea level pressure (mslp) are from the Reanalysis 2. The justification for using both the Reanalysis 1 and 2 is that both datasets have the same data assimilation scheme as well as same spatial and temporal resolutions. The data is provided by National Oceanic and Atmospheric Administration (NOAA) and it is available online at http://www.esrl.noaa.gov/psd/data/gridded/.
The Flexible Global Ocean-Atmosphere-Land System model-second spectral version (FGOALS-s2) was developed at the State Key Laboratory of Numerical Modeling for Atmospheric Sciences and Geophysical Fluid Dynamics, Institute of Atmospheric Physics (LASG-IAP), Chinese Academy of Sciences, Beijing, China. The model includes four individual components: an atmosphere component, the Spectral Atmosphere Model of the LASG IAP version 2 (SAMIL2-ho- rizontal resolution of 2.81˚ longitude by 1.66˚ latitude and 26 hybrid vertical layers); an ocean component, the LASG IAP Climate Ocean Model version 2 (LICOM2-horizontal resolution of 1˚ by 1˚ with the increased resolution to 0.5˚ by 0.5˚ in tropical regions and vertical resolution adjusted to 10 m layer thickness in the upper 150 m); a land component, the Community Land Model version 3 (CLM3-horizontal resolution of 2.81˚ longitude by 1.66˚ latitude); and a sea ice component, the Community Sea Ice Model version 5 (CSIM5-horizontal resolution of 1˚ by 1˚). These four components are driven by a flux coupler module from National Center for Atmospheric Research (NCAR). The FGOALS-s2 is one of the outstanding five Chinese Climate/Earth System Models involved in the Coupled Model Intercomparison Project’s 5th phase (CMIP5), which conducts coordinated experiments that provide scientific information to climate research communities [74] . The FGOALS-s2 model has been further discussed in [75] and its results were submitted to CMIP5 through a network of servers called Earth System Grid Federation (ESGF) data nodes, available online at https://esgf-index1.ceda.ac.uk/projects/esgf-ceda/. The description of CMIP5 experiment designs are presented in [76] . The monthly output of the Atmosphere Model Intercomparison Project (AMIP) ensemble experiment, which runs from 1979 to 2008, was used in this study.
Ocean Nino Index (ONI), which measures the departure from normal sea surface temperature (SST) in the east-central Pacific Ocean, is a three month running mean of NOAA Extended Reconstructed Sea Surface Temperature (ERSST) version 4 SST anomalies in the Nino 3.4 region (5˚N - 5˚S, 120˚W - 170˚W). The departure is computed when the base threshold of +/−0.5˚C is met for a minimum of 5 consecutive over-lapping seasons, based on a centered 30-year base periods and updated every 5 years. The index is further discussed in [77] and is available online at http://www.cpc.ncep.noaa.gov/products/analysis_monitoring/ensostuff/ONI_change.shtml.
SAOD is characterized by SST variability of opposing polarity off the coasts of West/Central Equatorial Africa (Gulf of Guinea) called the northeast pole (NEP) in the Atlantic Nino region (10˚E - 20˚W, 0˚ - 15˚S) coupled with concurrent cooling of similar magnitude off the Argentina-Uruguay-Brazil coasts called the southwest pole (SWP; 10˚W - 40˚W, 25˚S - 40˚S) parts of the south Atlantic ocean. These SST patterns are coupled to the atmospheric circulation field and regional climates. SAOD Index (SAODI) is computed by differencing the domain-averaged normalized sea surface temperature anomaly (SSTA) of the two centers of intense warming and cooling associated with the SAOD and is represented by the equation;
(1)
where the square brackets indicate domain averages. A positive phase signifies warm SST in the coast of West/Central Equatorial Africa and cool SST in the Argentina-Uruguay-Brazil coast whereas the opposite SSTA pattern describes a negative phase. The SAOD is strongly correlated but different from the equatorial zonal mode called the Atlantic Nino. It is independent of the direct influence of El Nino or global SST variability. The index is further discussed in [43] [44] and is accessible online at http://ljp.lasg.ac.cn/dct/page/65592.
Figure 1 shows WA depicting its three rainfall zones of GC (0˚ - 10˚N, 25˚W - 15˚E), WSS (10˚N - 20˚N, 25˚W - 5˚W) and ESS (10˚N - 20˚N, 5˚W - 15˚E) [45] [48] [55] [78] [79] [80] [81] . From the seasonal migration of the ICTZ or ITD, the rainy (wet) season over WA starts from May with cessation in October [19] [21] [73] [82] - [87] .
3. Methodology
The rainfall variability index, which represents the standardized precipitation departure of rainfall time series at different climate regimes, has been used. This method has extensively been adopted at different locations and times scales over

Figure 1. West Africa showing the Guinea Coast (GC), Western Sudano Sahel (WSS) and Eastern Sudano Sahel (ESS).
WA [57] [81] [88] [89] especially on the Sahel [52] [54] [55] and on the GC [90] . The equation is
(2)
where is the variability index for year k, is the total wet season rainfall in year k, and are the long-term means and standard deviations respectively of the wet season rainfall from 1979 to 2014. The index quantifies the wetness or dryness of a given rainy season, with reference to the climatology. For this study, we adopted the conditions of [54] for years with being significantly wet (dry). We select the extreme wet (dry) years if the condition occurred simultaneously over GC, WSS and ESS for a particular year.
Also, the vertically integrated moisture flux convergence (MFC, g∙kg−1∙s−1) over the region has been examined in order to evaluate the concentration of moisture in the lower troposphere and the importance of its flux on the precipitation over the local area [91] [92] [93] [94] . From the surface (s) to the 300 hPa level (P300) in the wet (dry) years, The MFC is determined from the equation
(3)
where is the horizontal gradient operator, g is the acceleration due to gravity (m s−2), P is the surface pressure (hPa), q is the specific humidity (g∙kg−1) and is the horizontal wind vector (m∙s−1). The square bracket denotes the horizontal moisture flux transport (g∙kg−1∙m∙s−1) at a particular pressure level and consists of both the mean motion and the transient eddy components.
4. Results and Discussion
4.1. Interannual Rainfall Variability
Owing to inconsistency in seasonal rainfall variability, Figure 2 shows the CRU variability index of the areal average wet season (May-October) rainfall over the rainfall zones of GC, ESS and WSS adopted over WA by its rainfall regimes [45] [48] [55] [78] [79] [80] [81] from 1979 to 2014. It is noteworthy that CRU has no data over the ocean hence the preference, as its wet season rainfall variability index does not cover the oceans. Wet season rainfall variability over the ocean is not within the scope of this study as it has no immediate relevance to agriculture over WA. From a Mann-Kendall test of the time series for trend, the WSS shows a stronger trend (α = 0.001 level of significance), the ESS show a trend with α = 0.05 level of significance whereas the GC show a non-significant trend. However, the Sen’s slope values indicate increment at the three zones with rates of 0.010 year−1, 0.054 year−1 and 0.044 year−1 over the GC, WSS and ESS respectively. Nevertheless, the rate of these increases is observed less over the GC whereas the WSS shows faster recovering from the earlier droughts than the ESS. The coefficients of variation (CV) of the wet season monthly rainfall over GC, WSS and ESS are 15.9%, 58.5% and 65.2% respectively.

Figure 2. CRU areal average of wet season rainfall variability index on Guinea Coast (GC), Western Sudano Sahel (WSS) and Eastern Sudano Sahel (ESS) zones from 1979 to 2014.
In Figure 3 is shown the seasonal time series of the ONI and SAODI for the period. The recent linear relationship between these oceanic pulsations with the wet season areal averaged rainfall anomaly over the zones is shown by the correlation values in Table 1. Although with low values, the ONI shows significant negative correlation at 95% confidence level (CL) from two-tailed t-test over the Sahel zones (r = −0.2) whereas its signature is not significant on GC. These low values indicate that this could not be a major driver of the wet season rainfall variability in the Sahel. On the other hand, SAODI shows positive correlation (significant at 95% CL from t-test) value with the wet season rainfall anomaly over GC (r = 0.2), which corroborates with the findings of [43] and [45] . The SAODI signature shows no significant correlation over the Sahel zones. This value over GC is yet low to be the major driver of the wet season rainfall variability over the zone.
4.2. Atmospheric Circulation Associated with Wet and Dry Years
From the Equation (3) and using the conditions prescribed in Section 3b for extreme wet (dry) years, five wet (dry) years were identified respectively as shown in Table 2. From the indexes, it is obvious that 1999 was the first extreme wet year experienced over the entire WA region since recovering from its earlier droughts [95] . The CRU composite seasonal rainfall anomaly (shaded) of the recent extremely wet (dry) years is shown in Figure 4(a) and Figure 4(b). Also shown in the figures are the composite MFC (contour), which is imperative in predicting rainfall associated with synoptic-scale systems [96] [97] , and the associated vertically integrated moisture flux transport (vector) over the region. The moisture flux over the region is transported mostly from the Gulf of Guinea area with fewer contributions from the northern tropical Atlantic and the Mediterranean Sea [20] [73] . The MFC is stronger (weaker) in the wet (dry) years. A

Figure 3. The seasonal time series of the Ocean Nino Index (ONI) and the South Atlantic Ocean Dipole Index (SAODI).

Table 1. Temporal correlation (r) values of the seasonal time series ONI and the SAODI with the wet season rainfall anomaly over Guinea Coast (GC), Western Sudano Sahel (WSS) and Eastern Sudano Sahel (ESS).
#Significant at 95% confidence level from two tailed t-test. *Not significant at 95% confidence level from two tailed t-test.
Table 2. The identified wet and dry years occurring simultaneously in the Guinea Coast (GC), Western Sudano Sahel (WSS) and Eastern Sudano Sahel (ESS) zones from the rainfall variability index.
divergence (negative MFC) spot is observed over the Mount Cameroon (4˚N, 10˚E) area in May, which extends northwards and expands along the wet season months until it subsides in October. The magnitude of this spot is stronger (weaker) in the wet (dry) years and acts as a ridge separating the MFC further northwards. A further study into the dynamics of this atmospheric boundary layer is a frontier in the seasonal prediction of wet or dry years.
Also, the composite vertical zonal wind profile associated with the wet (dry) years, averaged along longitudes 25˚W to 15˚E, is shown in Figure 5(a) and Figure 5(b). The magnitude of the monsoon westerly (850 - 1000 hPa) is stronger (weaker) in the wet (dry) years. The AEJ (600 - 650 hPa) has less (more) magnitude in the wet (dry) years and is positioned more (less) northwards sustaining more (less) MCS over the region, which corroborates previous studies
 (a)
(a) (b)
(b)
Figure 4. (a) The CRU composite wet season rainfall anomaly (shaded, mm) in the dry and wet years as well as the associated vertically integrated moisture flux transport (vector, g∙kg−1∙m∙s−1) and MFC (contours, g∙kg−1∙s−1) in May, June and July. Solid (broken) contour lines depict convergence (divergence); (b) Same as (a), but for the months of August, September and October.
 (a)
(a) (b)
(b)
Figure 5. (a) The composite vertical zonal wind (m∙s−1) profile in dry and wet years from the surface to 100 hPa level and averaged along longitudes 25˚W to 15˚E in May, June and July. Solid (broken) lines are westerly (easterly) winds; (b) Same as (a) but for the months of August, September and October.
[12] [13] [14] [61] [73] [98] [99] . The westerly Saharan Air Layer (SAL, 500 - 600 hPa) is weaker (stronger) in the wet (dry) year. The SAL causes entrapment of the AEJ and MFC hence affecting the moisture budget of the region [16] [20] [100] . The TEJ (150 - 200 hPa), which occurs southwards of the AEJ, has longer (shorter) duration in the wet (dry) years. It starts in June and ends in October in the wet years whereas it starts in July and ends in September in the dry years [101] . Figure 6(a) and Figure 6(b) show the composite mslp anomaly associated with the wet (dry) years. The wet years have predominantly negative mslp anomalies, which supports cyclonic activities whereas the dry years have positive mslp anomalies, which supports atmospheric cooling hence the dryness [102] .
The differences between the fields in wet and dry years are shown in Figures 7-9. Figure 7 reveals that the excess MFC over the Gulf of Guinea from May grows through to July following the trajectory of the excess moisture flux transport until its center of convergence breaks in August, with a more massive convergence at the eastern Atlantic towards the coast of Senegal. The magnitude of the MFC reduces from September to October. The excess rainfall anomaly also reflects this migration. In Figure 8, the difference reveals the WAWJ, which occurs in wet years with its core at 700 hPa, starting prominently in June between latitudes 2˚N - 4˚N and ending in October with its peak in August at 8˚N [103] . The jet forms over the eastern Atlantic towards the WA coast (not shown) and supports the transport of the earlier stated massive convergence over the Sahel hence sustaining the excess rainfall activity in wet years with its peak in August. Figure 9 reveals that the predominant negative mslp anomaly over WA in wet years decreases further from May, reaching its peak decrease in August, and then reverting in September to October.
4.3. FGOALS-s2 Representation of the Associated Atmospheric Circulation
The FGOALS-s2 model AMIP experiment outputs ability in representing the atmospheric circulation associated with the wet and dry years have been examined. Figure 10(a) and Figure 10(b) shows FGOALS-s2 simulation of wet season rainfall anomaly (contour, mm∙day−1) and the difference with the CMAP anomaly (shaded, mm∙day−1) in wet and dry years. The model has negative anomalies over land in May to July but showed positive anomalies from August to October in wet years. In dry years, the model showed negative anomalies in May, July and September respectively whereas it showed positive anomalies in June, August and October respectively. The difference between the model simulation and CMAP reveals the model’s underestimation in May to August in wet years, and in September of dry years. Similarly, it overestimates in September and October of wet years as well as June, August and October in the dry year respectively. The RMSE and spatial correlation values further reveal the performance of the model. This result implies a weak simulation of wet season rainfall anomaly over WA.
 (a)
(a) (b)
(b)
Figure 6. (a) The composite mslp anomaly (hPa) in dry and wet years in May, June and July. Solid (broken) lines depict positive (negative) anomaly; (b) Same as (a) but for the months of August, September and October.

Figure 7. Difference between the composite wet season rainfall anomaly (shaded, mm), vertically integrated moisture flux transport (vector, g∙kg−1∙m∙s−1) and MFC (contours, g∙kg−1∙s−1) in wet and dry years.

Figure 8. Difference between the composite vertical zonal wind (m∙s−1) profile in wet and dry years.

Figure 9. Difference between the composite mslp anomaly (hPa) in wet and dry years.
In Figure 11(a) and Figure 11(b), the models composite MFC (contours) is also simulated to be stronger (weaker) in wet (dry) years as well as the latitudinal migration within the wet season months. The divergence (negative MFC) spot over the Mount Cameroon (4˚N, 10˚E) area is also captured in the model. The MFC difference between FGOALS-s2 and NCEP (shaded) reveals that the model simulation is overestimated over east of the northern tropical Atlantic whereas it is underestimated over the Gulf of Guinea region. This is consistent in both the wet and dry years. The RMSE and spatial correlation (significant at 95% CL from t-test) values between FGOALS-s2 and NCEP through the wet season months (shown above each panel) illustrates the model better simulations in the dry years. The implication is that the model fairly reproduces the MFC attributes in extreme events over WA.
In order to evaluate FGOALS-s2 representation of the synoptic components of WAM, the areal average of the composite zonal wind has been separated into the monsoon westerly (925 hPa), the AEJ (600 hPa) and the TEJ (150 hPa) as shown in Figure 12. At 925 hPa, FGOALS-s2 exaggerated the magnitude of monsoon westerly in both the wet and dry years through the wet season months. However, both the model and reanalysis agrees in the pattern of the monsoon westerly with a temporal correlation of 0.93 and 0.95 (both significant at 95% CL from t-test) and RMSE of 3.019 m/s and 3.061 m/s in wet and dry years respectively.
 (a)
(a) (b)
(b)
Figure 10. (a) FGOALS-s2 representation of the composite wet season rainfall anomaly (contour, mm∙day−1) in dry and wet years for May, June and July. The shades (mm∙day−1) represent the difference between FGOALS-s2 and CMAP. The RMSE and spatial correlation are shown above each panel; (b) Same as (a) but for the months of August, September and October.
 (a)
(a)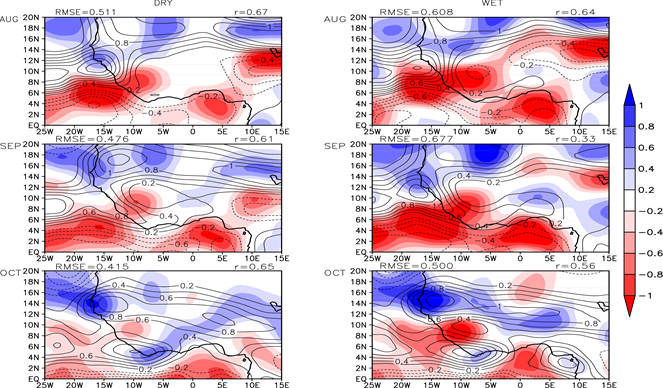 (b)
(b)
Figure 11. (a) FGOALS-s2 representation of the composite MFC (contours, g∙kg−1∙s−1) in dry and wet years for May, June and July. The solid (broken) contour lines depict convergence (divergence). The shades represent the difference between FGOALS-s2 and NCEP. The RMSE and spatial correlation, significant at 95% confidence level from t-test, are shown above each panel; (b) Same as (a) but for the months of August, September and October.

Figure 12. FGOALS-s2 and NCEP zonal wind areal average (0˚ - 20˚N, 25˚W - 15˚E) at levels 925 hPa, 600 hPa and 150 hPa representing the monsoon westerly, AEJ and TEJ respectively during the wet season. The RMSE and temporal correlation are shown above each panel.
At 600 hPa, the model showed strong agreement with the reanalysis with a temporal correlation of 0.82 (significant at 95% CL from t-test) and RMSE of 0.709 m/s in the dry years.
Whereas in the wet years, the model showed a non-significant correlation of 0.69 with the reanalysis with RMSE of 2.614 m/s and this is evident as FGOALS-s2 failed to capture the AEJ in July and August but it did for the other wet season months (not shown). At 150 hPa, the model also exaggerated the magnitude of TEJ in both the wet and dry years but agrees with the reanalysis in the patterns with a temporal correlation of 0.92 and 0.95 (both significant at 95% CL from t-test) and RMSE of 11.887 m/s and 8.767 m/s in wet and dry years respectively. The model difference between wet and dry years show the WAWJ but it starts in July, with its core at 600 hPa and peaking in September, whereas it ends in October (not shown). The result suggests that the model may not be a good tool in studying AEJ but is appropriate for TEJ and the westerlies. Figure 13(a) and Figure 13(b) shows that the model simulates dominant negative (positive) composite mslp anomaly (contours) in the wet (dry) years. The difference between the model and the reanalysis (shaded) shows discrepancies in the model’s simulation of the mslp anomaly magnitude. The RMSE and spatial correlation (significant at 95% CL from t-test) values between FGOALS-s2 and NCEP through the wet season months are shown above each panel. This implies that the model is a fair representation of the reanalysis.
 (a)
(a) (b)
(b)
Figure 13. (a) FGOALS-s2 representation of the composite mslp anomaly (hPa) in dry and wet years for May, June and July. The solid (broken) contour lines depict convergence (divergence). The shades represent the difference between FGOALS-s2 and NCEP. The RMSE and spatial correlation, significant at 95% confidence level from t-test, are shown above each panel; (b) Same as (a) but for the months of August, September and October.
5. Conclusions
From the foregoing, this study has shown that the recent rainfall variability indexes over WA indicate increments in the rate of WAM wet season (May to October) rainfall at the three zones. Though the rate of the increment is less over GC, the higher value over WSS confirms that it is recovering faster than ESS from the earlier droughts of WA. The variability has been significantly linked to the oceanic pulsations as the SAODI shows a positive linear relationship with the wet season rainfall variability over GC whereas the ONI shows negative linear relationship over the Sahel zones, though with low correlation values. The recent extremely wet and dry years identified from the rainfall variability indexes have been investigated for the underlying trends associated with atmospheric circulation. Wet (dry) years are associated with stronger (weaker) MFC whereas the magnitude of its divergence at the atmospheric boundary layer over the Mount Cameroon area determines how further northwards (southwards) it is displaced in the wet (dry) years hence supporting more (less) rainfall. In wet (dry) years, the monsoon westerly is stronger (weaker), the SAL is weaker (stronger) whereas the TEJ is stronger (weaker) and the AEJ is weaker (stronger). The zonal wind difference between wet and dry years reveals the WAWJ. The mslp anomaly is predominantly negative (positive) in wet (dry) years.
FGOALS-s2, one of the outstanding models from China that participated in the CMIP5 project [74] , has shown remarkable performance in the simulation of the atmospheric circulation associated with the wet and dry years. The model shows a significant correlation with the reanalysis both at spatial and temporal scales. However, the RMSE values show the absolute measure of the expected uncertainties in the model when compared with the reanalysis. In view of the limited resources, this result makes FGOALS-s2 a viable tool in the prediction of seasonal rainfall extremes over WA. Further studies are ongoing in our group towards understanding the dynamics of the Mount Cameroon area as its baroclinic is imperative to atmospheric dynamics near coastal regions and fronts.
Acknowledgements
The corresponding author acknowledges that earlier part of this study has been carried out through TWAS-CAS postgraduate fellowship while subsequent and concluding studies through the postdoctoral fellowship granted him supported by The Chinese Academy of Sciences President’s International Fellowship Initiative, CAS-PIFI, (GRANT No. 2016PE035) both at the Institute of Atmospheric Physics, Center for Monsoon System Research. Appreciation also goes to the anonymous reviewers.
Cite this paper
Okoro, U.K., Chen, W., Chineke, C. and Nwofor, O. (2017) Anomalous Atmospheric Circulation Associated with Recent West African Monsoon Rainfall Variability. Journal of Geoscience and Environment Protection, 5, 1-27. https://doi.org/10.4236/gep.2017.512001
References
- 1. FAO (2008) Water and the Rural Poor. Interventions for Improving Livelihoods in Sub-Saharan Africa. Food and Agriculture Organization of the United Nations, 93.
- 2. IAASTD (2009) Agriculture at a Crossroads. Sub-Saharan Africa (SSA) Report. International Assessment of Agricultural Knowledge, Science and Technology for Development, 147.
- 3. Linard, C., Gilbert, M., Snow, R.W., Noor, A.M. and Tatem, A.J. (2012) Population Distribution, Settlement Patterns and Accessibility across Africa in 2010. PLoS ONE, 7, e31743. https://doi.org/10.1371/journal.pone.0031743
- 4. Bayo Omotosho, J. (1985) The Separate Contributions of Squall Lines, Thunderstorms and the Monsoon to the Total Rainfall in Nigeria. International Journal of Climatology, 5, 543-552. https://doi.org/10.1002/joc.3370050507
- 5. Abiodun, B.J., Pal, J.S., Afiesimama, E.A., Gutowski, W.J. and Adedoyin, A. (2008) Simulation of West African Monsoon Using RegCM3 Part II: Impacts of Deforestation and Desertification. Theoretical and Applied Climatology, 93, 245-261.https://doi.org/10.1007/s00704-007-0333-1
- 6. Burpee, R.W. (1972) The Origin and Structure of Easterly Waves in the Lower Troposphere of North Africa. Journal of the Atmospheric Sciences, 29, 77-90.https://doi.org/10.1175/1520-0469(1972)029<0077:TOASOE>2.0.CO;2
- 7. Reed, R.J., Norquist, D.C. and Recker, E.E. (1977) The Structure and Properties of African Wave Disturbances as Observed during Phase III of GATE. Monthly Weather Review, 105, 317-333. https://doi.org/10.1175/1520-0493(1977)105<0317:TSAPOA>2.0.CO;2
- 8. Thorncroft, C.D. (1995) An Idealized Study of African Easterly Waves. III: More Realistic Basic States. Quarterly Journal of the Royal Meteorological Society, 121, 1589-1614. https://doi.org/10.1002/qj.49712152706
- 9. Pytharoulis, I. and Thorncroft, C.D. (1999) The Low-Level Structure of African Easterly Waves in 1995. Monthly Weather Review, 127, 2266-2280. https://doi.org/10.1175/1520-0493(1999)127<2266:TLLSOA>2.0.CO;2
- 10. Thorncroft, C.D. and Blackburn, M. (1999) Maintenance of the African Easterly Jet. Quarterly Journal of the Royal Meteorological Society, 125, 763-786.https://doi.org/10.1002/qj.49712555502
- 11. Hsieh, J.-S. and Cook, K.H. (2008) On the Instability of the African Easterly Jet and the Generation of African Waves: Reversals of the Potential Vorticity Gradient. Journal of the Atmospheric Sciences, 65, 2130-2151. https://doi.org/10.1175/2007JAS2552.1
- 12. Nicholson, S.E. and Webster, P.J. (2007) A Physical Basis for the Interannual Variability of Rainfall in the Sahel. Quarterly Journal of the Royal Meteorological Society, 133, 2065-2084. https://doi.org/10.1002/qj.104
- 13. Nicholson, S.E., Barcilon, A.I. and Challa, M. (2008) An Analysis of West African Dynamics Using a Linearized GCM. Journal of the Atmospheric Sciences, 65, 1182-1203. https://doi.org/10.1175/2007JAS2194.1
- 14. Kalapureddy, M.C.R., Lothon, M., Campistron, B., Lohou, F. and Said, F. (2010) Wind Profiler Analysis of the African Easterly Jet in Relation with the Boundary Layer and the Saharan Heat-Low. Quarterly Journal of the Royal Meteorological Society, 136, 77-91. https://doi.org/10.1002/qj.494
- 15. Thorncroft, C.D., Parker, D.J., Burton, R.R., Diop, M., Ayers, J.H., Barjat, H., Devereau, S., Diongue, A., Dumelow, R., Kindred, D.R., Price, N.M., Saloum, M., Taylor, C.M. and Tompkins, A.M. (2003) The JET2000 Project: Aircraft Observations of the African Easterly Jet and African Easterly Waves. Bulletin of the American Meteorological Society, 84, 337-351. https://doi.org/10.1175/BAMS-84-3-337
- 16. Parker, D.J., Burton, R.R., Diongue-Niang, A., Ellis, R.J., Felton, M., Taylor, C.M., Thorncroft, C.D., Bessemoulin, P. and Tompkins, A.M. (2005) The Diurnal Cycle of the West African Monsoon Circulation. Quarterly Journal of the Royal Meteorological Society, 131, 2839-2860. https://doi.org/10.1256/qj.04.52
- 17. Lavaysse, C., Flamant, C., Janicot, S. and Knippertz, P. (2009) Dynamics and Impacts on Convection of the Intra-Seasonal Variabilities of the West African Heat Low. Quarterly Journal of the Royal Meteorological Society, 136, 142-159.
- 18. Lavaysse, C., Flamant, C., Janicot, S., Parker, D.J., Lafore, J.-P., Sultan, B. and Pelon, J. (2009) Seasonal Evolution of the West African Heat Low: A Climatological Perspective. Climate Dynamics, 33, 313-330. https://doi.org/10.1007/s00382-009-0553-4
- 19. Cuesta, J., Lavaysse, C., Flamant, C., Mimouni, M. and Knippertz, P. (2010) Northward Bursts of the West African Monsoon Leading to Rainfall over the Hoggar Massif, Algeria. Quarterly Journal of the Royal Meteorological Society, 136, 174-189. https://doi.org/10.1002/qj.439
- 20. Lafore, J.-P., Flamant, C., Giraud, V., Guichard, F., Knippertz, P., Mahfouf, J.-F., Mascart, P. and Williams, E.R. (2010) Editorial Introduction to the AMMA Special Issue on “Advances in Understanding Atmospheric Processes over West Africa through the AMMA Field Campaign”. Quarterly Journal of the Royal Meteorological Society, 136, 2-7. https://doi.org/10.1002/qj.583
- 21. Nicholson, S.E. (2013) The West African Sahel: A Review of Recent Studies on the Rainfall Regime and Its Interannual Variability. ISRN Meteorology, 2013, Article ID: 453521. https://doi.org/10.1155/2013/453521
- 22. Peter, M. and Tetzlaff, G. (1998) The Structure of West African Squall Lines and Their Environmental Moisture Budget. Meteorology and Atmospheric Physics, 39, 74-84. https://doi.org/10.1007/BF01041933
- 23. Sultan, B. and Janicot, S. (2000) Abrupt Shift of the ITCZ over West Africa and Intra-Seasonal Variability. Geophysical Research Letters, 27, 3353-3356. https://doi.org/10.1029/1999GL011285
- 24. Lamb, P.J. (1982) Persistence of Subsaharan Drought. Nature, 299, 46-47.https://doi.org/10.1038/299046a0
- 25. Nicholson, S.E. (1985) Sub-Saharan Rainfall 1981-84. Journal of Climate and Applied Meteorology, 24, 1388-1391. https://doi.org/10.1175/1520-0450(1985)024<1388:SSR>2.0.CO;2
- 26. Folland, C.K., Palmer, T.N. and Parker, D.E. (1986) Sahel Rainfall and Worldwide Sea Temperature 1901-85. Nature, 320, 602-607. https://doi.org/10.1038/320602a0
- 27. Rowell, D.P, Folland, C.K., Maskell, K. and Ward, M.N. (1995) Variability of Summer Rainfall over Tropical North Africa (1906-1992): Observations and Modeling. Quarterly Journal of the Royal Meteorological Society, 121, 669-704.
- 28. Fontaine, B. and Janicot, S. (1996) Sea Surface Temperature Fields Associated with West African Rainfall Anomaly Types. Journal of Climate, 9, 2935-2940. https://doi.org/10.1175/1520-0442(1996)009<2935:SSTFAW>2.0.CO;2
- 29. Ward, M.N. (1998) Diagnosis and Short-Lead Time Prediction of Summer Rainfall in Tropical North Africa at Interannual and Multidecadal Timescales. Journal of Climate, 11, 3167-3191. https://doi.org/10.1175/1520-0442(1998)011<3167:DASLTP>2.0.CO;2
- 30. Taylor, C.M., Parker, D.J. and Harris, P.P. (2007) An Observational Case Study of Mesoscale Atmospheric Circulations Induced by Soil Moisture. Geophysical Research Letters, 34, L15801. https://doi.org/10.1029/2007GL030572
- 31. Nicholson, S.E. and Entekhabi, D. (1986) The Quasi-Periodic Behavior of Rainfall Variability in Africa and Its Relationship to the Southern Oscillation. Archives for Meteorology, Geophysics, and Bioclimatology, Series A, 34, 311-348.
- 32. Ropelewski, C.F. and Halpert, M.S. (1987) Global and Regional Scale Precipitation Associated with El Nino/Southern Oscillation. Monthly Weather Review, 115, 985-996. https://doi.org/10.1175/1520-0493(1987)115<1606:GARSPP>2.0.CO;2
- 33. Semazzi, F.H.M., Mehta, V. and Sud, Y.C. (1988) An Investigation of the Relationship between Sub-Saharan Rainfall and Global Sea Surface Temperatures. Atmosphere-Ocean, 26, 118-138.
- 34. Wolter, K. (1989) Modes of Tropical Circulation, Southern Oscillation, and Sahel Rainfall Anomalies. Journal of Climate, 2, 149-172. https://doi.org/10.1175/1520-0442(1989)002<0149:MOTCSO>2.0.CO;2
- 35. Hastenrath, S. (1990) The Relationship of Highly Reflective Clouds to Tropical Climate Anomalies. Journal of Climate, 3, 353-365. https://doi.org/10.1175/1520-0442(1990)003<0353:TROHRC>2.0.CO;2
- 36. Nicholson, S.E. and Kim, J. (1997) The Relationship of the El Nino-Southern Oscillation to African Rainfall. International Journal of Climatology, 17, 117-135. https://doi.org/10.1002/(SICI)1097-0088(199702)17:2<117::AID-JOC84>3.0.CO;2-O
- 37. Moron, V. and Ward, M.N. (1998) ENSO Teleconnections with Climate Variability in the European and African Sectors. Weather, 53, 287-295.https://doi.org/10.1002/j.1477-8696.1998.tb06403.x
- 38. Joly, M. and Voldoire, A. (2009) Influence of ENSO on the West African Monsoon: Temporal Aspects and Atmospheric Processes. Journal of Climate, 22, 3193-3210.https://doi.org/10.1175/2008JCLI2450.1
- 39. Zebiak, S.E. (1993) Air-Sea Interaction in Equatorial Atlantic Region. Journal of Climate, 6, 1567-1586. https://doi.org/10.1175/1520-0442(1993)006<1567:AIITEA>2.0.CO;2
- 40. Wagner, R.G. and Da Silva, A.M. (1994) Surface Conditions Associated with Anomalous Rainfall in the Guinea Coastal Region. International Journal of Climatology, 14, 179-199. https://doi.org/10.1002/joc.3370140205
- 41. Vizy, E.K. and Cook, K.H. (2001) Mechanisms by Which Gulf of Guinea and Eastern North Atlantic Sea Surface Temperature Anomalies Can Influence African Rainfall. Journal of Climate, 14, 795-821. https://doi.org/10.1175/1520-0442(2001)014<0795:MBWGOG>2.0.CO;2
- 42. Chang, P., Fang, Y., Saravanan, R., Ji, L. and Seidel, H. (2006) The Cause of the Fragile Relationship between the Pacific El Nino and the Atlantic Nino. Nature, 443, 324-328. https://doi.org/10.1038/nature05053
- 43. Nnamchi, H.C. and Li, J. (2011) Influence of the South Atlantic Ocean Dipole on West African Summer Precipitation. Journal of Climate, 24, 1184-1197.https://doi.org/10.1175/2010JCLI3668.1
- 44. Nnamchi, H.C., Li, J.P. and Anyadike, R.N.C. (2011) Does a Dipole Mode Really Exist in the South Atlantic Ocean? Journal of Geophysical Research, 116, D15104.https://doi.org/10.1029/2010JD015579
- 45. Nnamchi, H.C., Li, J., Kang, I.-S. and Kucharski F. (2013) Simulated Impacts of the South Atlantic Ocean Dipole on Summer Precipitation at the Guinea Coast. Climate Dynamics, 41, 677-694. https://doi.org/10.1007/s00382-012-1629-0
- 46. Motha, R.P., Leduc, S.K., Steyaert, L.T., Sakamoto, C.M. and Strommen, N.D. (1980) Precipitation Patterns in West Africa. Monthly Weather Review, 108, 1567-1578. https://doi.org/10.1175/1520-0493(1980)108<1567:PPIWA>2.0.CO;2
- 47. Nicholson, S.E. (1980) The Nature of Rainfall Fluctuations in Subtropical West Africa. Monthly Weather Review, 108, 473-487. https://doi.org/10.1175/1520-0493(1980)108<0473:TNORFI>2.0.CO;2
- 48. Janowiak, J.E. (1988) An Investigation of Interannual Rainfall Variability in Africa. Journal of Climate, 1, 240-255. https://doi.org/10.1175/1520-0442(1988)001<0240:AIOIRV>2.0.CO;2
- 49. Fontaine, B., Janicot, S. and Moron, V. (1995) Rainfall Anomaly Patterns and Wind Field Signals over West Africa in August (1958-1989). Journal of Climate, 8, 1503-1510. https://doi.org/10.1175/1520-0442(1995)008<1503:RAPAWF>2.0.CO;2
- 50. Nicholson, S.E., Some, B. and Kone, B. (2000) An Analysis of Recent Rainfall Conditions in West Africa, Including the Rainy Seasons of the 1997 El Nino and the 1998 La Nina Years. Journal of Climate, 13, 2628-2640. https://doi.org/10.1175/1520-0442(2000)013<2628:AAORRC>2.0.CO;2
- 51. Le Barbé, L., Lebel, T. and Tapsoba, D. (2002) Rainfall Variability in West Africa during the Years 1950-90. Journal of Climate, 15, 187-202. https://doi.org/10.1175/1520-0442(2002)015<0187:RVIWAD>2.0.CO;2
- 52. L’Hote, Y., Mahé, G., Somé, B. and Triboulet, J.P. (2002) Analysis of a Sahelian Annual Rainfall Index from 1896 to 2000; the Drought Continues. Hydrological Sciences Journal, 47, 563-572. https://doi.org/10.1080/02626660209492960
- 53. Li, J. and Zeng, Q. (2003) A New Monsoon Index and the Geographical Distribution of the Global Monsoon. Advances in Atmospheric Sciences, 20, 299-302.https://doi.org/10.1007/s00376-003-0016-5
- 54. Ali, A. and Lebel, T. (2009) The Sahelian Standardized Rainfall Index Revisited. International Journal of Climatology, 29, 1705-1714. https://doi.org/10.1002/joc.1832
- 55. Lebel, T. and Ali, A. (2009) Recent Trends in the Central and Western Sahel Rainfall Regime (1990-2007). Journal of Hydrology, 375, 52-64.https://doi.org/10.1016/j.jhydrol.2008.11.030
- 56. Nicholson, S.E. (1981) Rainfall and Atmospheric Circulation during Drought Periods and Wetter Years in West Africa. Monthly Weather Review, 109, 2191-2208. https://doi.org/10.1175/1520-0493(1981)109<2191:RAACDD>2.0.CO;2
- 57. Nicholson, S.E. (1986) The Spatial Coherence of African Rainfall Anomalies: Interhemispheric Teleconnections. Journal of Climate and Applied Meteorology, 25, 1365-1381. https://doi.org/10.1175/1520-0450(1986)025<1365:TSCOAR>2.0.CO;2
- 58. Eltahir, E.A.B. and Gong, C. (1996) Dynamics of Wet and Dry Years in West Africa. Journal of Climate, 9, 1030-1042. https://doi.org/10.1175/1520-0442(1996)009<1030:DOWADY>2.0.CO;2
- 59. Janicot, S., Harzallah, A., Fontaine, B. and Moron, V. (1998) West-African Monsoon Dynamics and Eastern Equatorial Atlantic and Pacific SST Anomalies (1970-88). Journal of Climate, 11, 1874-1882.https://doi.org/10.1175/1520-0442-11.8.1874
- 60. Long, M., Entekhabi, D. and Nicholson, S.E. (2000) Interannual Variability of Rainfall, Water Vapor Flux, and Vertical Motion over West Africa. Journal of Climate, 13, 3827-3841. https://doi.org/10.1175/1520-0442(2000)013<3827:IVIRWV>2.0.CO;2
- 61. Nicholson, S.E. and Grist, J.P. (2001) A Conceptual Model for Understanding Rainfall Variability in the West African Sahel on Interannual and Interdecadal Timescales. International Journal of Climatology, 21, 1733-1757.https://doi.org/10.1002/joc.648
- 62. Dai, A.D., Lamb, P.J., Trenberth, K.E., Hulme, M., Jones, P.D. and Xie, P. (2004) The Recent Sahel Drought Is Real. International Journal of Climatology, 24, 1323-1331. https://doi.org/10.1002/joc.1083
- 63. Sanogo, S., Fink, A.H., Omotosho, J.A., Ba, A., Redl, R. and Ermert, V. (2015) Spatio-Temporal Characteristics of the Recent Rainfall Recovery in West Africa. International Journal of Climatology, 35, 4589-4605. https://doi.org/10.1002/joc.4309
- 64. Mitchell, T.D. and Jones, P.D. (2005) An Improved Method of Constructing a Database of Monthly Climate Observations and Associated High-Resolution Grids. International Journal of Climatology, 25, 693-712. https://doi.org/10.1002/joc.1181
- 65. Xie, P. and Arkin, P.A. (1997) Global Precipitation: A 17-Year Monthly Analysis Based on Gauge Observations, Satellite Estimates, and Numerical Model Outputs. Bulletin of the American Meteorological Society, 78, 2539-2558. https://doi.org/10.1175/1520-0477(1997)078<2539:GPAYMA>2.0.CO;2
- 66. Okoro, U.K., Chen, W., Chineke, C. and Nwofor, O. (2014) Comparative Analysis of Gridded Datasets and Gauge Measurements of Rainfall in the Niger Delta Region. Research Journal of Environmental Sciences, 8, 373-390. https://doi.org/10.3923/rjes.2014.373.390
- 67. Kalnay, E., Kanamitsu, M., Kistler, R., Collins, W., Deaven, D., Gandin, L., Iredell, M., Saha, S., White, G., Woollen, J., Zhu, Y., Leetmaa, A., Reynolds, R., Chelliah, M., Ebisuzaki, W., Higgins, W., Janowiak, J., Mo, K.C., Ropelewski, C., Wang, J., Jenne, R. and Joseph, D. (1996) The NCEP/NCAR 40-Year Reanalysis Project. Bulletin of the American Meteorological Society, 77, 437-471. https://doi.org/10.1175/1520-0477(1996)077<0437:TNYRP>2.0.CO;2
- 68. Kanamitsu, M., Ebisuzaki, W., Woollen, J., Yang, S.-K., Hnilo, J.J., Fiorino, M. and Potter, G.L. (2002) NCEP-DOE AMIP-II Reanalysis (R-2). Bulletin of the American Meteorological Society, 83, 1631-1643. https://doi.org/10.1175/BAMS-83-11-1631
- 69. Bosilovich, M.G., Junye, C., Robertson, F.R. and Adler, R.F. (2008) Evaluation of Global Precipitation in Reanalyses. Journal of Applied Meteorology and Climatology, 47, 2279-2299. https://doi.org/10.1175/2008JAMC1921.1
- 70. Diedhiou, A., Janicot, S., Viltard, A., de Felice, P. and Laurent, H. (1999) Easterly Wave Regimes and Associated Convection over West Africa and the Tropical Atlantic: Results from NCEP/NCAR and ECMWF Reanalyses. Climate Dynamics, 15, 795-822. https://doi.org/10.1007/s003820050316
- 71. Poccard, I., Janicot, S. and Camberlin, P. (2000) Comparison of Rainfall Structures between NCEP/NCAR Reanalysis and Observed Data over Tropical Africa. Climate Dynamics, 16, 897-915. https://doi.org/10.1007/s003820000087
- 72. Janicot, S., Trzaska, S. and Poccard, I. (2001) Summer Sahel-ENSO Teleconnection and Decadal Time Scale SST Variations. Climate Dynamics, 18, 303-320.https://doi.org/10.1007/s003820100172
- 73. Sultan, B. and Janicot, S. (2003) The West African Monsoon Dynamics. Part II: The “Preonset” and “Onset” of the Summer Monsoon. Journal of Climate, 16, 3407-3427. https://doi.org/10.1175/1520-0442(2003)016<3407:TWAMDP>2.0.CO;2
- 74. Zhou, T., Chen, X., Dong, L., Wu, B., Man, W., Zhang, L., Lin, R., Yao, J., Song, F. and Zhao, C. (2014) Chinese Contribution to CMIP5: An Overview of Five Chinese Models’ Performances. Journal of Meteorological Research, 28, 481-509.https://doi.org/10.1007/s13351-014-4001-y
- 75. Bao, Q., Lin, P., Zhou, T., Liu, Y., Yu, Y., Wu, G., He, B., He, J., Li, L., Li, J., Li, Y., Liu, H., Qiao, F., Song, Z., Wang, B., Wang, J., Wang, P., Wang, X., Wang, Z., Wu, B., Wu, T., Xu, Y., Yu, H., Zhao, W., Zheng, W. and Zhou, L. (2013) The Flexible Global Ocean-Atmosphere-Land System Model, Spectral Version 2: FGOALS-s2. Advances in Atmospheric Sciences, 30, 561-576. https://doi.org/10.1007/s00376-012-2113-9
- 76. Taylor, K.E., Stouffer, R.J. and Meehl, G.A. (2012) An Overview of CMIP5 and the Experiment Design. Bulletin of the American Meteorological Society, 93, 485-498.https://doi.org/10.1175/BAMS-D-11-00094.1
- 77. Huang, B., Banzon, V.F., Freeman, E., Lawrimore, J., Liu, W., Peterson, T.C., Smith, T.M., Thorne, P.W., Woodruff, S.D. and Zhang, H.M. (2015) Extended Reconstructed Sea Surface Temperature Version 4 (ERSST. v4). Part I: Upgrades and Intercomparisons. Journal of Climate, 28, 911-930.https://doi.org/10.1175/JCLI-D-14-00006.1
- 78. Janicot, S. (1992) Spatiotemporal Variability of West African Rainfall. Part 1: Regionalizations and Typings. Journal of Climate, 5, 489-497. https://doi.org/10.1175/1520-0442(1992)005<0489:SVOWAR>2.0.CO;2
- 79. Ba, M.B., Frouin R. and Nicholson, S.E. (1995) Satellite-Derived Interannual Variability of West African Rainfall during 1983-88. Journal of Applied Meteorology, 34, 411-431. https://doi.org/10.1175/1520-0450(1995)034<0411:SDIVOW>2.0.CO;2
- 80. Afiesimama, E.A., Pal, J.S., Abiodun, B.J., Gutowski, W.J. and Adedoyin, A. (2006) Simulation of West African Monsoon Using the RegCM3. Part I: Model Validation and Inter Annual Variability. Theoretical and Applied Climatology, 86, 23-37.https://doi.org/10.1007/s00704-005-0202-8
- 81. Lamptey, B.L. (2008) Comparison of Gridded Multisatellite Rainfall Estimates with Gridded Gauge Rainfall over West Africa. Journal of Applied Meteorology and Climatology, 47, 185-205. https://doi.org/10.1175/2007JAMC1586.1
- 82. Sultan, B., Janicot, S. and Diedhiou, A. (2003) The West African Monsoon Dynamics. Part I. Documentation of Intra-Seasonal Variability. Journal of Climate, 16, 3389-3406. https://doi.org/10.1175/1520-0442(2003)016<3389:TWAMDP>2.0.CO;2
- 83. Bock, O., Bouin, M.N., Doerflinger, E., Collard, P., Masson, F., Meynadier, R., Nahmani, S., Koite, M., Gaptia Lawan Balawan, K., Didé, F., Ouedraogo, D., Pokperlaar, S., Ngamini, J.-B., Lafore, J.-P., Janicot, S., Guichard, F. and Nuret, M. (2008) West African Monsoon Observed with Ground-Based GPS Receivers during African Monsoon Multidisciplinary Analysis (AMMA). Journal of Geophysical Research, 113, D21105. https://doi.org/10.1029/2008JD010327
- 84. Couvreux, F., Guichard, F., Bock, O., Lafore, J.-P. and Redelsperger, J.-L. (2009) Monsoon Flux Pulsations over West Africa Prior to the Monsoon Onset. Quarterly Journal of the Royal Meteorological Society, 136, 160-174.
- 85. Guichard, F., Kergoat, L., Mougin, E., Timouk, F., Baup, F., Hiernaux, P. and Lavenu, F. (2009) Surface Thermodynamics and Radiative Budget in the Sahelian Gourma: Seasonal and Diurnal Cycles. Journal of Hydrology, 375, 161-177.https://doi.org/10.1016/j.jhydrol.2008.09.007
- 86. Druyan, L.M., Feng, J., Cook, K.H., Xue, Y., Fulakeza, M., Hagos, S.M., Konar, A., Moufouma-Okia, W., Rowell, D.P., Vizy, E.K. and Ibrah, S.S. (2010) The WAMME Regional Model Intercomparison Study. Climate Dynamics, 35, 175-192.https://doi.org/10.1007/s00382-009-0676-7
- 87. Xue, Y., De Sales, F., Lau, W., Boone, A., Feng, J., Dirmeyer, P., Guo, Z., Kim, K., Kitoh, A., Kumar, V., Poccard-Leclercq, I., Mahowald, N., Moufouma-Okia, W., Pegion, P., Rowell, D., Schemm, J., Schubert, S., Sealy, A., Thiaw, W., Vintzileos, A., Williams, S. and Wu, M. (2010) Intercomparison and Analyses of the Climatology of the West African Monsoon in the West African Monsoon Modeling and Evaluation Project (WAMME) First Model Intercomparison Experiment. Climate Dynamics, 35, 3-27. https://doi.org/10.1007/s00382-010-0778-2
- 88. Moron, V., Robertson, A.W. and Ward, M.N. (2006) Seasonal Predictability and Spatial Coherence of Rainfall Characteristics in the Tropical Setting of Senegal. Monthly Weather Review, 134, 3248-3262. https://doi.org/10.1175/MWR3252.1
- 89. Oguntunde, P.G., Abiodun, B.J. and Lischeid, G. (2011) Rainfall Trends in Nigeria, 1901-2000. Journal of Hydrology, 411, 207-218.https://doi.org/10.1016/j.jhydrol.2011.09.037
- 90. Nnamchi, H.C. and Li, J. (2016) Floods and Droughts along the Guinea Coast in Connection with the South Atlantic Dipole. In: Li, J., Swinbank, R., Grotjahn, R. and Volkert, H., Eds., Dynamics and Predictability of Large-Scale High-Impact Weather and Climate Events, Cambridge University Press, Cambridge, UK, 271-279. https://doi.org/10.1017/CBO9781107775541.023
- 91. Flohn, H. and Korff, H.C. (1965) Studies on the Water Vapor Transport over North Africa: Bonner Meteorologische Abhandlungen, Vol. 6. Meteorologishes Institüt der Universitat Bonn, Germany, 36.
- 92. Trenberth, K.E. and Guillemot, C.J. (1996) Physical Processes Involved in the 1988 Drought and 1993 Floods in North America. Journal of Climate, 9, 1288-1298. https://doi.org/10.1175/1520-0442(1996)009<1288:PPIITD>2.0.CO;2
- 93. Zhou, T.-J. and Yu, R.-C. (2005) Atmospheric Water Vapor Transport Associated with Typical Anomalous Summer Rainfall Patterns in China. Journal of Geophysical Research, 110, D08104. https://doi.org/10.1029/2004JD005413
- 94. Park, J.-S., Jhun, J.-G. and Lee, E.-J. (2009) Characteristic Large-Scale Circulation Anomalies Associated with Persistent Features of Extreme Precipitation over Northeast Asia from Premonsoon Season to Monsoon Season. Journal of Geophysical Research, 114, D11108. https://doi.org/10.1029/2008JD011031
- 95. IFRC (1999) International Federation of Red Cross and Red Crescent Societies—WEST AFRICA FLOODS (Appeal 26/99)—Situation Report 1. http://www.ifrc.org/docs/appeals/99/269901.PDF
- 96. Banacos, P.C. and Schultz, D.M. (2005) The Use of Moisture Flux Convergence in Forecasting Convective Initiation: Historical and Operational Perspectives. Forecaster’s Forum. Weather and Forecasting, 20, 351-366.https://doi.org/10.1175/WAF858.1
- 97. Viste, E. and Sorteberg, A. (2013) Moisture Transport into the Ethiopian Highlands. International Journal of Climatology, 33, 249-263. https://doi.org/10.1002/joc.3409
- 98. Leroux, S., Hall, N.M.J. and Kiladis, G.N. (2010) A Climatological Study of Transient-Mean-Flow Interactions over West Africa. Quarterly Journal of the Royal Meteorological Society, 136, 397-410. https://doi.org/10.1002/qj.474
- 99. Janicot, S. (1994) The Recent West African Rainfall Variability through Empirical and Modelling Investigations. In: Desbois, M. and Désalmand, F., Eds., Global Precipitations and Climate Change. NATO ASI Series (Series I: Global Environmental Change), Vol. 26, Springer, Berlin, Heidelberg, 135-149.https://doi.org/10.1007/978-3-642-79268-7_7
- 100. Couvreux, F., Guichard, F., Bock, O., Campistron, B., Lafore, J.-P. and Redelsperger, J.-L. (2010) Synoptic Variability of the Monsoon Flux over West Africa Prior to the Onset. Quarterly Journal of the Royal Meteorological Society, 136, 159-173.https://doi.org/10.1002/qj.473
- 101. Sathiyamoorthy, V., Pal, P.K. and Joshi, P.C. (2007) Intraseasonal Variability of the Tropical Easterly Jet. Meteorology and Atmospheric Physics, 96, 305-316.https://doi.org/10.1007/s00703-006-0214-7
- 102. Knaff, J.A. (1997) Implications of Summertime Sea Level Pressure Anomalies in the Tropical Atlantic Region. Journal of Climate, 10, 789-804. https://doi.org/10.1175/1520-0442(1997)010<0789:IOSSLP>2.0.CO;2
- 103. Pu, B. and Cook, K.H. (2010) Dynamics of the West African Westerly Jet. Journal of Climate, 23, 6263-6276. https://doi.org/10.1175/2010JCLI3648.1