American Journal of Industrial and Business Management
Vol.05 No.05(2015), Article ID:56324,22 pages
10.4236/ajibm.2015.55026
Analysis of African Iron and Steel Market for Wuhan Iron and Steel Corporation (WISCO)’s Possible Entry: Preliminary Screening and Final Selection Statistical Scoring Model
Ravelomanana Fidelys, Yan Liang
School of Economics and Management, China University of Geosciences (Wuhan), Wuhan, China
Email: fidelys@hotmail.com
Copyright © 2015 by authors and Scientific Research Publishing Inc.
This work is licensed under the Creative Commons Attribution International License (CC BY).
http://creativecommons.org/licenses/by/4.0/


Received 21 March 2015; accepted 8 May 2015; published 14 May 2015
ABSTRACT
This paper described the second part of my PhD research project where African Iron and Steel Market was investigated to support the decision of the entry of Wuhan Iron and Steel Corporation (WISCO) into African Market. The data used are the same as previous study, observations of macroeconomic variables, such as GDP per capita, the index of consumer prices, import iron, the real effective exchange rate, the number of urban population, imports and exports total made on 19 African countries for a period that spans from 2008 to 2012. The countries concerned are: Algeria, Burkina Faso, Ivory Coast, Egypt, Madagascar, Malawi, Mali, Mauritius, Morocco, Mozambique, Niger, Nigeria, Senegal, Seychelles, South Africa, Tanzania, Togo, Tunisia, and Zambia. The empirical study in this paper is divided into two parts: the first part is preliminary screening and the second part is the final selection statistical scoring model. In the first part, the preliminary screening was made by ranking the panel data by political stability variable as it was the main decision criteria of WISCO’s international market selection into the African Iron and Steel Market. We sorted our 19 Africa countries for our study by political stability and absence of violence/ter- rorism percentile value 2013 from the largest to smallest and selected the first 10th rank. The 10 countries that were selected to the next step of our study from our preliminary screening were: Mauritius, Seychelles, Zambia, South Africa, Senegal, Tanzania, Malawi, Mozambique, Togo and Mo- rocco. In the second part of the empirical findings, we analyzed African Iron and Steel Market following the steps of our final selection statistical inverse coefficient of variation scoring model. We started by analyzing statistical inverse coefficient of variation of every variable in the demand side, in supply side, and then, we analyzed the final score made by every country and suggested a final selection. Our analysis of the final score concluded that the five countries that would be suggested to Wuhan Iron and Steel Corporation (WISCO) were: first, Togo with a final score of 70.20, second, Tanzania with a final score of 18.63, third, Morocco with a final score of 15.58, fourth, Senegal with a final score of 14.57, and fifth, Mozambique with a final score of 13.68. WISCO then can choose from these five suggested countries to enter into African Market.
Keywords:
African Iron and Steel Market, International Market Selection, Preliminary Screening, Inverse Coefficient of Variation, Final Selection Statistical Scoring Model

1. Introduction
The steel sector has been the mainstay of the Chinese economy since the early 1950s. China has been one of the key producers in the world’s steel industry over the last decade, with production reaching 500 million metric tons (mmt) in 2008. The share of Chinese steel in the world increased from 5.1% in 1980 to 37.6% in 2008. China’s steel sector is dominated by a few large state-owned enterprises (SOEs) with numerous small and medium-sized enterprises (SMEs), accounting for only a small portion of steel output. Wuhan Iron and Steel Corporation (WISCO) is one of those few large state-owned enterprises (SOEs).
Wuhan Iron and Steel (Group) Corporation (hereinafter referred to as WISCO), commenced its construction from 1955 and put into production on Sep. 13, 1958, is the first giant iron and steel complex established after the founding of the People’s Republic of China and one of the backbone enterprises under the leadership of the Central Government and the State Council. After its integration and reformation with Echeng Iron & Steel Company, and Liuzhou Iron & Steel Company, the group of corporation has had an annual production capacity of 20 million tons, ranking the third of the same in China, and the sixteenth of the same all over the world. WISCO, the important plate production base in China, owns a complete set of processing plants composed of mining, coking, sintering, iron making, steel making, rolling, and the associated utilities. It has made an important contribution to China’s national economy and modernization during its 50 years of construction and development. By the end of 2006, WISCO has produced 177 million tons of steel with an accumulated profit and tax of 85.4 billion RMB, among which, 59.892 billion RMB handed over to the state, which is 9.3 times of 6.42 billion RMB invested to WISCO by the state.
WISCO started international trade business since 1980 and had a very sound foreign trade agency. After Wuhan Iron and Steel Group Corporation was found, by the approval of Ministry of Foreign Trade and Economic Cooperation, PRC, International Economic & Trading Corporation WISCO (IETC, WISCO) was established on Dec. 31, 1993. And our study was conducted within this department.
During the first 22 years WISCO was producing and selling exclusively in the domestic Chinese market and the company did not have any aims to go internationally. However, in 1980, through their government initiative, to obtain foreign currency from importing foreign technology and equipment, WISCO started direct and indirect exports to Europe, USA, Canada, and Australia and to Hong Kong, Korea and India. From 1993, overseas liaison offices and trade agencies were set up successfully in Germany, Japan, Hong Kong, USA, Canada, Australia, Korea and India. And today, WISCO plans to enter into African Iron and Steel Market.
This study is a second part of my PhD research project with which we reviewed literatures on International Market Selection Methods to find the international market selection methods best-suited to analyze African Iron and Steel Market for Wuhan Iron and Steel Corporation (WISCO)’s International Market Selection. After review of literatures, we found that quantitative firm level market estimation methods are the best-suited to our case study. Most of these studies are based on the following three-stage process of evaluating the export potential of foreign markets: a preliminary screening, an in-depth screening, and a final selection.
In our PhD thesis project, we adapted the firm level market estimation methods’ three-stage process of evaluating the export potential of foreign markets as follow: Modeling Africa’s Demand for Iron and Steel Importation [1] , which has already published at American Journal of Industrial and Business Management, 4, 799- 815, a preliminary screening and a final selection statistical scoring model.
But the main purpose of this paper is the preliminary screening and the final selection statistical scoring model. The preliminary screening will be made by ranking the panel data by political stability variable as it is the main decision criteria of WISCO’s international market selection into the African Iron and Steel Market, and for our final selection, we will build statistical scoring model of the explicative variables to allow us to rank African countries and to make a final selection by taking consideration of the influences of the four explicative variables on demand for Iron and Steel Importation from our previous study’s model. In the next section, the literature on international market selection methods will be discussed.
2. Literature Review
The literature on international market selection methods discussed in this study is the same as the literature already discussed in the first part of the study as they form one project but are subdivided into two papers.
Papadopoulos and Denis (1988, pp. 38-51) [2] summarized the literature on international market selection methods up until the late 1980s. They classified over 40 proposed international market selection models into two broad types of approaches: qualitative approaches (rigorous and systematic gathering and analysis of qualitative information about one or a handful of potential country markets) and quantitative approaches (analyzing large amounts of secondary statistical data about many or all foreign markets). In Figure 1, this categorization is illustrated.
The literature on international market selection methods will be discussed in this section under different categories (Figure 1).
2.1. Qualitative Approaches
According to Papadopoulos and Denis (1988, p. 39) [2] , most qualitative approaches typically start with identifying a short list of countries for further consideration by establishing objectives and constraints for exporting a specific product to each country under consideration. Other studies focus more on the nature, appropriateness and sources of qualitative information that could be used in the international market selection process. These sources include government agencies, chambers of commerce, banks, distributors, customers, international experts and foreign market visits (Pezeshkpur, 1979 [3] ). Papadopoulos and Denis (1988, p. 39) [2] suggest that pure qualitative approaches to international market selection could be seen as biased as they are based on perceptions and are largely inaccurate.
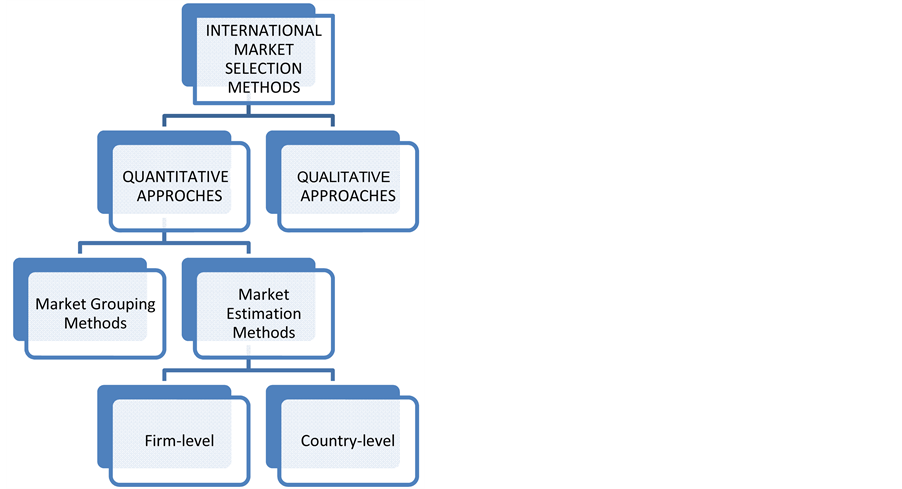
Figure 1. Categorization of the international market selection literature. Source: Own figure constructed from Papadopoulos and Denis (1988:38-51).
Douglas and Craig (1982, p. 27) [4] state that the biggest challenge in international market selection is the large number of countries throughout the world that need to be analyzed. They suggest that a screening procedure of secondary data is used to determine which countries to investigate in depth. Quantitative approaches to international market selection do exactly this by analyzing and comparing secondary data of a large number of countries and will be discussed subsequently.
2.2. Quantitative Approaches
Papadopoulos and Denis (1988, p. 39) [2] further divided quantitative approaches into two categories, namely market grouping methods and market estimation methods. Market grouping methods cluster countries on the basis of similarity while market estimation models evaluate market potential on firm or country level (see Figure 1).
2.2.1. Market Grouping Methods
Studies undertaken to attempt market grouping have been summarized by several authors such Papadopoulos and Denis (1988, pp. 39-41) [2] , Steenkamp and Ter Hofstede (2002, pp. 185-213) [5] and Shankarmahesh et al. (2005, pp. 204-206) [6] . These methods are based on the assumption that the most attractive markets for a firm are the ones the most closely resemble to the markets that it has already penetrated successfully (Papadopoulos and Denis, 1988, p. 41 [2] ). By providing insights into structural similarities, these methods enable firms to standardize their offerings and marketing strategies across markets (Sakarya et al., 2007, p. 213 [7] ). Countries are clustered based on similarities in social, economic and political indicators while demand levels are, for the most part, not taken into account (Sakarya et al., 2007, p. 212 [7] ). Market grouping methods are mostly criticized for relying exclusively on general country indicators, rather than on product-specific market indicators, as macro indicators may not reflect market development for a product (Sakarya et al., 2007, p. 212 [7] ; Kumar et al., 1994, p. 31 [8] ; Papadopoulos and Denis, 1988, p. 41 [2] ). Studies that attempted to include more product- specific information face the problem of insufficient data, and are limited to the product ranges of a particular firm. Thus, they cannot be applied to all possible product groups (Papadopoulos and Denis, 1988, pp. 41, 47 [2] ). Sakarya et al. (2007, p. 212) [7] also argued that grouping methods failed to take into account similarities among groups of consumers across national boundaries. Furthermore, focusing only on countries with similar characteristics to markets already penetrated may hold the risk of overlooking lucrative opportunities in countries with other characteristics (Kumar et al., 1994, p. 32 [8] ).
Referring to the abovementioned limitations, market-grouping methods will not be suitable to identify export opportunities for a country if the trade promotion organization or researcher needs to consider all possible country-product combinations worldwide.
Market estimation methods will therefore be subsequently investigated in order to find the international market selection method best suited to the identification of potential export opportunities.
2.2.2. Market Estimation Methods
Market estimation models evaluate foreign markets on the basis of several criteria that measure aggregate market potential and attractiveness (Sakarya et al., 2007, p. 212 [8] ; Papadopoulos and Denis, 1988, p. 41 [2] ). The criteria vary across methods and often include wealth, size, growth, competition and access indicators (Sakarya et al., 2007, p. 212 [7] ). Papadopoulos and Denis (1988, pp. 40-47) summarized the different methods of measuring market potential were introduced up until the late 1980s and included multiple factor indices, regression analyses and multiple criteria import demand estimations. Papadopoulos and Denis (1988, pp. 40-47) [2] found that common shortcomings of these methods included the lack of product specificity, the assumption of a static environment and methodological problems due to data availability.
Henceforth, the more recent literature on market estimation methods will be discussed in detail. Most of these methods are based on, and address, the methodological shortcomings of earlier studies (see Papadopoulos and Denis (1988, pp. 40-47) [2] for a discussion of these earlier studies).
For the purposes of this study, the literature on market estimation methods will be categorized into firm-level and country-level methods (see Figure 1). Firm-level methods can be applied by firms to identify markets for their limited product ranges. These methods usually include an analysis of the firm’s objectives, profitability, managerial experience and knowledge, customer standards and attitudes and product adaptation requirements when identifying potential export markets. Country-level methods, on the other hand, can be applied by a country’s export promotion agency to identify the most promising country-product combinations to focus their export promotion efforts on. Criteria and data used in these methods should be product-specific, applicable to many country-product combinations and generally available. These criteria might include product-specific market growth, market size, level of competition and barriers to trade.
・ Firm-level market estimation methods
Firm-level market estimation methods are applied by firms to identify markets for their limited product ranges. These methods usually include an analysis of the firm’s objectives, profitability, managers’ experience and knowledge, customer standards and attitudes and product adaptation requirements when identifying potential export markets. Apart from the older studies summarized by Papadopoulos and Denis (1988, pp. 40-47) [2] , firm-level market estimation methods include the studies of Ayal and Zif (1978) [9] , Davidson (1983) [10] , Cavusgil (1985) [11] , Kumar et al. (1993) [8] , Hoffman (1997) [12] , Andersen and Strandskov (1998) [13] , Brewer (2000) [14] , Andersen and Buvik (2002) [15] , Rahman (2003) [16] , Alon (2004) [17] , Ozorhon, Dikmen and Birgonul (2006) [18] and more.
Most of these studies are based on the following three-stage process of evaluating the export potential of foreign markets:
1) a preliminary screening to select more attractive countries to investigate in detail, based on countries’ demographic, political, economic and social environment;
2) an in-depth screening in which these products’ potential (market size and growth), competitors, market access and other market factors for the countries selected in stage one are analyzed; and
3) a final selection that involves the analysis of company sales potential, profitability and possible product adaptation.
・ Country-level market estimation methods
Apart from the Decision Support Model (Viviers & Pearson (2007) [19] , Viviers, Rossouw & Steenkamp (2009) [20] , Viviers, Steenkamp & Rossouw (2010) [21] ), nine other studies can be found that can be classified as country-level market selection methods. The main criterion for a market selection method to be classified into this category is that it should be capable of screening a wide range of product-country combinations to select export markets with realistic potential for a specific exporting country.
The methods that, on first review, seemed to comply with this criterion include:
ü the shift-share model of Green and Allaway (1985) [22] ;
ü the global screening model of Russow and Okoroafo (1996) [23] ;
ü the trade-off model of Papadopoulos, Chen and Thomans (2002) [24] ;
ü the multiple criteria method of the International Trade Centre (ITC) (Freudenberg and Paulmier, 2005 [25] , 2005 [26] , Freudenberg, Paulmier, Biji and Ikezuki, 2007 [27] , Freudenberg, Paulmier, Ikezuki and Conte 2008 [28] );
ü the assessments of export opportunities in emerging markets by Cavusgil (1997, pp. 87-91) [29] , Arnold and Quelsh (1998, pp. 7-20) [30] and Sakarya et al. (2007, pp. 208-238) [7] ;
ü the gravity model and the trade opportunity matrix (TOM) of Export Development Canada (Verno, 2008 [31] ).
2.3. Summary of Literature Review
Papadopoulos and Denis (1988, pp. 38-51) [2] summarized the literature on international market selection methods up until the late 1980s. They classified over 40 proposed international market selection models into two broad types of approaches-qualitative approaches (rigorous and systematic gathering and analysis of qualitative information about one or a handful of potential country markets) and quantitative approaches (analyzing large amounts of secondary statistical data about many or all foreign markets). This study can be classified as quantitative approach.
The literature on market estimation methods were categorized into firm-level and country-level methods (see Figure 1). Firm-level methods can be applied by firms to identify markets for their limited product ranges. Country-level methods, on the other hand, can be applied by a country’s export promotion agency to identify the most promising country-product combinations to focus their export promotion efforts on. Our study can be classified in firm-level market estimation methods, as the purpose of this study is to find the international market selection method best-suited to analyze African Iron and Steel Market for WISCO’s International Market Selection.
We adapted the firm-level market estimation methods’ three-stage processes of evaluating the export potential of foreign markets as follow: Modeling Africa’s Demand for Steel Importation [1] , a preliminary screening and a final selection statistical scoring model. But the main purpose of this paper is the preliminary screening and the final selection statistical scoring model.
3. Analyzing Africa’s Iron and Steel Market of Wuhan Iron and Steel Corporation WISCO’s Possible Entry into Africa Iron and Steel Market
3.1. Definitions and Concepts
Gross domestic product or GDP is the total value of goods and services produced, and will no longer enter into any production process, for a country for a given period, and generally for one year period. It is used to measure the economic growth of a country. It is measured by giving a monetary value to each item produced by a country; then sum up the monetary value, and we get the value of GDP. GDP per capita is the ratio between the value of total GDP and the number of the average population of a year.
Public investments are part of the economic aggregate like public expenditure, investments considered part of a “non-market” products (roads, justice, police, public lighting, public education and research, national defense, etc.), and secondly by the grant of a portion of the accumulation of technological business capital, whether public or private.
Here we will look to public infrastructure investments. To measure these, we will be interested in GFCF- Gross Fixed Capital Formation, which also includes the accumulation of productive capital by businesses and housing purchases by households and acquisitions of public facilities by a country.
GFCF is a key variable in the economy of a country. The more it represents a significant share of GDP (Gross Domestic Product), the more the pace of economic growth in the country is higher.
Real effective exchange rate―REER is the weighted average of a country’s currency relative to an index or basket of other major currencies adjusted for the effects of inflation. The weights are determined by comparing the relative trade balances, in terms of one country’s currency, with each other country within the index.
Urban population refers to people who live in urban areas as defined by the National Institute of Statistics.
Political stability: The simplest definition of a stable political system is one that survives through crises without internal warfare.
3.2. Data
In this study, the data used are the same as previous study [1] . The data used are observations of macroeconomic variables, such as GDP per capita, the index of consumer prices, import iron, the real effective exchange rate, the number of urban population, imports and exports total made on 19 African countries. The concerned countries are: Algeria, Burkina Faso, Ivory Coast, Egypt, Madagascar, Malawi, Mali, Mauritius, Morocco, Mozambique, Niger, Nigeria, Senegal, Seychelles, South Africa, Tanzania, Togo, Tunisia, and Zambia.
Trade considered are those made with its major trading partners, including China, France, Germany, Italy, Spain, the United Kingdom and then the United States. These observations were made over a period of 5 years from 2008 to 2012. These countries were chosen because of their large share of imports and exports of iron and steel compared to all African countries but also by the availability of statistical data in the competent institutions.
Data for iron and steel importation and exportation of these countries were drawn from the database of the UN Comtrade.
GDP per capita, total imports and exports, investment in infrastructure, the index of domestic consumer prices, the number of urban population and the exchange rate were drawn from the database of the WDI “World Development Indicators” of the World Bank, December 18, 2013.
The real effective exchange rate was calculated from the domestic and foreign price Indexes, the multilateral nominal exchange rate is calculated using exchange rates provided by the WDI (World Development Indicators), and the imports and exports with partners of the considered African countries provided by the UN Comtrade (see Appendix 8 for the formula).
GDP per capita, imports, exports, infrastructure investments are expressed in current US dollars. Exchange rates are quoted on the uncertain relative to the US dollar.
The index of foreign consumer price is calculated from the price index of domestic partners of Africa and the weights are their shares of trade with Africa composite index (see Appendix 8 for the formula).
Political stability data is provided by the WDI (World Development Indicators) of the World Bank, December 18, 2013 (Update 2014).
3.3. Methodology
The empirical study in this paper is divided into two parts: the first part is preliminary screening and the second part is the final selection statistical scoring model.
In the first part, the preliminary screening will be made by ranking the panel data by political stability variable as it is the main decision criteria of WISCO’s international market selection into the African Iron and Steel Market. We will rank the 19 African countries by political stability and we will select ten countries that will be considered for the second part of this study.
The second part is the final selection statistical scoring model. Our statistical scoring model is made by three steps.
3.3.1. First Step
For the ten countries we will be selected from the preliminary screening, we will calculate the statistical inverse of the coefficient of variation  of all the variables for a period of 5 years from 2008 to 2012. We will estimate the demand side by the four explanatory variables used (GDP per capita, investment in infrastructure, real effective exchange rate, and the number of urban population) in the previous study model; and the potential of market supply will be estimated by the iron and steel total export variable.
For every variable, we calculate the inverse coefficient of variation :
:


Our objective of using inverse coefficient of variation instead of its statistical coefficient of variation is that in this statistical model, we are looking to select countries that have the highest value of simple arithmetic mean with a minimum standard deviation value in all variables.
3.3.2. Second Step
We will calculate the Index I to estimate the Africa’s demand for Iron and Steel Importation by taking account of the influence of the four variables of the model we have built in the previous study.
The result of our previous study concluded that the Africa’s Importations of Iron and Steel are positively correlated with all the independent variables of the model. All estimated coefficients are positive and significant at 1% level of significance (Figure 2) [1] .
This result means that: every 10% increase in GDP per capita (lgdpcap = 0.996) is strictly impacted at the same magnitude on the importations of iron and steel in African countries; every 10% increase in the real effective exchange rate REER (ltcer) leads to an increase in the importations of iron and steel in the range of 2.44%, this elasticity is estimated at 0.244. It has positive impact in long term but negative in short term. A variation to the rise in infrastructure investment (linv = 0.16) of 10% positively influences the rise of iron and steel importations about 1.65%―the estimated value of this elasticity being 0.1645; and an increase of 10% of the urban population (lurbpop = 0.8) leads to an increase of 8.12% of iron and steel importations.
In our calculation of I, the above effect of the four variables of the model into Africa’s Iron and Steel demand
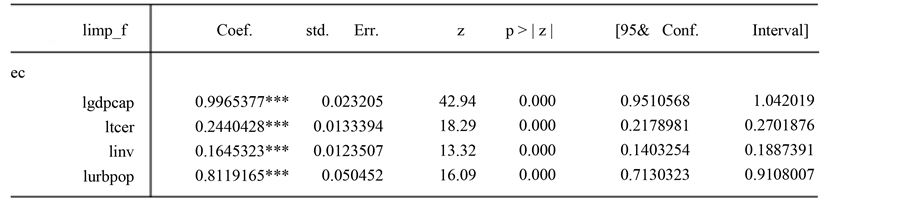
Figure 2. Estimate of the long-term relationship. Note: ***1% level of significance.
will be measured by using weighting. Weighting is an allowance or adjustment made in order to take account of special circumstances or compensate for a distorting factor. We will weight by 4 times the inverse coefficient of variation of the GDP per capita variable as an increase of 10% of this variable has 10% impact on the importations of iron and steel in African countries, and by 3 times the inverse coefficient of variation of the urban population variable as an increase of 10% of this variable has 8% increase on the importations of iron and steel in African countries; and then we will divide by 7 as the total of weighting must be equal to 1. We will not weight the variables real effective exchange rate REER and in infrastructure investment because an increase of 10% of these variables have only almost the same value of 2% change on the importations of iron and steel in African countries. REER will has negative effect as the period of our analysis is 5 years which can be considered as short term.
Thus, the formula of calculation of I is as below:


3.3.3. Third Step
We will calculate the final score . The demand side as we said above is estimated by the Index I of the four variables of the model, and the potential supply of the market will be estimated by the total export of iron and steel. Our first attempt was to estimate the potential supply of the market by iron and steel production but the problem was that only 4 out 19 of our studied countries have iron and steel production data (Algeria, Egypt, Morocco and South Africa) because only these 4 countries have iron and steel making mills; thus for our study, estimating the potential supply by iron and steel exportation will be better suited for African countries.
The final score  will be calculated with the formula below:


We will order all selected countries from the preliminary screening according to their final score  from the larger to the smaller, those countries which have higher score will be chosen, and then we will recommend the first five ranked countries.
4. Empirical Findings
The empirical study in this paper is divided into two parts: the first part is preliminary screening and the second part is the final selection statistical scoring model.
4.1. Preliminary Screening by Political Stability
During our long term relationship modeling process of demand, we tried to collect quantified data for the 3 factors (economic factors, political and legal factors and market attractiveness), but for the political and legal factors, we didn’t find any quantified accurate data. The only data we found for these factors is political stability and absence of violence/terrorism percentile ranking from the World Bank’s Worldwide Governance Indicators (WGI). So we remove these factors from our model.
But through the analysis of our interviews and discussions with WISCO, we found that political stability is very important on account of it is the main decision criteria of WISCO’s international market selection entering to African Market, thus we decide to carry on an analysis of this variable and set it as the variable criteria for the preliminary screening as it is the main decision criteria for WISCO.
In terms of attractiveness, there are three sets of factors that affect the overall level of investment flows entering into a country. These are the factors of availability of funding resources (variation in bank credit to the private sector, external debt, foreign private capital etc.), internal or external risk factors and finally cyclical factors representing the behavior of the economy.
The analysis of the attitude of the classical rational investor toward risk makes the following distinctions: the individual may be risquophile (People who love risk), neutral towards risk (regardless of the risk involved in the compensation required by the investment) or risk-averse (the individual is willing to take a risk, but she/he wants to be paid by a risk premium) (Alexander, 2000 [32] ). It is this latter type of investor that we have here, as WISCO does not reject the risk; it knows that there is socio-political instability’s possible impact on its business, but it wants to be aware and demand adequate compensation.
In the literature, the political instability that generates the risk for business and investment covers a wide variety of events such as political murders, coups d’état, revolutions or wars. All engender insecurity hampering investment prospects which require over a long period to amortize (OECD, 2004 [33] ). Fosu (1992) [34] defines political instability as the change of political power through violence and also any changes that do not respect the legal forms. However, Hudson (1972) [35] and Gupta (1991) [36] present three forms of socio-political instability: instability of elites or government executives including, coups d’état, changes and government crises; mass instability corresponds to social movements such as strikes, manifestations or riots; and finally, military or violent instability that takes into account the civil war and the guerrillas, and any violent political action.
For this analysis, we use Political Stability and Absence of Violence/Terrorism data of the Worldwide Governance Indicators (WGI), 2014 Update. WGI’s Political Stability and Absence of Violence/Terrorism measures perceptions of the likelihood of political instability and/or politically-motivated violence, including terrorism. We sort our 19 Africa’s countries of our study by Political Stability and Absence of Violence/Terrorism percentile value 2013 from the largest to smallest and select the first 10th rank, Table 1 shows the results.
The 10 countries that are selected to the next step of our study from our preliminary screening are: Mauritius, Seychelles, Zambia, South Africa, Senegal, Tanzania, Malawi, Mozambique, Togo and Morocco.
9 out of 19 countries of our study will be eliminated, those countries are: Madagascar, Burkina Faso, Tunisia, Ivory Coast, Egypt, Algeria, Niger, Nigeria and Mali. Those countries had very bad score in the Worldwide Governance Indicator’s (WGI) Political Stability and Absence of Violence/Terrorism 2013. As shown in Table 1: Madagascar ranked the eleventh with Political Stability and Absence of Violence/Terrorism score of 18.96%, Burkina Faso ranked the twelfth with a score of 21.80%, Tunisia ranked the thirteenth with a score of 21.80%, Ivory Coast ranked the fourteen with a score of 17.06%, Egypt ranked fifteenth with a score of 13.11%, Algeria ranked sixteenth with a score of 12.80%, Niger ranked seventeenth with a score of 9.95%, Nigeria ranked eighteenth with a score of 7.79%, and finally, Mali ranked nineteenth with a score of 6.64%.
Political instability as the change of political power through violence and changes that do not respect the legal forms such as political murders, coups d’état, revolutions or wars have affected those nine countries.
In the next section, we will focus our analysis to the 10 countries that are selected from our preliminary screening.
4.2. Analysis of the Final Selection Statistical Scoring Model
In this section, we analyze Africa’s Iron and Steel Market following the steps of our final selection statistical inverse coefficient of variation scoring model. We start by analyzing statistical inverse coefficient of variation of the variables in the demand side and in supply side, thereafter we analyze the final score made by every country, and then suggest a final selection.
As our 4 variables for the previous study’s demand model, which are: GDP per capita, Population urban rate,

Table 1. WGI political stability and absence of violence/terrorism percentile in 2013.
Infrastructure Investment, and the Real Effective Exchange Rate, distributions of values scales of measurement are not comparable, then we have to use coefficient of variation. In probability theory and statistics, the coefficient of variation (CV) is a standardized measure of dispersion of a probability distribution or frequency distribution. The coefficient of variation (CV) is the ratio of the standard deviation to the mean. The higher the coefficient of variation, the greater the level of dispersion around the mean. It is generally expressed in percentage. Without units, it allows for comparison between distributions of values whose scales of measurement are not comparable. Coefficient of variation is useful when interest is in the size of variation of dispersion relative to the size of the observation, and it has the advantage that the coefficient of variation is independent of the units of observation. But our interest in our final selection statistical scoring model is not only is in the size of variation of dispersion relative to the size of the observation, but also in the size of the mean of the observation. That means that we are interested in observations that have bigger value of mean and with lower level of dispersion around the mean. So, we use inverse coefficient of variation.
4.2.1. Analysis of the Demand Side
In the demand side, we analyze the statistical inverse coefficient of variation of the 4 variables of our previous study, which are: GDP per capita, Population urban rate, Infrastructure Investment, and the Real Effective Exchange Rate, and then, we calculate the Index I.
1) Analysis of the GDP per capita’s statistical inverse coefficient of variation
The result of the calculation of the inverse coefficient of variation of the GDP per capita is summarized in the Table 2 below. Detailed table is illustrated in the Appendix 1.
Through the results of the inverse coefficient of variation of GDP per capita of the ten studied countries, they are ranked as respectively: Morocco, Senegal, Togo, Tanzania, Mauritius, Seychelles, Malawi, Zambia, South Africa, and Mozambique; but when we look at the simple arithmetic mean, the rank is as follow: Seychelles, Mauritius, South Africa, Morocco, Zambia, Senegal, Togo, Tanzania, Mozambique and Malawi (Table 3).
Table 2. 2008-2012 GDP per capita inverse coefficient of variation rank by country.
Table 3. GDP per capita average mean 2008-2012.
Seychelles, Mauritius and South Africa have better higher level of GDP per capita than Morocco, Senegal and Togo. Our result comes from the standard level of dispersion of the observation; Seychelles, Mauritius and South Africa have higher average of GDP per capita than Morocco, Senegal and Togo but have also a higher level of dispersion of the observation around their means (Appendix 1).
Our analysis of the inverse coefficient of variation of the variable DGP per capita can be concluded that the five countries that would be suggested to Wuhan Iron and Steel Corporation (WISCO) are: first, Morocco with inverse coefficient of variation of 31.74, second, Senegal with inverse coefficient of variation of 24.62, third, Togo with inverse coefficient of variation of 16.69, fourth, Tanzania with inverse coefficient of variation of 12.35, and fifth, Mauritius with inverse coefficient of variation of 12.48 (Table 2).
2) Analysis of the population urban rate’s statistical inverse coefficient of variation
The result of the calculation of the inverse coefficient of variation of the population urban rate 2008-2012 is summarized in the Table 4 below. Detailed table of the calculation is illustrated in the Appendix 2.
Through the results of the inverse coefficient of variation of urban population’s rate of the ten studied countries, they are ranked respectively as: Togo, Tanzania, Mozambique, Malawi, Zambia, Senegal, South Africa, Morocco, Mauritius and Seychelles; but when we look at the simple arithmetic mean, the rank is as follow: Tanzania, Zambia, Togo, Malawi, Senegal, Mozambique, South Africa, Morocco, Seychelles, and Mauritius (Table 5).
Togo come first with inverse coefficient of variation of 304.50 has simple arithmetic mean of 3.87, lower than
Table 4. 2008-2012 population urban rate’s statistical inverse coefficient of variation.
Table 5. 2008-2012 population urban rate arithmetic mean by country.
the arithmetic mean of the population urban rate of Tanzania (4.67) and Zambia (4.12), but Togo has lower level of dispersion around his mean than those two countries. The same event for Mozambique, with arithmetic mean of 3.27, lower than Zambia (4.12), Malawi (3.74), and Senegal (3.46); it come in third place with inverse coefficient of variation of 51.12 because of it lower level of dispersion around the observation’s mean (see Appendix 2).
Our analysis of the inverse coefficient of variation of the variable population urban rate can be concluded that the five countries that would be suggested to Wuhan Iron and Steel Corporation (WISCO) are: first, Togo with inverse coefficient of variation of 304.50, second, Tanzania with inverse coefficient of variation of 63.49, third, Mozambique with inverse coefficient of variation of 51.12, fourth, Malawi with inverse coefficient of variation of 35.21, and fifth, Zambia with inverse coefficient of variation of 31.36 (Table 4).
3) Analysis of the Infrastructure investment’s statistical inverse coefficient of variation
The result of the calculation of the inverse coefficient of variation of Infrastructure Investment 2008-2012 is summarized in the Table 6 below. For the detailed table of the calculation, please see the Appendix 3.
Through the results of the inverse coefficient of variation of infrastructure investment of the ten studied countries, they are ranked respectively as: Morocco, Mauritius, Senegal, South Africa, Malawi, Togo, Seychelles, Tanzania, Zambia, and Mozambique; but when we look at the simple arithmetic mean, the rank is as follow: South Africa, Morocco, Tanzania, Mozambique, Senegal, Zambia, Mauritius, Malawi, Togo, Seychelles (Table 7).
Table 6. 2008-2012 infrastructure investment’s inverse coefficient of variation by country.
Table 7. 2008-20012 infrastructure investment’s arithmetic mean by country.
Morocco has an average infrastructure investment less than South Africa but has also lesser level of dispersion of it observation around the average of infrastructure investment. Mauritius also .has an average infrastructure investment less than South Africa, Tanzania, Mozambique, Senegal, and Zambia, but has also lesser than South Africa, Tanzania, Mozambique, Senegal, and Zambia in level of dispersion of it observation around the average of infrastructure investment. The same fact also for Senegal which has lesser average infrastructure investment than Tanzania and Mozambique; and for Malawi which has lesser arithmetic mean of infrastructure investment than Tanzania, Mozambique, and Zambia. Tanzania, Mozambique and Zambia have higher average infrastructure Investment than done in Mauritius, Senegal and Malawi; but because of their higher level of dispersion of their observations around the mean, those countries rank behind Mauritius, Senegal and Malawi in term of inverse coefficient of variation (Appendix 3).
Our analysis of the inverse coefficient of variation of the variable infrastructure investment can be concluded that the five countries that would be suggested to Wuhan Iron and Steel Corporation (WISCO) are: first, Morocco with inverse coefficient of variation of 22.24, second, Mauritius with inverse coefficient of variation of 16.65, third, Senegal with inverse coefficient of variation of 10.92, fourth, South Africa with inverse coefficient of variation of 7.32, and fifth, Malawi with inverse coefficient of variation of 4.59 (Table 6).
4) Analysis of the real effective exchange rate statistical inverse coefficient of variation
When analyzing and interpreting the result of real effective exchange rate, we have to take care of it influence in the demand model, as in our Africa’s Iron and Steel demand model of our previous study, the real effective exchange rate has positive effect in long term but negative effect in short term. Our period of study here in this analysis is from 2008 to 2012, a period of 5 years, which can be interpreted as short term. Thus, we analyze and interpret the real effective exchange rate with its short term negative effect; we are interested with observations that have lower value of arithmetic mean with lower level of dispersion around the mean.
The result of the calculation of the inverse coefficient of variation of Infrastructure Investment 2008-2012 is summarized in the Table 8 below. For the detailed table of the calculation, please see the Appendix 4.
Through the results of the inverse coefficient of variation of the real effective exchange of the ten studied countries, they are ranked respectively as: South Africa, Zambia, Malawi, Mozambique, Seychelles, Tanzania, Mauritius, Senegal, Togo, and Morocco; but when we look at the simple arithmetic mean, the rank is as follow: Morocco, Mauritius, Senegal, Malawi, Mozambique, South Africa, Tanzania, Togo, Seychelles, and Zambia (Table 9).
South Africa come first in term of inverse coefficient of variation, it has a higher value of average real effective exchange rate during our 5 years period of study than Morocco, Mauritius, Senegal, Malawi, Mozambique; but the result could be explain by it lower level of variation during the period than those countries. Zambia comes second in term of inverse coefficient of variation of the real effective exchange rate but it ranked last in the higher value of average exchange rate. This result also can be interpreted as because of Zambia lower level
Table 8. 2008-2012 real effective exchange rates’ inverse coefficient of variation by country.
Table 9. 2008-2012 arithmetic mean of real effective exchange rate by country.
of variation during the period. Morocco, Mauritius, Senegal have lower value of average real effective exchange rate but ranked behind the other countries because of their higher level of variation during the period (see Appendix 4).
Our analysis of the inverse coefficient of variation of the variable real effective exchange rate can be concluded that the five countries that would be suggested to Wuhan Iron and Steel Corporation (WISCO) are: first, South Africa with inverse coefficient of variation of 4.09, second, Zambia with inverse coefficient of variation of 4.33, third, Malawi with inverse coefficient of variation of 5.17, fourth, Mozambique with inverse coefficient of variation of 6.43, and fifth, Seychelles with inverse coefficient of variation of 8.10 (Table 6).
5) Analysis of the Index I
Our objective of analyzing the index I is to put together all our four variables of our Africa’s demand model for Iron and Steel importation, and to show every variable’s influence in Africa’s demand for Iron and Steel importation Steel according to the result of our previous study’s model.
The result of the calculation of the index I is summarized in the Table 10 below. For the detailed table of the calculation, please see the Appendix 5.
Looking on the result of the index I, the rank of the ten countries of our study is respectively from first to tenth: Togo, Tanzania, Mozambique, Senegal, Morocco, Malawi, Zambia, South of Africa, Mauritius, and Seychelles. This result can be explained by effect of the weighting of the variable GDP per Capita by 4 times and the variable population urban rate by 3 times, reflecting the influence of those two variables in the African Iron and Steel importation in our demand model. Togo, Tanzania, Mozambique, Senegal and Morocco perform better scores in those two variables.
Our analysis of the index I which summarize the analysis of the demand side can be concluded that the five countries that would be suggested to Wuhan Iron and Steel Corporation (WISCO) are: first, Togo with index I score of 138.47, second, Tanzania with index I score of 33.65, third, Mozambique with index I score of 24.77, fourth, Senegal with index I score of 24.39, and fifth, Morocco with index I score of 22.62 (Table 10).
4.2.2. Analysis of the Supply Side
As we said above in the paragraph of the methodology, the potential supply of the market is estimated by the total export of Iron and Steel in this study. Our first attempt was to estimate the supply potential of the market by Iron and Steel production but the problem was that only 4 out of 19 of the African countries of our study have Iron and Steel production data at the World Steel Association and other databases, which are: Algeria, Egypt, Morocco and South Africa, because only these 4 countries have Iron and Steel making Mills; thus for our study, estimating the potential supply by Iron and Steel Exportation will be better suited for African countries.
The result of the calculation of the inverse coefficient of variation of Iron and Steel Exportation 2008-2012 is summarized in the Table 11 below. For the detailed table of the calculation, please see the Appendix 6.
When looking at the result of the Iron and Steel total exportation’s inverse coefficient of variation of the ten countries of our study, rank is as respectively: Morocco, South Africa, Senegal, Seychelles, Tanzania, Malawi,
Table 10. Summary of every country demand side score by Index I.
Table 11. 2008-2012 iron and steel total exportation by country.
Mozambique, Mauritius, Zambia, and Togo; but when we look at the simple arithmetic mean, the rank is as follow: South Africa, Morocco, Senegal, Togo, Tanzania, Mauritius, Mozambique, Zambia, Seychelles and Malawi (Table 12).
Morocco has higher score of inverse coefficient of variation than South Africa, but has lower total exportation average than South Africa, because Morocco has lower level of variation of total exportation around its mean during the period of observation 2008-2012. Seychelles has lower average of total exportation than Togo, Tanzania, Mauritius, Mozambique, and Zambia, but scored higher in term of inverse coefficient of variation higher than those countries, this fact also can be explained by lower level of variation during the period of observation. The same fact also for Malawi and Mozambique whose scored higher than Mauritius in term of inverse coefficient of variation, but have average Iron and Steel total export lower that Mauritius.
Our analysis of the supply side can be concluded that the five countries that would be suggested to Wuhan Iron and Steel Corporation (WISCO) are: first, Morocco with inverse coefficient of variation of iron and steel total export score of 8.54, second, South Africa with inverse coefficient of variation of iron and steel total export score of 4.86, third, Senegal with inverse coefficient of variation of iron and steel total export score of 4.73, fourth, Seychelles with inverse coefficient of variation of iron and steel total export score of 4.64, and fifth, Tanzania with inverse coefficient of variation of iron and steel total export score of 3.62 (Table 11).
4.2.3. Analysis of the Final Score
We sum up the score made by every country in the demand side and in the supply side, with an equal weight of 0.50, and then we get the final score, for the formula please refers to the methodology.
The result of the calculation of the final score Sp is summarized in the Table 13 below. For the detailed table of the calculation, please see the Appendix 7.
Looking on the result of the final score Sp, the rank of the ten countries of our study is respectively from first to tenth: Togo, Tanzania, Morocco, Senegal, Mozambique, Malawi, Zambia, South of Africa, Mauritius and Seychelles. This final score rank result is very similar to the rank of the demand side result which is respectively from the first to tenth as follow: Togo, Tanzania, Mozambique, Senegal, Morocco, Malawi, Zambia, South of Africa, Mauritius, and Seychelles. This final score rank can be explain by the higher score made by those countries in the demand side. But, when looking on the supply side, rank is as respectively: Morocco, South Africa, Senegal, Seychelles, Tanzania, Malawi, Mozambique, Mauritius, Zambia, and Togo. South Africa and Seychelles performed higher score and better rank in the supply side but the difference of their higher score in the supply side cannot offset their lower score in the demand side, even weighted the demand side and the supply side with an equal 0.50 weight.
Our analysis of the final score Sp can be concluded that the five countries that would be suggested to Wuhan Iron and Steel Corporation (WISCO) are: first, Togo with a final score of 70.20, second, Tanzania with a final score of 18.63, third, Morocco with a final score of 15.58, fourth, Senegal with a final score of 14.57, and fifth,
Table 12. 2008-2012 Iron and Steel total export arithmetic mean by country.
Table 13. Countries final score Sp ranked from the larger to smaller.
Mozambique with a final score of 13.68 (Table 13).
5. Conclusions
In this study, the data used are the same as previous study [1] , and observations of macroeconomic variables, such as GDP per capita, the index of consumer prices, import iron, the real effective exchange rate, the number of urban population, imports and exports total made on 19 African countries. The countries concerned are: Algeria, Burkina Faso, Ivory Coast, Egypt, Madagascar, Malawi, Mali, Mauritius, Morocco, Mozambique, Niger, Nigeria, Senegal, Seychelles, South Africa, Tanzania, Togo, Tunisia, and Zambia.
The empirical study in this paper is divided into two parts: the first part is preliminary screening and the second part is the final selection statistical scoring model.
In the first part, the preliminary screening was made by ranking the panel data by political stability variable as it was the main decision criteria of WISCO’s international market selection into the African Iron and Steel Market. We used political stability and absence of violence/terrorism data of the Worldwide Governance Indicators (WGI), 2014 Update. WGI’s political stability and absence of violence/terrorism measured perceptions of the likelihood of political instability and/or politically-motivated violence, including terrorism. We sorted our 19 Africa countries of our study by political stability and absence of violence/terrorism percentile value 2013 from the largest to smallest and selected the first 10th rank. The 10 countries that were selected to the next step of our study from our preliminary screening were: Mauritius, Seychelles, Zambia, South Africa, Senegal, Tanzania, Malawi, Mozambique, Togo and Morocco.
In the second part of the empirical findings, we analyzed African Iron and Steel Market following the steps of our final selection statistical inverse coefficient of variation scoring model. We started by analyzing statistical inverse coefficient of variation of every variable in the demand side and in supply side, then we analyzed the final score made by every country, and suggested a final selection.
In the demand side, we analyzed the statistical inverse coefficient of variation of the 4 variables of our previous study, which were: GDP per capita, Population urban rate, Infrastructure Investment, and the Real Effective Exchange Rate, and then, we calculated the Index I. Our analysis of the index I which summarize the analysis of the demand side can be concluded that the five countries that would be suggested to Wuhan Iron and Steel Corporation (WISCO) are: first, Togo with index I score of 138.47, second, Tanzania with index I score of 33.65, third, Mozambique with index I score of 24.77, fourth, Senegal with index I score of 24.39, and fifth, Morocco with index I score of 22.62.
The potential supply of the market was estimated by the total export of iron and steel in this study. Our analysis of the supply side can be concluded that the five countries that would be suggested to Wuhan Iron and Steel Corporation (WISCO) are: first, Morocco with inverse coefficient of variation of iron and steel total export score of 8.54, second, South Africa with inverse coefficient of variation of iron and steel total export score of 4.86, third, Senegal with inverse coefficient of variation of iron and steel total export score of 4.73, fourth, Seychelles with inverse coefficient of variation of iron and steel total export score of 4.64, and fifth, Tanzania with inverse coefficient of variation of iron and steel total export score of 3.62.
And finally, we summed up the score made by every country in the demand side and in the supply side, with an equal weight of 0.50, and then we got the final score. Our analysis of the final score Sp can be concluded that the five countries that would be suggested to Wuhan Iron and Steel Corporation (WISCO) are: first, Togo with a final score of 70.20, second, Tanzania with a final score of 18.63, third, Morocco with a final score of 15.58, fourth, Senegal with a final score of 14.57, and fifth, Mozambique with a final score of 13.68. WISCO then can choose from these five suggested countries to enter into Africa’s Market.
Our experience from the analysis of Africa’s Iron and Steel market can teach us that:
ü It is very important for every African country to maintain political stability to make a country more attractive for investment flows. As for this study, WISCO set political stability as decision criteria, 9 out of 19 countries of our study are eliminated from preliminary screening because of higher political instability; though some of those countries have a very good iron and steel potential, like: Nigeria, Algeria and Egypt.
ü It is also very important to every country to maintain a more stable variation of every macroeconomic variable to make a country more attractive for investment flows.
ü Our analysis using statistical inverse coefficient of variation scoring model allowed us to better appreciate how good the value of the arithmetic mean is, and in the same time how good the level of variation of every African macroeconomic variable is.
Acknowledgements
I would like to express my special thanks to Professor Yan Liang, Dean of School of Economics and Management for his expertise and professional supervision. I would also like to express all my gratitude to the International Education College, China University of Geosciences (Wuhan) and thanks to Madagascar community, for their support to all Madagascar students. I also express my special thanks to the government of China and the government of Madagascar for their financial support, to the International Trade and Economics Department of Wuhan Iron and Steel Corporation (WISCO) for heir high collaboration and contributions during this research. I also express my special thanks to Rivomanantsoa John Georgio and my cousin Ravelomanana Bernet Chasson for their expertise reviews of the validity of these models. And finally, I also express my gratitude to my fiancé Miariso Leoncine Paul, my brother Mahazomanana Christophe, and all my family members in Madagascar for their support.
References
- Ravelomanana, F., Yan, L., Mahazomanana, C. and Miarisoa, L.P. (2014) Modeling Africa’s Demand for Iron and Steel Importation: An International Market Estimation Method Perspective. American Journal of Industrial and Business Management, 4, 799-815. http://dx.doi.org/10.4236/ajibm.2014.412086
- Papadopoulos, N. and Denis, J.E. (1988) Inventory, Taxonomy and Assessment of Methods for International Market Selection. International Marketing Review, 5, 38-51. http://dx.doi.org/10.1108/eb008357
- Pezeshkpur, C. (1979) Systematic Approach to Finding Export Opportunities. Harvard Business Review, 57, 182-196.
- Douglas, S.P. and Craig, C.S. (1992) Advances in International Marketing. International Journal of Research in Marketing, 9, 291-318. http://dx.doi.org/10.1016/0167-8116(92)90002-3
- Steenkamp, J.-B.E.M. and Ter Hofstede, F. (2002) International Market Segmentations: Issues and Perspectives. International Journal of Research in Marketing, 19, 185-213. http://dx.doi.org/10.1016/S0167-8116(02)00076-9
- Shankarmahesh, M.N., Olsen, H.W. and Honeycutt Jr., E.D. (2005) A Dominant Product-Dominant Country Framework of Industrial Export Segmentation. Industrial Marketing Management, 34, 203-210. http://dx.doi.org/10.1016/j.indmarman.2004.09.002
- Sakarya, S., Eckman, M. and Hyllegard, K.H. (2007) Market Selection for International Expansion: Assessing Opportunities in Emerging Markets. International Marketing Review, 24, 208-238. http://dx.doi.org/10.1108/02651330710741820
- Kumar, V., Stam, A. and Joachimsthaler, E.A. (1993) An Interactive Multi-Criteria Approach to Identifying Potential Foreign Markets. Journal of International Marketing, 2, 29-52.
- Ayal, I. and Zif, J. (1978) Competitive Market Choice Strategies in Multinational Marketing. Columbia Journal of World Business, 13, 72-81.
- Davidson, W.H. (1983) Market Similarity and Market Selection: Implications for International Marketing Strategy. Journal of Business Research, 11, 439-456. http://dx.doi.org/10.1016/0148-2963(83)90004-8
- Cavusgil, S.T. (1985) Guidelines for Export Market Research. Business Horizons, 28, 27-33. http://dx.doi.org/10.1016/0007-6813(85)90082-5
- Hoffman, J.J. (1997) A Two Stage Model for the Introduction of Products into International Markets. Journal of Global Marketing, 11, 65-86. http://dx.doi.org/10.1300/J042v11n01_05
- Andersen, P.H. and Strandskov, J. (1998) International Market Selection: A Cognitive Mapping Perspective. Journal of Global Marketing, 11, 65-84. http://dx.doi.org/10.1300/J042v11n03_05
- Brewer, P. (2000) International Market Selection: Developing a Model from Australian Case Studies. International Business Review, 10, 155-174. http://dx.doi.org/10.1016/S0969-5931(00)00049-4
- Andersen, O. and Buvik, A. (2002) Firms’ Internationalisation and Alternative Approaches to the International Customer/Market Selection. International Business Review, 11, 347-363. http://dx.doi.org/10.1016/S0969-5931(01)00064-6
- Rahman, S.H. (2003) Modelling of International Market Selection Process: A Qualitative Study of Successful Australian International Businesses. Qualitative Market Research: An International Journal, 6, 119-132. http://dx.doi.org/10.1108/13522750310470127
- Alon, I. (2004) International Market Selection for a Small Enterprise: A Case Study in International Entrepreneurship. SAM Advanced Management Journal, 69, 25-33.
- Ozorhon, B., Dikmen, I. and Birgonul, M.T. (2006) Case-Based Reasoning Model for International Market Selection. Journal of Construction Engineering and Management, 132, 940-947. http://dx.doi.org/10.1061/(ASCE)0733-9364(2006)132:9(940)
- Viviers, W. and Pearson, J.J.A.P. (2007) The Construction of a Decision Support Model for Evaluating and Identifying Realistic Export Opportunities in South Africa. Report Prepared for the Department of Trade and Industry, South Africa, May, 92 p. (Unpublished)
- Viviers, W., Rossouw, R. and Steenkamp, E.A. (2009) The Sustainability of the DSM for Identifying Realistic Export Opportunities for South-Africa: 2007-2008. Report Prepared for the Department of Trade and Industry, South Africa, February,105 p. (Unpublished)
- Viviers, W., Steenkamp, E.A. and Rossouw, R. (2010) Identification Realistic Export Opportunities for South Africa: Application of a Decision Support Model (DSM) Using HS 6-Digit Level Product Data. Report Prepared for the Department of Trade and Industry, South Africa, September, 57 p. (Unpublished)
- Green, R.T. and Allaway, A.W. (1985) Identification of Export Opportunities: A Shift-Share Approach. Journal of Marketing, 49, 83-88. http://dx.doi.org/10.2307/1251178
- Russow, L.C. and Okaroafo, S.C. (1996) On the Way towards Developing a Global Screening Model. International Marketing Review, 13, 46-64. http://dx.doi.org/10.1108/02651339610111344
- Papadopoulos, N., Chen, H.B. and Thomans, D.R. (2002) Toward a Tradeoff Model for International Market Selection. International Business Review, 11, 165-192. http://dx.doi.org/10.1016/S0969-5931(01)00054-3
- Freudenberg, M. and Paulmier, T. (2005) Export Potential Assessment in Vietnam. (Unpublished Report of the International Trade Centre, Market Analysis Section)
- Freudenberg, M. and Paulmier, T. (2005) Export Potential Assessment in Lao PDR. (Unpublished Report of the International Trade Centre, Market Analysis Section)
- Freudenberg, M., Paulmier, T., Bijl, B. and Ikezuki, T. (2007) Export Potential Assessment in Nepal. (Unpublished Report of the International Trade Centre, Market Analysis Section)
- Freudenberg, M., Paulmier, T., Ikezuki, T. and Conte, K. (2008) Export Opportunity Scan for Jordan: Second Draft. (Unpublished Report of the International Trade Centre, Market Analysis Section)
- Cavusgil, S.T. (1997) Measuring the Potential of Emerging Markets: An Indexing Approach. Business Horizons, 40, 87-91. http://dx.doi.org/10.1016/S0007-6813(97)90030-6
- Arnold, D.J. and Quelsh, J.A. (1998) New Strategies in Emerging Markets. Sloan Management Review, 40, 7-20.
- Verno, C. (2008) The Trade Opportunity Matrix (TOM): An Overview of Canadian Export Opportunities.
- Alexandre, H. (2000) L’Individu face au marché: Investisseurs, spéculateurs et crise boursiers. European Medicines Agency.
- OECD (2004) Principles of Corporate Governance.
- Fosu, A.K. (1992) Political Instability and Economic Growth: Implication of Coup Events in Sub-Saharan Africa. American Journal of Economics and Sociology, 61, 329-348.
- Taylor, C.L. and Hudson, M.C. (1972) World Handbook of Political and Social Indicators. 2nd Edition, Yale University Press, New Haven, 271-274.
- Gupta, D.K. (1991) On the Methodology of Constructing a Composite Indicator for Political Instability: A Cross-Na- tional Study. In: Frantz, R., Singh, H. and Gerber, J., Eds., Handbook of Behavioral Economics, JAI Press Inc., Greenwich, 151-178.
Appendix 1: Calculation of GDP Per Capita’s Inverse Coeficient of Variation
Appendix 2: Calculation of the Population Urban Rate’s Inverse Coefficient of Variation
Appendix 3: Calculation of the Infrastructure Investment’s Inverse Coefficient
Appendix 4: Calculation of the Real Effective Exchange Rate’s Inverse Coefficent of Variation
Appendix 5: Calculation of the Index I
Appendix 6: Calculation of the Iron and Steel Export’s Inverse Coefficient of Variation
Appendix 7: Calculation of Every Country Final Score Sp
Appendix 8: Formula of Calculation of Variables
1. Multilateral Nominal Effective Exchange Rate: NEER
Let given a period t,  is the exchange rate of the partner countries of the African country i quoted on the uncertain. The partner countries are the USA, France, Germany, Italy, Spain, Great Britain, and China.
 ; 1£ =;;


where n is the number of partner countries.

j belongs to the ensemble {China, France, Germany, Italy, Spain, United States}.
where Xi represents the exportation of countries i to the African country and Mi represents it importation.
2. Calculation of Foreign Prices Index FPI

3. Calculation of REER: Real Effective Exchange Rate

DPI: domestic price index of African countries;
FPI: foreign prices index;
LCU: local currency.