American Journal of Industrial and Business Management
Vol. 2 No. 2 (2012) , Article ID: 18838 , 13 pages DOI:10.4236/ajibm.2012.22004
Value Stream Management for Lean Office—A Case Study
![]()
1Department of Industrial and Manufacturing Engineering and Technology, Bradley University, Peoria, USA; 2College of Engineering, Iowa State University, Ames, USA.
Email: jchen@bradley.edu, rcox@isstate.edu
Received November 22nd, 2011; revised January 6th, 2012; accepted January 16th, 2012
Keywords: Lean Manufacturing; Lean Office; Value Stream Mapping; Kaizen; Kanban
ABSTRACT
This paper presents a look at the concept of Lean Manufacturing as applied to the office environment. Lean Manufacturing, which is often referred to as Lean, is a philosophy of manufacturing process improvement through the elimination of waste. As Lean developed since its origins in the automobile industry, it has been extended to apply to various enterprises and organizations, and has achieved a renowned reputation for reducing waste while adding value to products and services. Lean has also been applied in the office environment; however, participants in the implementation of Lean Office face more difficulties because of higher variation in office processes, less foundation information for participants, and lack of references in literature. This paper addresses these issues by proposing, a systematic procedure for conducting Lean Office techniques, along with a case study at a local company. The case study demonstrates a step by step procedure to help more participants in Lean Office understand its benefits and how to get started.
1. Introduction
Although Lean was initially introduced by the automobile industry, its principles have more recently spread into other industries. There are a variety of companies that have experienced the advantages of applying Lean in their manufacturing area. For instance, Lean was applied by Boeing to eliminate waste and make its products more cost-competitive. After implementing Lean, Boeing successfully cuts its defect costs by 75 percent, which resulted in a cost savings of about $655,000 per aircraft [1]. Moreover, after applying Lean in its manufacturing system the inventory level of DELL dropped by 50% and the time required to produce a PC was reduced, and as a result, DELL can guarantee that customers will receive their products one week after they order them [2]. These enterprises are major producers of tangible products and the results of their improvements can be measured by comparing the product cost before and after implementation. In order to obtain such benefits in the office settings of the manufacturing industry, Lean princeples are now being applied in office-based functional areas such as research and development, administration, and customer service.
“Lean is a systematic approach for identifying and eliminating waste through continuous improvement by ‘flowing’ the product at the pull of the customer in pursuit of perfection” [3]. One of the key phases in Lean is the identification of non-value added steps in order to streamline a process. By classifying the steps of a processes into two categories, value added and non-value added, it is possible to initiate actions to improve the former and eliminate the latter by reducing wastes in both of them. In his book, Toyota Production System, Taiichi Ohno lays out the main foundations of Lean Manufacturing, and describes seven wastes existing in manufacturing [4]. These wastes are transportation, inventory, waiting, defects, over-processing, excessive motion, and over-production. To identify areas in a system where improvement is needed, the seven wastes needs to be identified and then measured. While most of these wastes are visible and easily quantifiable in a manufacturing environment, they are more difficult to be distinguished and measured in an office environment.
Transportation waste in manufacturing, for example, can be measured by estimating the time consumed while moving work in process (WIP) from one workstation to next workstation. On the other hand, in an office environment, most of the tasks are translated via email or fax, causing more variation in time consumption, and correct arrive and departure times are difficult to determine. Inventory waste in manufacturing can be classified by calculating the WIP level in the workstation or finished goods in the warehouse, but it is hard to identify the amount of pending items in each office job. Moreover, time waste due to waiting can be evaluated by accumulating the total idle time of machines or operators; whereas, the idle time in the office is difficult to judge because some tasks require confirmation by a supervisor or customer. This makes it difficult to assess the problem due to lack of definition of office workers’ idle time. Furthermore, the defect rate can be measured by calculating the amount of finished product and WIP that fail inspection divided by the amount of parts that pass inspection, but it is hard to establish a measurement in an office environment to distinguish whether the task is failed or not because there are many variables in these tasks.
Not only are office wastes difficult to define, lack of references about conducting Lean in an office environment leave participants struggling in how to get started. Although some Lean Office projects have been documented [5-7], a systematic procedure for creating a Lean Office has not been universal. It is also the authors’ belief that more documented successful case studies of implementation of Lean Office, including a proposed systematic approach, would help many companies with such a project. Implementing lean office helps reducing their idle time and makes each department organized. The purpose of this paper is to demonstrate a successful Lean project in a local small manufacturer for two major purposes. First, this study will provide a systematic procedure which will help managers or engineers that are attempting to implement Lean in their office. Second, a case study will be presented by following the proposed systematic procedures at this company and demonstrate that Lean can be implemented in an office environment of the manufacturing industry.
2. Proposed Systematic Procedures for Creating Lean Office
At this time, Lean principles have been applied in several enterprises as a means of providing products and services that creates value for customers with a minimum amount of waste and a maximum degree of quality. Still, it can be more difficult to bring the concept of Lean into the office environment than a manufacturing area because of a lack of understanding, a lack of cooperation between departments, and a lack of directive from the top [6]. The proposed procedures for providing a systematic approach for implementing Lean in an office environment consist of the following six steps.
Step 1. Form a Lean event team and provide Lean training to team members
Before conducting a Lean event, some preparations should be made, and a Lean event team must be formed. Show the office administrators some typical cases of how lean is successfully implemented in a manufacturing environment. Describe the blueprint after implementing lean office to convince the office managers it is costeffective. Selecting team members depends on the goal of this event or targeted department which is considered as a bottleneck in the company. The basic rule for selecting members is to find major processes that are related to this Lean event and separate these into individual process. Then, determine the owner of each process related to this event for providing necessary information; moreover, fundamental training of team members is necessary to create a common language among the team members and to help sustain the Lean event in the company.
Several professional organizations and companies exist today that provide training for new-Lean-participant companies. They normally provide the introduction of basic concepts about Lean Manufacturing to help team members understand the benefits. According to a participant workbook of a Lean training organization [8], Lean is a systematic approach to identify and eliminate waste through continuous improvement, focusing on flowing the product at the pull of the customer. Lean philosophies are also described as a building with component blocks, which is shown in Figure 1. As seen in this figure, there are several Lean principles that can be used to eliminate waste from the system. Descriptions of these Lean principles are listed in Table 1.
Once the basic Lean concepts have been introduced to team members, they will have a better sense about how to use these principles to eliminate waste and add value to the product. In the Figure 1, it can be seen the important step to lead the team into the rest of the Lean building blocks is Value Stream Mapping (VSM). VSM is one of the most powerful Lean tools available [9]. It combines material production flows with information flows of company in a map; moreover, it forms the basis of an implementation plan for company to start its Lean journey [10]. By mapping the whole processes, team members are able to visualize more than the single-process level and realize the connection between information flow and material flow. The four steps that follow summarize the process for creating an office value steam map.
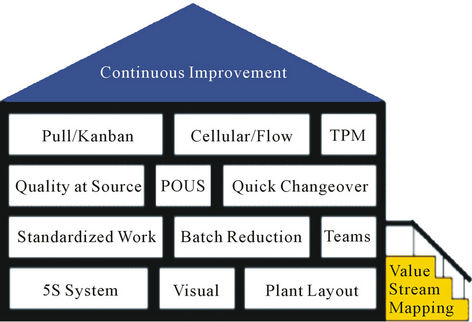
Figure 1. Lean building blocks.

Table 1. Basic Lean principles and descriptions.
Step 2. Selecting a product/service family for conducting VSM
“Your customers care about their specific products, not all of your products” [10]. Therefore, it is important to identify and focus on a single family of products from the customer end of the value stream. It is only necessary to map things that are relevant to this product or service, as selected by the team leader, because drawing everything that happens in the plant on one map would make the map too complicated [10]. Products or services which involve similar customers and similar supplier inputs should be put together as a target product family and drawn on one VSM. That makes the VSM easier to visualize and understand.
Step 3. Drawing the current-state map
A current-state map value stream map is a tool that helps teams see and understand the present flow of material and information. There are several tips for drawing a current-state map [10]. The first tip is that the map should be drawn by hand in pencil; drawing by hand can be done without delay and helps members focus on the flow rather than how to use computer software. The second tip is to collect current-state information while “walking through” the actual pathway of the material and information flow. Remember, mapping cannot be done in a conference room; members should physically go see and understand how each task is really done. Furthermore, the process owners can provide any information to team members with as much detail as possible. The third tip is that members should start at the customer end and work upstream because services or products should be driven by customer demand. Therefore, the process that is linked most directly to the customer should be considered as the beginning and the pace for other processes further upstream. The fourth tip is following the icon scheme which is shown in Figure 2. There are established standard icons for value stream maps so that members can create a VSM which is able to be understood by other people. Following these tips, members can bring a stopwatch, paper and pencil and then start to draw the current map. Typically, it takes five steps for drawing an office value stream map [10]:
1) Document customer information and needs;
2) Perform a value stream walk-through for identifying processes, filling data boxes, and calculating WIP numbers;
3) Show the linkage of information flow and material flow in the office;
4) Calculate lead time and process times;
5) Complete the current-state map with lead time bars and data.
Although the mapping process might be labor intensive, it takes the team to a deeper level of understanding of what is actually happening and makes the case for change more compelling. Additionally, the current-state map provides foundational information for the future
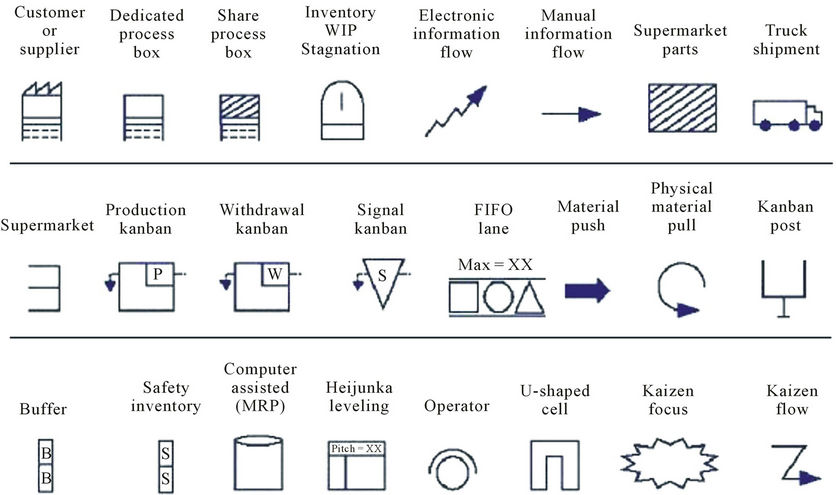
Figure 2. The common VSM icons.
state. After creating the current map all of the team members are able understand the entire process, and to have more information for brainstorming the future state of the company.
Step 4. Brainstorming and developing a future-state map
The future state should be a chain of processes, where individual process are linked to their internal and external customers, streamlined so that each process should only produce what its customer needs, when they need it [10]. In this step, team members should go through the following seven questions and mark the future state ideas directly on the current-state map based on the answers to these questions [11].
1) What/When does the customer need?
2) How often will we check our performance to customer needs?
3) Which steps create value and which are wastes?
4) How can we flow work with fewer interruptions?
5) How do we control work between interruptions? How will work be prioritized?
6) Is there an opportunity to balance the workload and/ or different activities?
7) What process improvements will be necessary?
Once the team has brainstormed ideas for the future state as described above, a future value stream map can be drawn. Rother & Shook described the purpose of VSM as: “to highlight sources of waste and eliminate them by implementation of a future state value stream that can become a reality within a short period of time”. After proposing a future value stream map, the team members should start to think about how to make the future state become a reality as soon as possible.
Step 5. Proposing a value stream plan to reach the future stage of VSM
Future value stream maps demonstrate an ideal state for companies. It is essential to make a plan for achieving the future state; otherwise the future value stream map will become worthless. A yearly value stream plan should be created. A value stream plan includes the implementation plan from the current state to the proposed future state. This plan consists of several loops separated from entire office processes, such as research and development, finance, and customer service [10]. In most cases it will not be possible to achieve the future state all at once because the proposed future value stream map demonstrates the entire flow through the office. Therefore, dividing the proposed future state map into several loops and improving individual loops is easier for team members to implement [10]. The four steps that are used when improving an individual loop are:
1) Develop a streamlined process that operates based on customer demand;
2) Establish a pull system to control production;
3) Apply leveling;
4) Practice Kaizen to continually eliminate waste and extend the range of streamlined processes.
There are several points that should be indicated in the value-stream plan, such as what will be implemented in an individual loop, how to do that and when, measurable goals, a clear check point with real deadlines, and an assigned reviewer. A detailed “one year value-stream plan sheet” example is provided in the case study in S’s next section.
Step 6. Conducting kaizen events for distinguishing and eliminating wastes
Kaizen is a Japanese word that translates to “continuous improvement”. In the office environment, Kaizen focuses primarily on the improvement of an individual loop through the efforts of process owners by using their experience [12]. Normally, there are three steps to perform the Kaizen activity which are:
1) Utilize the 5 why’s method to find the root cause of wastes [13], using the following guidelines:
a) Writing down the problem helps you formalize the problem and describe it completely. It also helps a team focus on the same problem.
b) Ask why the problem happens and write the answer down below the problem.
c) If the provided answer doesn’t identify the root cause of the problem that you wrote in step 1, ask why again and write that answer down.
d) Repeat above steps until the team is in agreement that the problem’s root cause has been identified.
2) Brainstorm and develop the resolution to meet the goal.
3) Implement resolution and sustain.
Based on the procedures of the Lean Office event, a team consisting of several employees was formed to implement Lean in a local electrical company. This team focused on assisting the company in dealing with complicated non-manufacturing departments such as Purchasing, Electrical and Structural Design, and Projects. It is the authors’ hope that the case study serves as a stepby-step procedure in helping other companies achieve their own Lean office environment.
3. Case Study of Creating Lean Office
3.1. Company and Product Introduction
The company is a small electrical manufacturer located in the Midwest. They have a wide variety of customers located all over the world, in industries ranging from general contractors, to industrial facilities, to large comercial power grids. The major products of this company are industrial switchgears and switchboards, and all of these products are made to their customers’ exact specifications. The company has been applying Lean in their manufacturing area for several years. The Project Manager (PM) told us the lead time of the manufacturing area is one week, but the lead time of the previous process, creating a blue book is about 4 weeks. A blue book consists of engineering drawings, BOM, and manufacturing process plan for a given customer order. Customer satisfaction was highly impacted by the long lead times, which kept customers waiting for their order. Therefore, they wanted to transform their office processes by applying a Lean strategy in order to increase the efficiency of the design department, thereby increasing customer satisfaction.
3.2. Lean Event Based on the Proposed Procedure
Step 1. Form a Lean event team and provide Lean training to team members
This Lean event is focused on improving the nonmanufacturing area in Company X. Several employees were selected from the Purchasing, Electrical Design, and Structural Design departments to participate in this event. The PM was the leader of this Lean event team for supervising the progress of this event and making the improvement decisions. After forming the team, a basic Lean principles training was provided to team members; moreover, team members also learned about steps and tips of creating a VSM.
Step 2. Selecting a product/service family for conducting VSM
The blue book was chosen as the target of this Lean project because it is the major product of the non-manufacturing area. Creating a blue book involves three departments in the company: Purchasing, Electrical Design, and Structural Design. The Lean event team focused on the processes which were involved in creating a blue book.
Step 3. Drawing the current-state map
Initially, the PM provided the information about customer demand. According to the passive orders, the company receives about 180 orders annually. Performing a walkthrough and collecting the data which represents the current status in each department is the second step of creating a current value stream map. By consulting process owners, team members obtained and recorded most of the necessary information, such as process time, numbers of workers, and pending work in each station. After the first walkthrough, team members became familiar with the current flow and sequence of creating a blue book and also roughly drew the current-state map by following the icon scheme shown in Figure 2.
In the second round, team members focus on the communication in each department. Operation owners described the sequence of their jobs, and how they communicate with upstream and downstream processes. That helps the team draw linkages of information and material flow on the current-state map. In the third round, the team focused on the time consumptions of each process and pending job. Team members checked the process time and lead time with operation owners; moreover, in this walkthrough team members verified uncertain information collected in the previous walkthroughs. After collecting this data and re-checking with the process owners, the Lean project team created the current value stream map as shown in Figure 3.
Once the customer sends the order to Purchasing, this department creates a quote and a rough Bill of Materials (BOM). They notify the president that they received the quote and then the president generates the order that tells the PM to create the BOM. Additionally, the PM is in charge of customer communication and reviewing any design corrections. Therefore, every change in the blue book must go through PM.
After creating the BOM, the PM sends it to the customer via email, and waits for the customer to review it. The customer review takes about 10 working days, which greatly increases the lead time of the non-manufacturing area. After the customer is finished reviewing the BOM, it is sent back to the PM who reviews the BOM once again. After the PM is finished with this review, the BOM is sent to Purchasing so that they can check the raw material item numbers and ensure that the customized product can be made based on raw material availability. The map of the Purchasing sub process is shown in Figure 4.
While Purchasing performs this review, the BOM is also sent to the customer for another review and correction. Once the customer reviews and approves the layout and the purchaser verifies the items, the information is sent back to the PM. Once the PM approves everything, structural Design and Electrical Design stats the design process. The map of the Structural Design process is shown in Figure 5 while the Electrical Design process is shown in Figure 6.
Since a blue book is made by several departments, the Lean event team created a VSM for each department. In the purchasing sub-process (Figure 4), most of the transportation of information was made via email. Following the customer’s specification, the purchaser creates the purchase order (PO) and sends a copy to each the supplier to ensure that the company can make the customized product. The POs are sent back to the purchaser once the suppliers have checked their copy and corrected any incorrect item numbers. The PM checks the item numbers in the blue book again, makes the changes as necessary to the PO, and then sends it back to the purchaser for any necessary review/corrections by the supplier. The PM told the Lean even team that the purchasing correction loop is usually repeated 2 times per task.
There are four designers involved in Electrical Design and all of their work must be checked by the PM before the designs are sent to the customers or the production area. After the PM finalizes any corrections the electrical design of the blue book will be sent to Support Cycle for a point-to-point check of the electrical design and so labels can be made for each point and wire. After observing this and the Structural Design process, the Lean event team members determined that the correction process
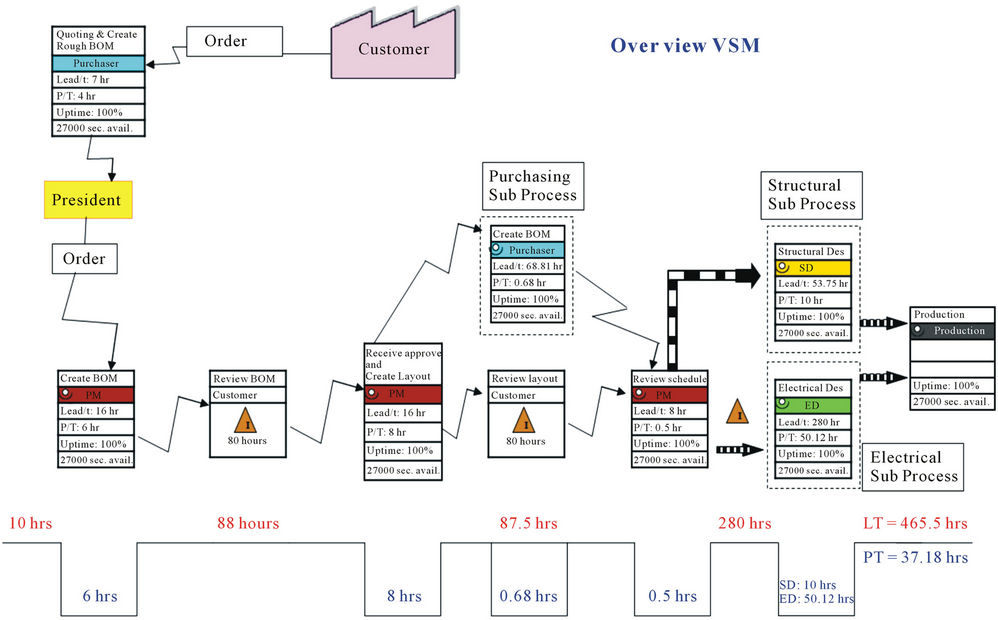
Figure 3. Current VSM overview.

Figure 4. VSM of Purchasing sub process.

Figure 5. VSM of Electrical Design sub process.
was repeated at least 3 times. This greatly increased the lead time of these sub processes. Furthermore, while all of the design information that is transported from the PM to the customers is done via email, the information transported between the PM and Electrical Design or Structural Design is done by physically delivering the blue book.
Step 4. Brainstorming and developing a futurestate map
After three walkthroughs, the Lean event team members determined there were some needed improvements in the current state. Based on the information from the current value stream map, the team began brainstorming a future ideal state for the company. Following the proposed procedure, the team addressed the following seven questions to define a future VSM:
1) What/When does the customer need?
In this case study, blue books are required for customer orders, and it is the need of the customers that receive the product that they have specified, with as short a lead time as possible. According to a review of past orders, the company receives 180 orders per year. The working time of the company is 8 hours per day, 250 days per year. The Takt time of each task, according to Equation 1, is about 11.1 hours.
2) How often will we check our performance to the customer’s needs?
The PM will review the customized blue book, and it will also be reviewed by customers whenever it is changed.
3) Which steps create value and which are wastes?
According to the current-state map in Figure 3, the total value-added time, such as creating BOM and creating the electrical and structural designs, is only about 37.18 hours, but the non-value added time is more than 400 hours. By reviewing the current-state map and discussing it with the process owners, the Lean event team found that there are several existing non-value-added activities and waste. These non-value-added activities are described in the Table 2.
4) How can we increase the flow of work with fewer interruptions?
Due to lack of control of task sequence and time consumption, it is not easy to track all of the tasks in the

Figure 6. VSM of Structural Design sub process.
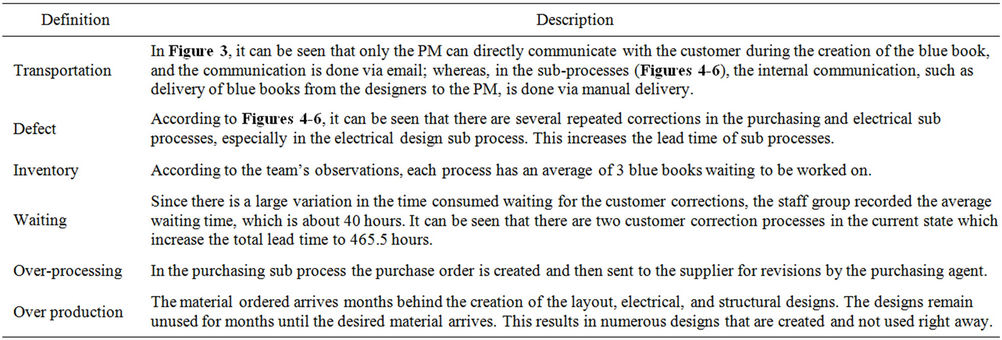
Table 2. Identified non-value added activity.
company. The Lean event team suggested that the company apply a Kanban system. This will efficiently schedule tasks to real time demand as well as optimize and control the pending work. Interruptions can be decreased by applying software applications in some sub processes.
5) How do we control work between interruptions? How will work be prioritized?
According to observations, every process in the company is done using a push system, there is no rule to control the task priority, and all of the information on customer demand is managed by the PM. Therefore, the Lean project team suggested that a pull system be implemented where the priority of the tasks are controlled by Kanban system managed by the PM.
6) Is there an opportunity to balance the work load and/or different activities?
The team suggested that the PM follow-up with the customer’s corrections frequently to reduce the time consumption of reviewing the BOM and design layout. If the lead time of the customer correction is able to be reduced, the total lead time to create the blue books would be relatively decreased.
7) What process improvements will be necessary?
The team found that the PM and purchasers did not check their email frequently; therefore, there is no efficient standard tracking system for task sequence. To solve this problem the Lean project team suggested that a Kanban system be implemented as well as using software features to remind PM and purchasers to follow up with customers’ and suppliers’ corrections. This would allow the company to reduce the total lead time. The Lean project team also recommended that an online order entry should be developed for the purchasing sub process as well as the creation of a database so that available item numbers can be recorded.
A clear future state of the company was envisioned by the team members upon answering the seven questions listed above. The team then proposed a future map for the company’s non-manufacturing area, which is shown in Figure 7. The light burst areas designate the areas that will be improved by conducting Kaizen activity. In the proposed future state, the team members streamlined the office processes and suggested that the production of every process should be triggered by its customers demand.
The future VSM serves as a guide for further improvement of the Lean event. After the future state map is proposed, the team members start brainstorming on how
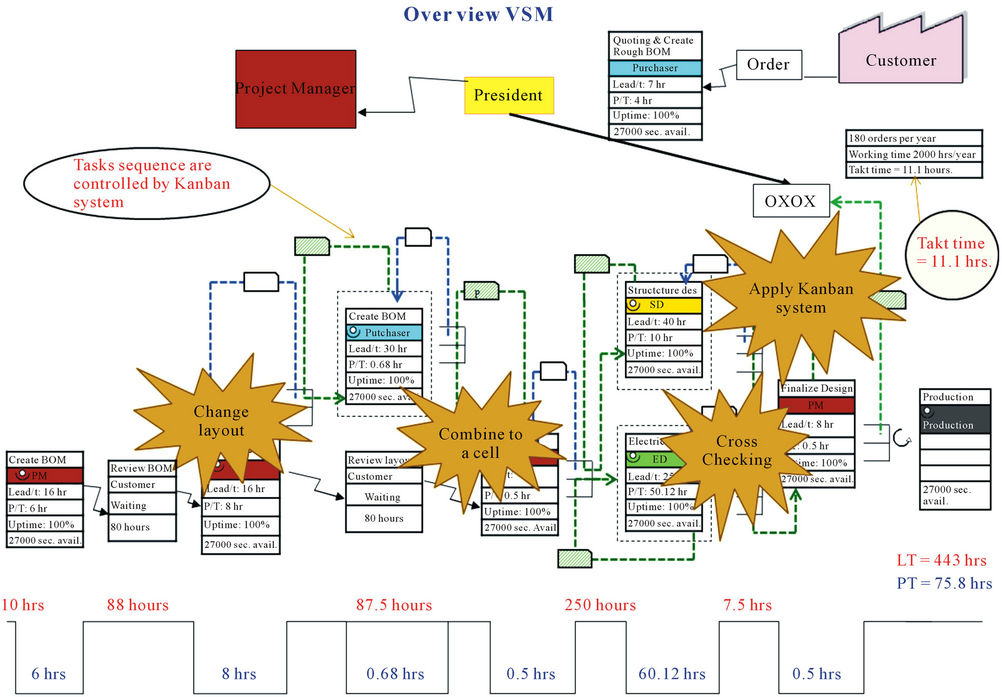
Figure 7. Future VSM with light bursts of Kaizen events.
to make it become a reality, and the leader of the team creates the value stream plan.
Step 5. Proposing a Value stream plan to reach future ideal state of company
In order to reach the future state within a short period of time, the leader of the Lean event team needs to create a “yearly value stream plan” sheet. Each sub process is considered a loop for improvement. Since the lead time of the electrical design process is higher than the purchasing and structural design processes, this is considered as the first target to improve. There is a measurable goal for each loop, and the leader assigns a person to be in charge of the improvement of each of the loops. The proposed value stream plan is shown in Figure 8.
Step 6. Conducting Kaizen events to reach the future state VSM
While brainstorming the future VSM, team members identified where the non-value added activities and wastes existed in the current process (Table 2). The goal of the Lean Office event is to continuously reduce waste in office processes and to add value in products or services. A clear direction about what the team needs to implement in what loop is provided by the value stream plan (Figure 8). The light bursts in the future-state map shown in Figure 7, which are matched to the value stream objecttives in the value stream plan, represent a change that needs to be made in order to make the current system look more like the future state map. To achieve the goals in the value stream plan, the team members conducted several Kaizen events where they used the 5 why’s method to determine the root cause of a problem. Once the root cause was identified the team then brainstormed solutions for each problem. The following paragraphs summarize these Kaizen events.
Kaizen Event 1: Reduce the defect rate in the electrical design process
The defect rate in the electrical design process is about 100%. The three effects of this high defect rate are:
1) The overall lead time is increased;
2) The amount of WIP inventory increases;
3) The Company labor costs increase due to rework.
Root cause identification:
In order to eliminate this problem, the Lean event team used the 5 why’s method to determine the root cause, as

Figure 8. Proposed value stream plan.
summarized in Figure 9.
Proposed resolution:
The Lean event team suggested that the company ask the electrical designers to cross check each other’s designs for accuracy. In addition, the purchasing process should be completed before the design phase begins. Therefore, by waiting for a final BOM and cross-checking each others work, the Electrical Design team can help ensure that the PM is simply approving the final design, rather than perpetuating a continuous cycle of corrections.
Kaizen Event 2: Reducing waiting time in the purchasing process
There is a repeated cycle that happens when Purchasing is forced to call the supplier for clarification. Waiting waste takes place when the supplier has to send the order back because they don’t recognize the part number indicated on the bill of materials.
Root cause identification:
By asking the 5 why’s, the team members are able to find out the root cause, as seen in Figure 10.
Proposed resolution:
Due to the constant correction cycle between the material supplier and Purchasing, the Lean event team proposed another cell in which purchasing and quoting are combined into one process to eliminate waste. If purchasing and quoting are combined into one process, the BOM will be finalized and material ordered before the PM starts a design and corrections will no longer need to be passed to the PM. Consequently, the company can save approximately 20 hours of labor per job and the company can save $340 per job, for an annual labor savings of $61,200.
Kaizen Event 3: Reducing transportation in the design process
During the design creation process, unnecessary steps are executed that require manual transportation of design documents to several areas in the office. To deal with this problem, the team members measured the distance from each particular office and found where and when the transportation occurs, which is summarized in Table 3.
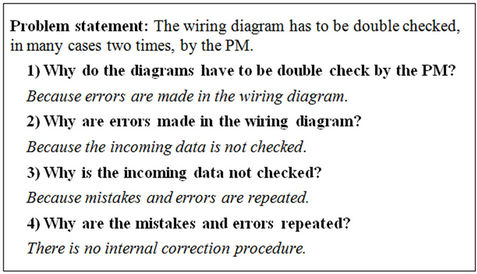
Figure 9. 5 why’s for defect waste.
After measuring the distances, the Lean event team found that one critical problem in the design process is the repetition of identical transports. The total manual transportation per job is approximately 3018 ft, which equals to that $1334 in labor costs wasted by transporting blue books or documents.
Root cause identification:
In order to reduce the transportation problem, the team members use the “5 whys” to find the root cause which is shown in Figure 11.
Proposed resolution:
The Lean event team proposed a Kanban post and Kanban card for the company, which is shown in Figure 12. This Kanban post visually shows the PM and designers each task and which department it is in. To track the tasks efficiently, each task is accompanied by a Kanban card. Once a process is completed, a slip is torn off the Kanban card and then placed on the board. The PM can
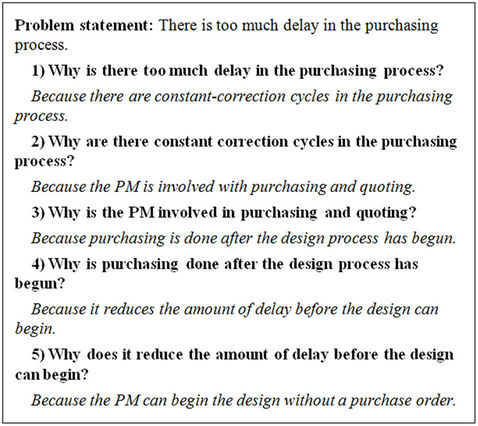
Figure 10. 5 why’s for waiting waste.
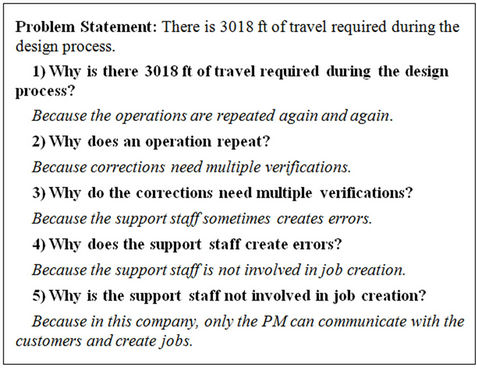
Figure 11. “5 whys” for transportation.
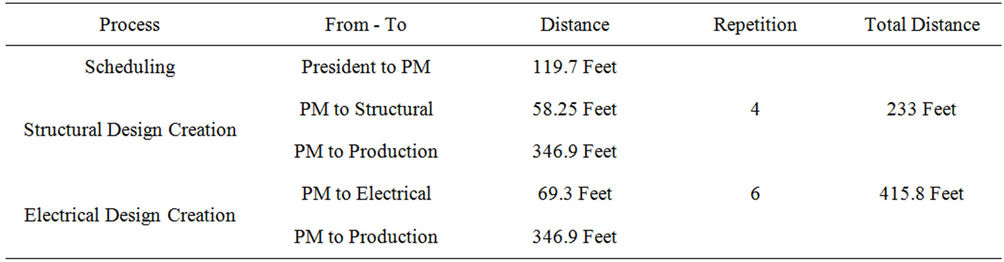
Table 3. Transportation distances.
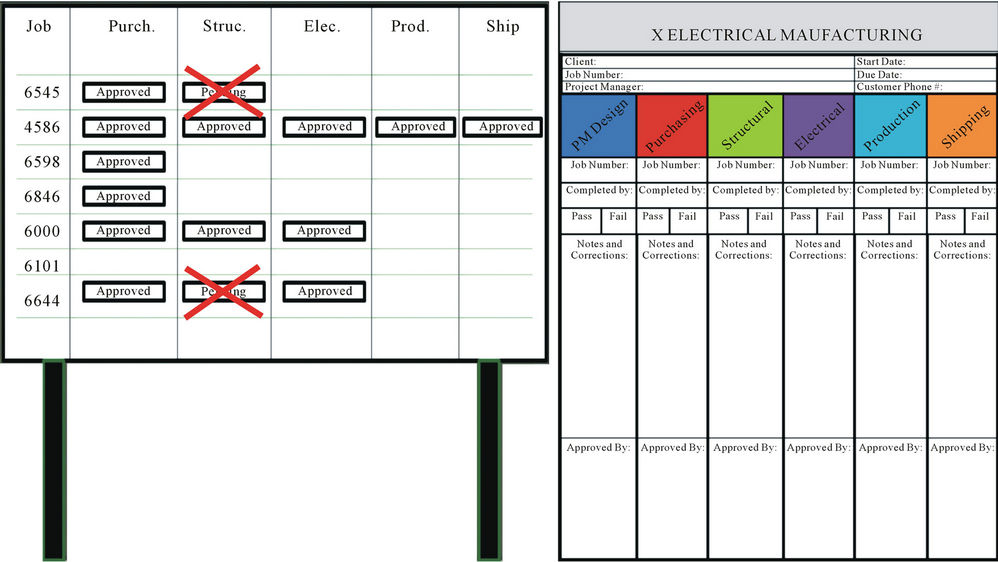
Figure 12. Proposed Kanban post and card.
then sign off on the Kanban slips. During the purchasing or design process, any corrections are written on the slip, which is then returned to the responsible team member.
4. Conclusion
This paper presents a systematic procedure which could be used by Lean practitioners to conduct Lean events in their office environment. The proposed procedure incurporates the knowledge of several articles, books and successful Lean events. It also includes a case study which follows the proposed procedures and is provided as a reference for creating a Lean office. The application of Lean principles in a manufacturing area means identifying the value added and non-value added activities in manufacturing processes and then eliminating the nonvalue added activities while improving the value added activities. The systematic procedure proposed here extends this concept to transform an office environment into a Lean office that has customer-triggered working processes, faster and systematic task tracking, and reduced costs due to a reduction of non-value added activeties.
REFERENCES
- M. Jenkins, “Across the Enterprise Boeing Is Attacking Waste and Streamlining Process. The Goal? Cost Competitiveness,” 2002. http://www.boeing.com/news/frontiers/archive/2002/august/cover.html
- M. Poppendieck, “The Principles of Lean Thinking,” ITC, Winnipeg, 2002, pp. 1-7.
- IMEP, “Principle of Lean Manufacturing,” 2000.
- T. Ohno, “Toyota Production System: Beyond Largescale Production,” Productivity Press, New York, 1988.
- M. Corrie, “Lean Success in an Administartion Envrionment,” Waukesha Bearings Ltd., Northwood Hills, 2004.
- L. A. Tonkin, “Lear Office: Mapping Your Way to Change,” Target, Minneapolis, 2004.
- E. P. Ev Dale, “Lean Enterprise: Minnesota Showcase,” Target, Vol. 18, No. 1, 2002, pp. 50-53.
- IMEP, “Principles of Lean Manufacturing with Live Simulation (Participant Workbook),” 2003.
- H.-D. Wan and F.-F. Chen, “Leanness Score of Value Stream Maps,” Proceedings of the 2007 Industrial engineering research conference, Nashville, 20-23 May 2007, p. 1515.
- M. Rother and J. Shook, “Learning to See,” Lean Enterprise Institute, Cambridge, 2003.
- IMEP, “Office Value Stream Mapping. Iowa Manufacturing Extension Partnership,” 2008.
- W. Lareau, “Office Kaizen: Transforming Office Operations into a Strategic Competitive,” American Society for Quality, Milwaukee, 2002.
- J. Womack and D. Jones, “Lean Thinking: Banish Waste and Create Wealth in Your Corporation,” Simon and Schuster, New York, 2003.