Modern Instrumentation
Vol. 1 No. 4 (2012) , Article ID: 23652 , 4 pages DOI:10.4236/mi.2012.14005
The Flow Measurement of Multiphase Flow Based on the Conductance Sensor
Key Laboratory of Photoelectric Logging and Detecting of Oil and Gas, Ministry of Education,
Xi’an Shiyou University, Xi’an, China
Email: *271281896@qq.com, mailzds@126.com, 1305272613@qq.com, 1436001493@qq.com
Received August 25, 2012; revised September 28, 2012; accepted October 10, 2012
Keywords: Correlation Measurement Technology; Conductance Sensor; Flow Measurement; Three-Phase Flow
ABSTRACT
Oil-gas-water three-phase flow in the pipe is commonly encountered in the petroleum and nature gas industry. Its flow patterns are complex and always changeable, so it’s difficult to be measured and is becoming one of the most important subjects. Moreover, most of the oil fields in China are in such a high water fraction period that measures must be taken to meet the needs of the actual production. A conductance sensor which is widely used in the measurements of oil-water two-phase flow is used to measure the flow rate of the three-phase flow based on the research of the characteristics and the correlation theory, and a new technical solution which is suitable for measuring the oil-gas-water three-phase flow is established. A series of tests demonstrate that it’s feasible to use the conductance sensor in the measurements of oilgas-water three-phase flow.
1. Introduction
The multiphase flow usually has complex flow pattern, which brings many difficulties in measuring. In recent years, people have been doing a lot of research work about the three-phase flow, and many new measurement methods and theoretical models are proposed. Also, lots of instruments and great achievements have been made in their research work.
With the related theory of stochastic process and the theory of information as a foundation, the research work about the correlation measurement technology used in industry started in the sixties of the twentieth century. In 1961, British Butterfield first used the correlation of random waveform to measure the strip speed [1], and Beck used the cross-correlation method to analyze natural flowing signals and developed it into a theory in 1969 [2-4]. In recent years, Lucas [5-7] has made use of the theory of kinematics wave and the drift model based on two-phase flow, which has achieved a high precision prediction of the homogeneous velocity of oil-water flows by measuring their correlation velocity, and this also gave us a better illustration that the measuring of relevant velocity had its actual physical significance and it had wide prospects. In China, the research work about this theory started from the late 70s of the 19th century, and we have made great progress [8]. Since 1994, some Chinese researchers have also done lots of research work about the correlation measurement technology of using the conductance sensors, and the underground oil-water two-phase flow measurements have achieved good results [9,10].
In this paper, the conductance sensors have been used in measuring the oil-gas-water three-phase flow. Besides considering of the different factors from the measurements of oil-water two-phase flow, the correlation measurement technology took in the formulation of the measurement scheme that was suitable for the measurements of the oil-gas-water three-phase flow, and the indoor test system were set up especially for the experiments. After plenty of tests, we can verify the correctness of the scheme and come to some useful conclusions.
2. Measurement Principle and Algorithm
2.1. Measurement Principle
Flowing signals are produced during the flow of oilgas-water mixed fluid, which can be used in the corelation measurement to change the problem of the measurement of velocity into the problem of measuring the time interval.
As is shown in Figure 1, the same kind of sensors, which are named as upstream and downstream sensors and have a distance of L, are installed along the flow pipe. As the mixed fluid flows through the sensors, the energy beam or energy field produced by the sensors will
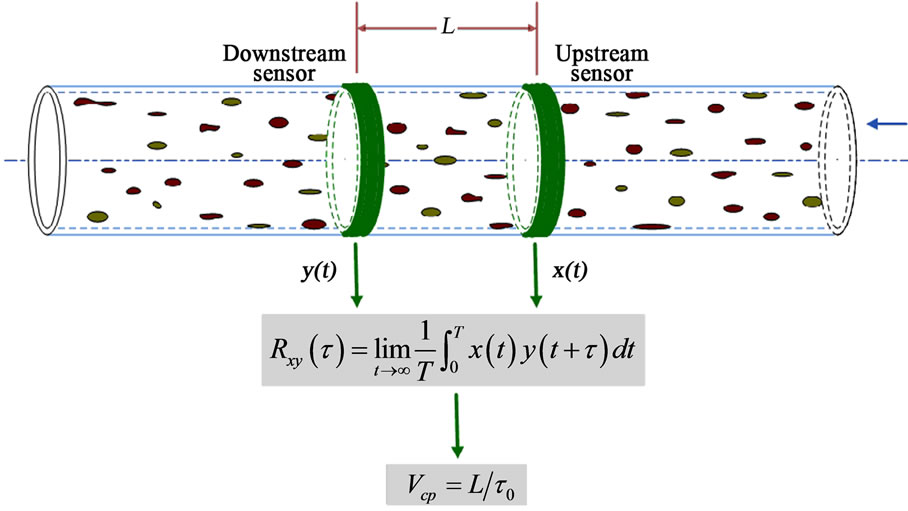
Figure 1. Cross-correlation velocity measurement diagram.
be modulated irregularly, and then the outputs of the sensors will be changed with the modulated signals of the flow. So the outputs of the upstream and downstream called x(t) and y(t) are signals related to the patterns of the measured fluid. When the measured fluid flows stably through the sensors, the modulated signals x(t) and y(t) can be considered separately as two sample functions of xk(t) and yk(t) that come from the ergodic stationary random process.
According to the “Solidification” flow pattern assumption proposed by G. I. Taylor, the irregular modulation of the signal xk(t) at the upstream sensor will repeatedly appeared at the downstream sensor after a certain time ,which is named as the transit time, and we can detect the signal yk(t) at the downstream sensor that has been irregularly modulated by the fluid. That is the signal xk(t) and yk(t) have great similarity besides the last one has a time lag named transit time
 . In fact, the “Solidification” flow pattern assumption can not fully reflect the patterns of the oil-gas-water three-phase flow, but we can approximatively think that the change of the flow pattern is so little that it can be ignored when the distance of the upstream sensor and the downstream sensor is small enough. This requires that we must obtain a stable periodic flow of the fluid during testing, and then we can think the “Solidification” flow hypothesis is basically satisfied. So we can describe this as:
 (1)
(1)
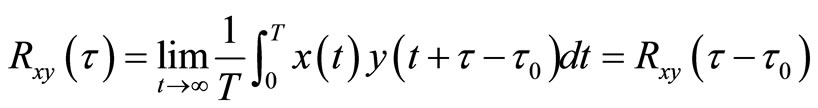
So, the cross-correlation function is written as:
 (2)
(2)
As the reflects the interaction and the similarity of the two waves described as x(t) and y(t) here, we can know from the characteristics of the correlation function that
  obtains the maximum value when when
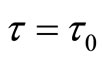 . That is to say, the peak of the correlationfunction
 corresponds to the time value
  which exactly is the transit time
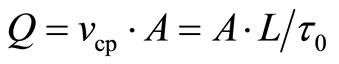
  when the mixed fluid flows from the upstream sensor to the downstream sensor. As the distance between the upstream sensor and the downstream sensor L is known, we use A to describe the cross-sectional area of the pipe that the mixed fluid flows past, so we can obtain the flow Q:
 (3)
(3)
where  is the flow velocity.
As all these results are obtained under the ideal conditions, we must consider many other factors during the tests such as the change of the flow patterns when the mixed fluid flows from the upstream sensor to the downstream sensor. This may lead to the decrease of the similarity of the signals and equal to add a random disturbance signal to the sensor, which will inevitably lead to the measurement error.
2.2. Algorithm
The correlation function 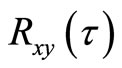 of the flow signal x(t) and y(t) can be obtained by using the correlation algorithm in frequency domain [11], which has its unique advantages compared with other algorithms. In frequency domain, we can use the Fast Fourier Transform (FFT) to improve the computing speed and the real-time, and we can also obtain a higher precision.
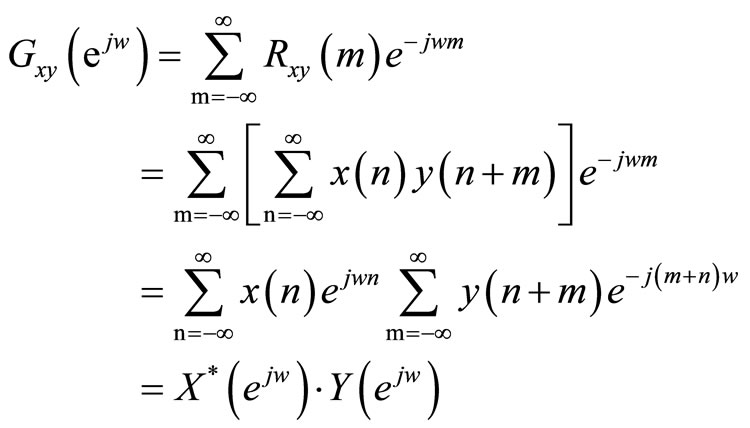
The correlation algorithm in frequency domain is used to calculate the correlation between the two flow signals in frequency domain. If  is the FFT of x(t) and
 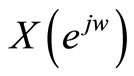 is the FFT of y(t), according to the WienerKhintchine formula, the bilateral cross-spectral density function
 is the Fourier transform of the correlation function
 .So we can get:
As is shown in Figure 2, we can get the correlation function by doing like this. First of all, do the FFT of x(n) and y(n) separately and get X(k) and Y(k) in frequency domain, then calculate the conjugation of X(k) and multiplied with Y(k) to get . The correlation function
  can be obtained by doing the IFFT of
 .
.
From Figure 2, we can get the correlation function in frequency domain easily after doing the calculation of FFT and IFFT which can be done by the software MATLAB. So the advantages of calculating the correlation function in frequency domain are obvious.
3. Sensor Design and the Construction of the Measurement System
3.1. Sensor Design
The sensor pipe is made by glass fiber reinforced plastics (FRP), and six silver-plated copper ring-type electrodes are smoothly embedded on the inside wall of the insulator pipe. As is shown in Figure 3, the two most outside ring-type electrodes at both ends of the insulator pipe E1 and E2 are called incentive electrode, which are used to apply excitation to the conductivity sensor. The four ring-type electrodes in the middle of the insulator pipe are called upstream sensor composed of two ring-type electrodes B1 and B2 and downstream sensor made up of two ring-type electrodes C1 and C2. The up-stream sensor and downstream sensor output the signals that have been irregularly modulated by the fluid. The signal conditioning circuit blocks are used to amplify, filter and demodulate the signals that have been modulated by the mixed liquid. Then, the data used to calculate the flow will be sent to the computer to be analyzed and processed.
Many factors such as the material of the sensor, the size of the conductance sensor, the size of the ring-type
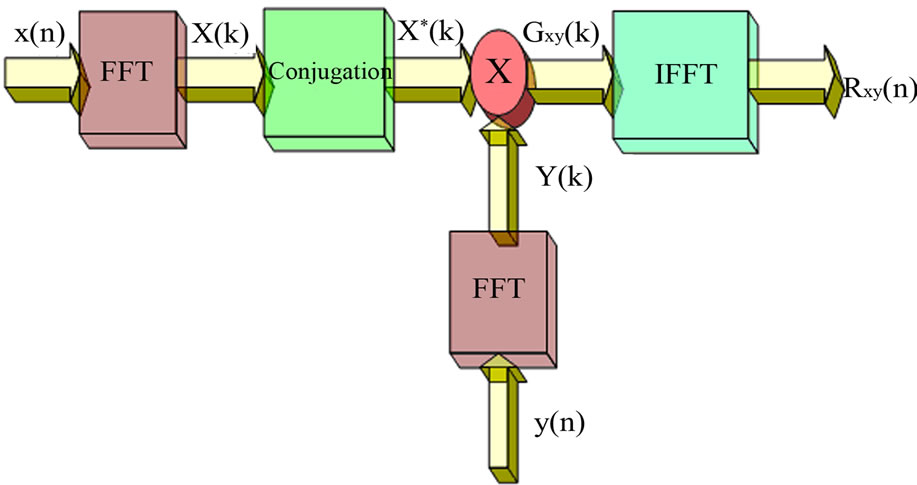
Figure 2. The correlation function calculation in frequency domain.
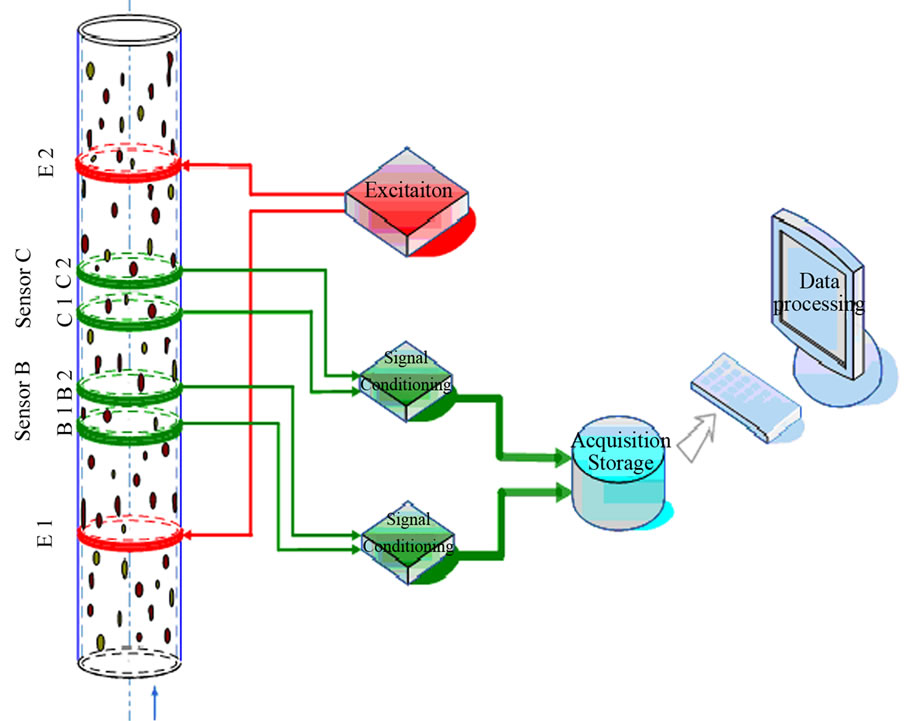
Figure 3. Conductance sensor measuring system.
electrodes and the distance between the rings will directly impact the sensitivity of the sensor and the reasonableness and the reliability of the measuring results. So how to get all the right parameters is very important. The ANSYS finite element software is used to simulate the distribution of the electric potential and give the reasonable parameters of the size of the ring-type electrodes and the distance between the rings. After the simulation is completed and the feasibility is demonstrated, the conductance sensor pipe can be made according to simulation results.
3.2. Construction of the Experimental System
It is necessary to set up a special simulated experimental system to verify the reasonability of the conductance sensor and the measurement scheme. First of all, we should mix the three-phase fluid as evenly as possible. Second, the conductance sensor must be installed in the pipeline system through which the mixed fluid will flow. Third, the fluid must be circulated in different ways and the waste liquid can be eliminated easily.
After considering all the factors, the experimental system was finally set up in the laboratory, which contains screw pump, frequency converters, air compressor, air purifier, flow control valve, check valve, spherical valve, flow steady devices, straight pipe, conductance sensor, standard flow meter, mass flow meter, gas meter, static mixer, mixing tank, recycling tank, plastic hose and so on. The schematic diagram of the system is shown in Figure 4, in which the S1 - S14 are spherical valves.
As the oil, gas and water must be mixed evenly according to the certain percentage during the experiments, some equipments are very important in the system such as the oil and water mixing tank, the air compressor supplying certain amount of gas, and the static mixer mixing the three-phase fluid. The amount of the oil and water can be measured before they are mixed in the mixing tank, and the gas will be measured by the standard gas meter before mixing with the oil-water two phase flows in the static mixer. In order to reduce the pulse interference of the fluid, oil-water mixed fluid and gas must be regulated by the steady regulator devices. Transparent pipes are installed in the pipeline system so as to observe the flow pattern of the fluid in real time. There are more than fourteen flow control valves installed in the pipeline system, so we can change the ways and directions of the mixed fluid whenever it is needed. The three-phase flow must be precipitated, separated and recycled after the experiments.
4. Experiment and Analysis
As water has the highest conductivity in the three-phase fluid, the water fraction is one of the most important parameters. Today, most of the oil fields in China are in a
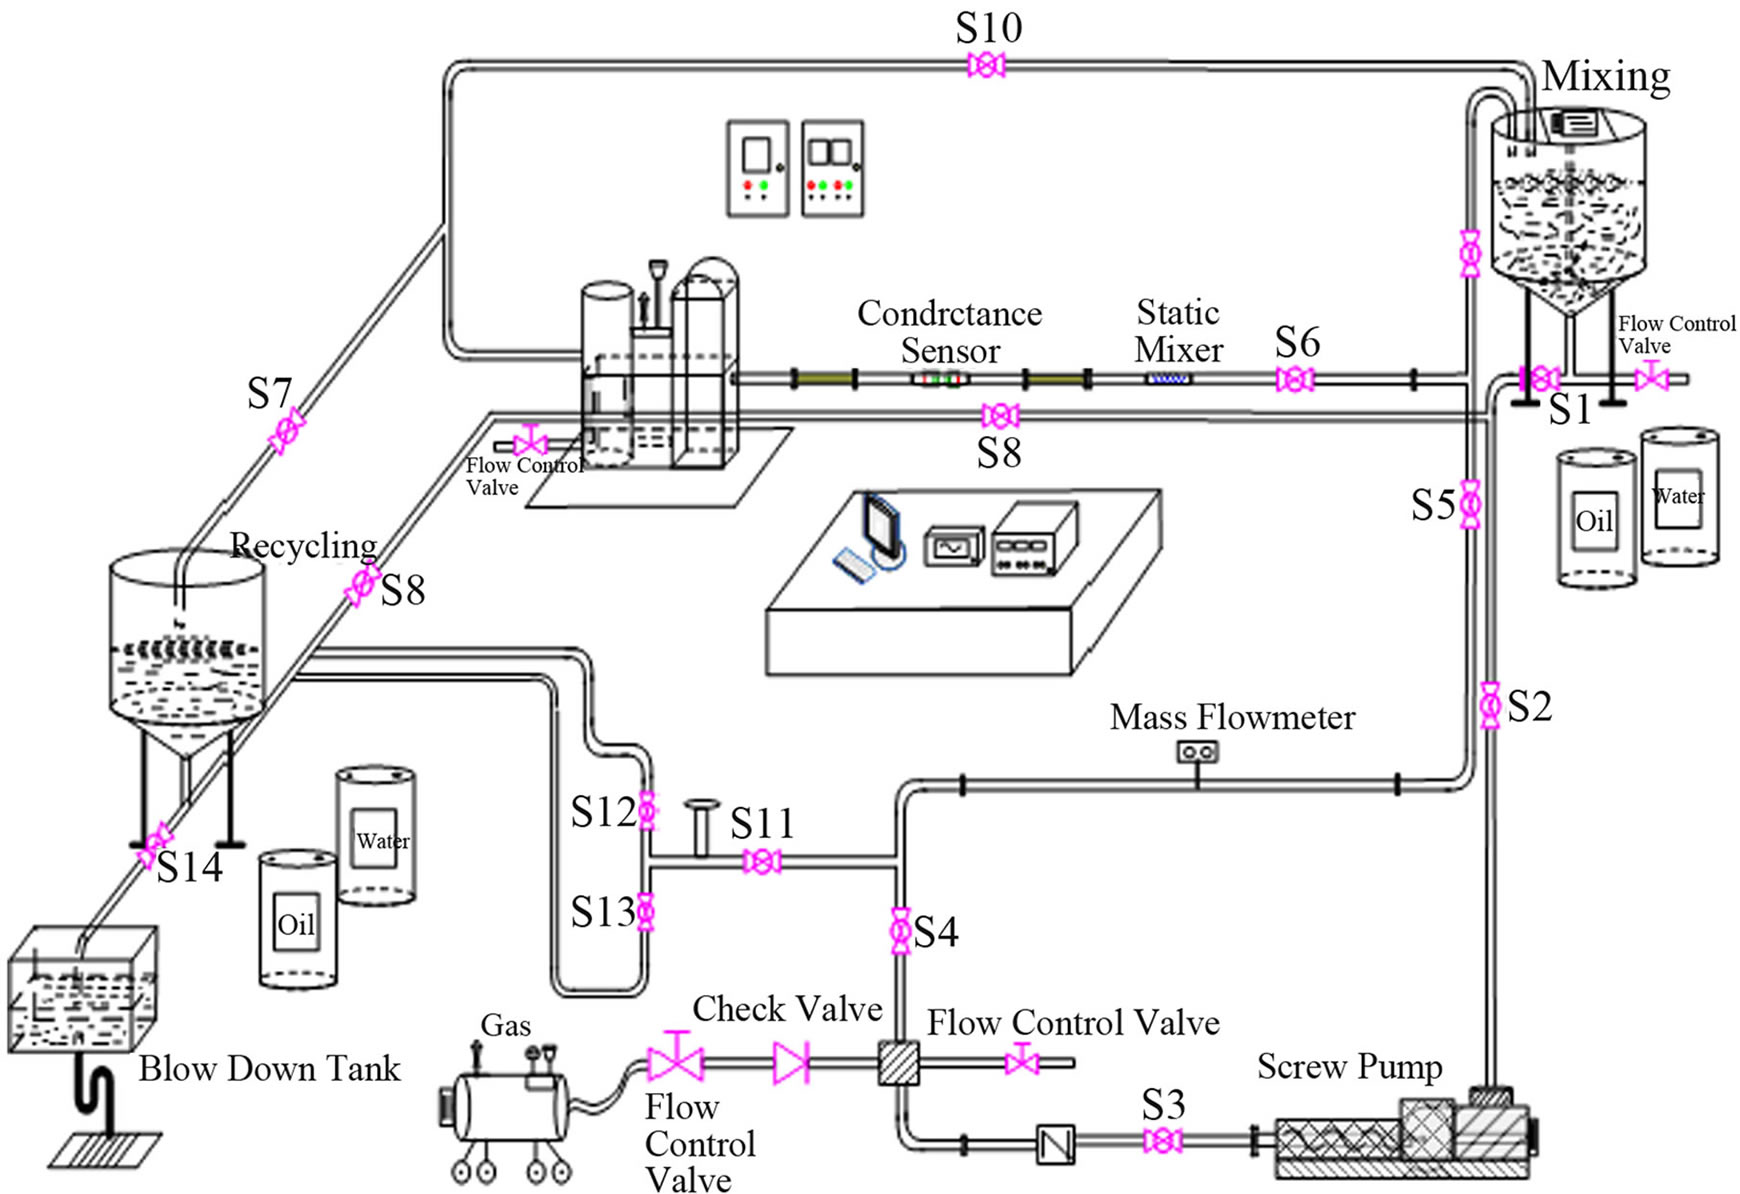
Figure 4. Experimental system.
high water fraction period. Therefore, the high water fraction experiments are meaningful, and the water fraction from 50% to 90% and the flow rate from 4.0 m3/h to 12.5 m3/h are chosen in the experiments.
The tests were carried out under the normal temperature and pressure, and a 20 KHz sine wave signal is applied to the conductance sensor. After adding oil and water that had been measured in the mixing tank, we must wait for a moment, because the oil and water must be mixed evenly before they flow into the cycle pipe of the testing system.
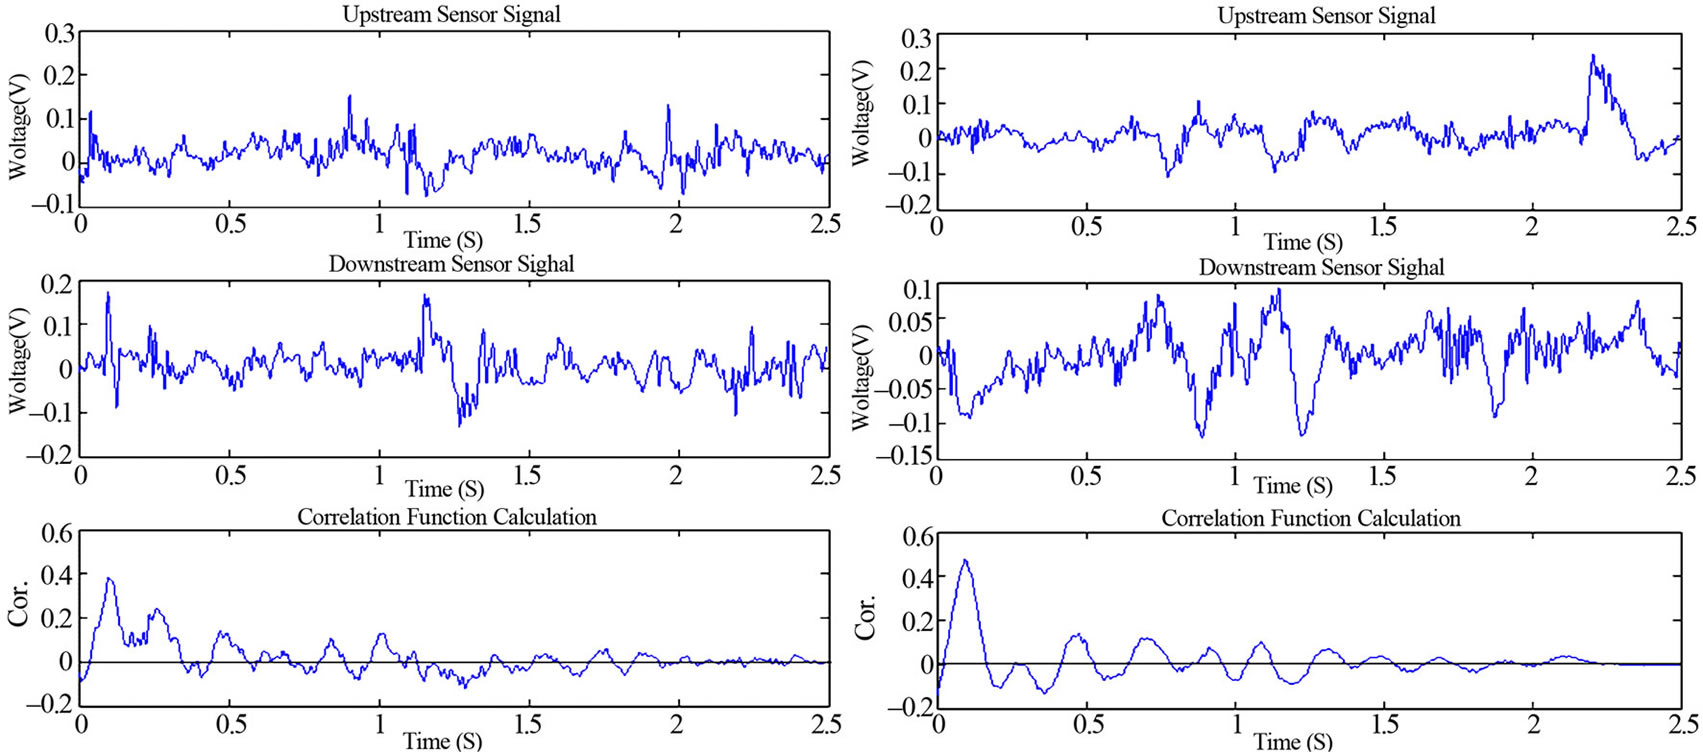
The demodulated flow signals were stored and then sent to the computer. As is shown in Figure 5, you can see the different results under different testing conditions. Figure 5(a) shows the flow waves and the results of the correlation function when the water fraction is 50% and the flow rate is 7.5 m3/h, Figure 5(b) shows the flow waves and the results of the correlation function when the water fraction is 80% and the flow rate is 7.5 m3/h, Figure 5(c) shows the flow waves and the results of the correlation function when the water fraction is 50% and the flow rate is 11.5 m3/h, Figure 5(d) shows the flow waves and the results of the correlation function when the water fraction is 80% and the flow rate is 11.5 m3/h.
After groups of testing, we can know that the measured results will be little different from the standard value when the velocity of the fluid is fast enough and the three-phase fluid is mixed evenly. But the errors of the measurement will be larger if the mixed fluid flows too slowly. The main reason for this phenomenon is that the oil, gas and water are different substances and there will be a slip velocity among them. In addition, the changes of the flow pattern will be more complex when the fluid flows slowly, and this will also affect the testing results directly. At the same time, we can see from the testing results that the changing of water fraction under the same flow velocity has little effect on the results of the measurements. The above results can be seen more clearly in Figure 6, which shows the flow rate tested results and the standard flow rate under different water fractions. So more work needed to be done to improve the testing system and the scheme.
5. Conclusion
The conductance sensor and the correlation measurement technology are used to measure the oil-gas-water threephase flow. After plenty of experiments had been carried out, we can come to a conclusion that it’s feasible to use the conductance sensor to measure the oil-gas-water three-phase flow rate. But we must pay attention to some
 (a)
(a)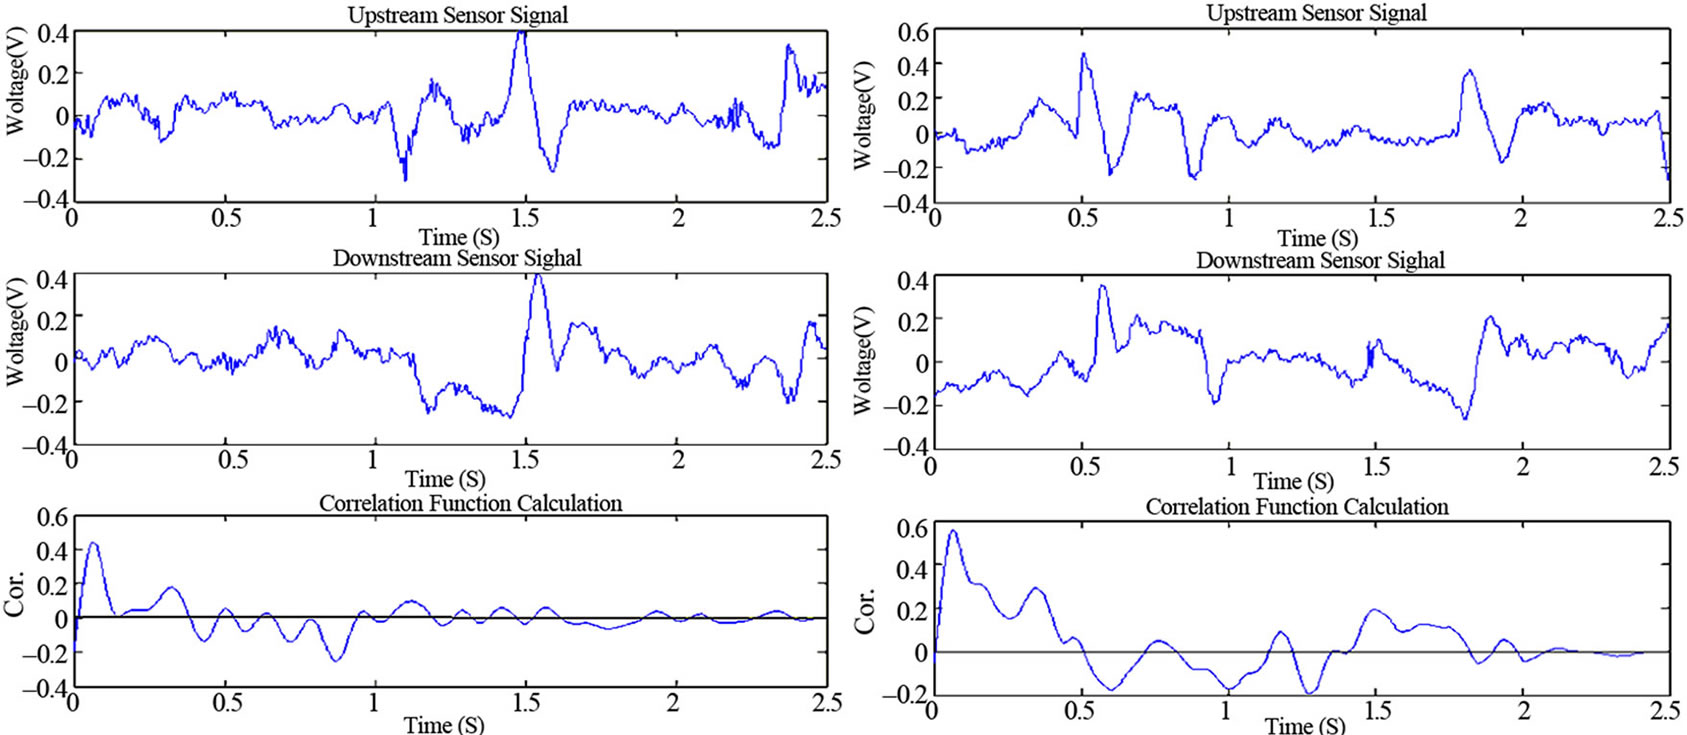 (b)
(b)
Figure 5. Flow signal waves and the results of the correlation operation.
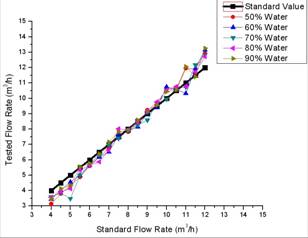
Figure 6. Tested flow rate and standard flow rate under various water fractions.
details. First of all, the water fraction is an important parameter in the three-phase flow rate measurement, and the fluid must contain enough water to make sure the rationality and the correctness of the results as water has the highest conductivity in the threephase flow. Second, the designing of the conductance sensor is so important that it can affect the testing results directly. Third, we must make sure that the indoor experimental system can mix the three-phase fluid evenly and supply enough flow velocity. And finally, data calculation and error correction method are very important and the appropriate method to process and correct the data is needed.
6. Acknowledgements
The author appreciates the support from the Shaanxi Province Education Department of China (No. 2010 JK786).
REFERENCES
- M. H. Butterfield, G. F. Bryant and J. Dowing, “A New Method of Strip Speed Measurement Using Random Waveform Correlation,” Transactions on Society of Instrument Technology, Vol. 13, No. 2, 1962, pp. 111-113.
- M. S. Beck, “Correlation in Instruments: Cross Correlation Flowmeter,” Journal of Physics E: Scientific Instruments, Vol. 14, No. 1, 1981, pp. 7-19. doi:10.1088/0022-3735/14/1/001
- R. Thorn, M. S. Beck and R. G. Green, “Non-Instrusive Methods of Velocity Measurement in Pneumatic Conveying,” Journal of Physics E: Scientific Instruments, Vol. 15, No. 11, 1982, pp. 1131-1139.
- M. S. Beck and A. Plaskowski, “Cross Correlation Flow meters—Their Design and Application,” Taylor & Francis, Bristol, 1987.
- G. P. Lucas, N. D. Jin, “Investigation of a Drift Velocity Model for Predicting Superficial Velocities of Oil and Water in Inclined Oil-in-Water Pipe Flows with a Centre Body,” Measurement Science and Technology, Vol. 12, No. 9, 2001, pp. 1546-1554.
- G. P. Lucas and N. D. Jin, “Measurement of the Homogeneous Velocity of Inclined Oil-in-Water Flows Using a Resistance Cross-Correlation Flow Meter,” Measurement Science and Technology, Vol. 12, No. 9, 2001, pp. 1529-1537.
- G. P. Lucas and N. D. Jin, “A new Kinematics Wave Model for Interpreting Cross Correlation Velocity Measurements in Vertically Upward, Bubbly Oil-in-Water Flows,” Measurement Science and Technology, Vol. 12, No. 9, 2001, pp. 1538-1545.
- L. A. Xu, “The State-of-Art and Developing Trend of Correlated Flow Measuring Techniques,” Process Automation Instrumentation, Vol. 9, No. 3, 1988, pp. 1-4.
- X. B. Liu, “Downhole Measurement of Oil/Water TwoPhase Flows,” Ph.D. Thesis, Harbin Institute of Technology, Harbin, 1996.
- J. H. Hu, X. B. Liu, et al., “A Conductance Sensor for Simultaneously Measuring Flowrate and Watercut in Oil/Water Two-Phase Flow,” Well Logging Technology, Vol. 26, No. 2, 2002, pp. 154-157.
- C. Jin and L. A. Xu, “Cross-Correlation Flow Measurement System Based on DSP,” Automation and Instrumentation, Vol. 14, No. 2, 1999, pp. 4-7.
NOTES
*Corresponding author.