International Journal of Clinical Medicine
Vol.5 No.7(2014), Article ID:44691,16 pages DOI:10.4236/ijcm.2014.57051
Racecadotril in the Treatment of Acute Diarrhoea in Adults. An Individual Patient Data Based Meta-Analysis
Benoît Coffin1, Habib Hamza2, Jean-Marie Vetel3, Philippe Lehert4,5*
1Hepatogastroenterology Department, Louis-Mourier Hospital, Colombes, France
2Clinique Taoufik, Tunis, Tunisia
3Geriatric Department, Centre Hospitalier du Mans, Le Mans, France
4Faculty of Economics, UCL Mons, Louvain, Belgium
5Faculty of Medicine, The University of Melbourne, Melbourne, Australia
Email: benoit.coffin@lmr.aphp.fr, fatma_hamza97@hotmail.fr, geriatrjm@yahoo.fr, *lehertphilippe@gmail.com
Copyright © 2014 by authors and Scientific Research Publishing Inc.
This work is licensed under the Creative Commons Attribution International License (CC BY).
http://creativecommons.org/licenses/by/4.0/


Received 27 January 2014; revised 26 February 2014; accepted 25 March 2014
Abstract
Racecadotril is an antidiarrhoeal drug with a pure intestinal antisecretory mechanism of action. Aim: To assess racecadotril efficacy, whatever its dose, versus placebo in adult acute diarrhoea. Methods: Individual Patient Data meta-analysis following multilevel mixed models testing of the significance of the treatment effect adjusted for baseline covariates. Diarrhoea duration was the common main criteria. Results: Four randomized clinical trials (n = 669) were identified with raw data. The clinical global impression evaluated at baseline by the physician was found to be the essential predictor influencing the outcome. As compared to placebo, the 100 mg dose, the minimum effective dose, induced a 80% increase of the recovered patient proportion at anytime (Hazard Ratio = 1.8 [1.3, 2.5], p < 0.001), a 60% increase of the responder proportion i.e. recovery within 3 days (p < 0.001), a 47% reduction of abdominal pain and nausea and an overall 33% decrease of sick days (p < 0.001). In conclusion, as compared to placebo, racecadotril induced several significant effects, such as reducing the diarrhoea duration, the number of stools and associated symptoms, leading to less lost productivity.
Keywords:Acute Diarrhoea, Racecadotril, Meta-Analysis

1. Introduction
1.1. Rationale
Worldwide, acute diarrhoea (AD) constitutes a major cause of morbidity and mortality, especially among the very young or very old patients. USA adults experience [1] 99 million episodes of AD or gastroenteritis, resulting in about 8 million physician visits and more than 250,000 hospital admissions each year (1.5% of adult hospitalizations). Most AD cases are caused by enteric infections but resolve spontaneously within a few days without needing antibiotherapy [2] . Both a number of unformed stools and the associated symptoms, such as abdominal pain and nausea/vomiting, are responsible for the loss of work days, which is the main cause of the massive annual cost of AD [1] .
Racecadotril (RC) is a pure intestinal antisecretory drug acting without antimotility effect, and with a safe profile [3] . Its efficacy in the symptomatic treatment of adult AD was analyzed in a meta-analysis based on literature (MAL) [4] findings that collected results summaries from articles through an adequate literature review, and aggregated the differences. The review based on 2 randomized trials (2619 patients) provided evidence of better efficacy—shorter diarrhoea duration (DD)—of RC when compared with placebo, and better safety when compared with loperamide (less constipation adverse effect).
1.2. Need for Individual Patient Data (IPD) Meta-Analysis
An IPD meta-analysis collects less studies than a MAL, due to the fewer number of studies with available raw data. Gathering the raw data related to all the existing trials assessing the studied drug, and restarting all the calculations based on the pooled data base is the only way:
a) to include all the patients with a true intent to treat basis. Old publications analysed by a MAL did not include some patient case report forms (CRF) despite a so-called “intention-to-treat” population analysis, due to missing efficacy data, thus disregarding a non negligible proportion of eligible patients;
b) to assess the influence of miscellaneous doses of RC;
c) to compare all the available studies with the same endpoints. Homogenising the definition and calculation of the considered endpoints alleviates difficulties for clinical interpretation of MAL results, which are based on various non comparable endpoints, pooling unitless effect sizes from different endpoints like DD, symptoms sum scores, stool output, or number of diarrhoeic stools;
d) to identify the baseline predictors of response to treatment; then, based on these baseline covariates, to test the invariance of the efficacy to baseline severity conditions and possible responder sub-groups.
2. Methods
Methods of the analysis and inclusion criteria were documented in a protocol previously endorsed by all the authors. The previous MAL [4] constituted our basis for selecting the studies. All the methodological components are summarized as follows.
The study selection was based on the following characteristics:
Participants greater than 18 years old, male or female, with AD were considered, whatever its presumed cause, excluding cholera, healthy volunteers, children, patients with chronic HIV-related diarrhoea, and subacute/ recurrent diarrhoea due to anticancerous chemotherapy;
Intervention: RC, adult formulation, without dosage restriction;
Comparator: was restrained to placebo in this study due to expected difficulties in gathering raw data;
Outcomes: DD from treatment onset to the last unformed stools, symptom check-lists, number of diarrhoeic stools;
Study: all randomized controlled trials, either double-blind or single blind studies. all published data, without restriction of language or year of publication, of an acceptable methodological quality, independently assessed by a review committee using a preferred domain-based evaluation of internal, external, and statistical validity.
Literature research was based on a pre-defined query program in the main data bases [4] . Risk of bias in individual studies was discussed on a MAL basis [4] in which the validity of each trial was evaluated by 4 reviewers.
The methodological aspects specific to the IPD context were:
2.1. Search of Raw Data
The availability of raw data of the studies identified in the previous MAL [4] constituted the major difficulty. This additional task for obtaining raw data was organized through personal contacts with the main authors of each study. In addition to the study selection determined in the MAL, the study selection was based on the acceptance of the investigator to provide raw data and on the quality of the raw data including exhaustivity of the recruited patients and the variables mentioned in the CRF. Although five studies were identified in the MAL (Baumer [5] , Vetel [personal communication], Hamza [6] , Moraes [7] , Coffin [personal communication]), we successfully obtained raw data for all the studies except for Moraes, thus our analysis was based on four studies.
2.2. Data Items
Raw data were extracted from each included trial and compared between each trial on: characteristics of trial participants (including age, severity and lengh of diarrhoea on inclusion), the trial’s inclusion and exclusion criteria; type of intervention (including nature of control group, dosage); type of outcome measure (including DD, frequency and nature of adverse events, such as secondary constipation).
Variables at recruitment and baseline visits were: study centre, treatment, age, gender, height, weight, body mass index (BMI, kg/m2), ethnic origin (Caucasian or not), DD before inclusion (hours), body temperature (˚C), number of diarrhoeic stools (NDS) in the last 24 hours before onset of treatment, and the presence of blood in stools as well as their liquid aspect. We also registered the following associated symptoms (present or not): anal burning, painful anal spasms (anal contracture), spontaneous abdominal pain, nausea, vomiting, anorexia, asthenia and insomnia, pain on abdominal palpation, abdominal distension and fever. The investigator reported a global evaluation of the severity of the acute gastroenteritis, the “Clinical Global Impression” (CGI), according to its impact level on usual activities of the patient (mild = without any impact on usual daily activities, moderate = inducing disturbance of usual activities or severe = making impossible usual activities leading the patient to stay at home). We also noticed recorded missed work days due to these symptoms.
The collected endpoints were DD and NDS, recorded from patient self-forms, except for the Hamza study, where evaluations took place at baseline, day 4 and day 6, but where day of recovery was approximated from self-assessment sheets. DD was calculated on the period between the first drug intake and the last unformed stool before recovery. Recovery was defined by the occurrence of two consecutive formed stools or no stool for 12 hours. DD constituted the first main endpoint. The associated symptoms and signs (the same as at baseline) were registered at the second visit. NDS was documented for all the studies through patient self-assessments or collected by the investigator following retrospective declaration of the patient at each visit, as well as duration of follow up, duration of medication, and end of trial status. Some patients were expected to interrupt the trial prematurely. The exact reason for this interruption was used to associate a patient with therapy failure or success.
2.3. Quality Control
The original CRFs were collected together with the original electronic data base, used for conducting the original statistical analysis. In addition, raw data were carefully quality-controled by comparison with the CRFs by using a binomial test based on a limiting quality fixed to 0.01 [8] .
2.4. Statistical Analysis
Further to the initial identification of available IPD studies, a statistical analysis plan was completed on the basis of the protocol, and approved by the IPD participants before the data base was made available to the statistician. The statistical analysis was performed with help of R statistical package (version 2.10.1) [9] .
2.4.1. Patient Evaluability
The Full Analysis Set was constituted by all the randomized patients irrespective of their outcome or premature interruption, in conformity with the Intent to treat. Any change on the treatment was considered as failure to treatment. Patients lost to follow up for unknown reason were right-censored. Per Protocol analyses were only carried out to verify the consistency between older studies analyzed following this principle and results from our IPD base.
2.4.2. Endpoints
The main endpoint was DD. Secondary endpoints were the NDS, the proportion of responders, defined as patients recovering in less than the median duration observed on the control group, and change in perceived symptoms. The above described symptoms were regrouped in two important groups: Pain Symptoms (PS = anal burning, anal contractures, abdominal pain, pain and palpitation, meteorism), and Nausea Symptoms (NS = nausea, vomiting, appetite loss). To provide an easy clinical interpretation, PS and NS were calculated as the number of symptoms. The Overall Symptom Score (OSS) was calculated as the sum of all symptoms and signs in attributing a 0 value if absent and a value of 1 if present, and divided by the number of symptoms and signs (thus varying between 0 = no symptom and 1 = all reported symptoms and signs). Symptoms were documented at baseline and final visits (between 10 and 14 days after baseline).
The number of missed workdays was compared using a Poisson linear model after identifying predictors through a stepwise procedure.
Analyses were restarted with the optimal dose alone, which was compared with placebo, eliminating the low and high doses.
2.4.3. Finding a Common Adjustment Model
One of the important advantages of an IPD meta-analysis is its ability to account for baseline difference among patients, thus adjusting for baseline severity, increasing power and clinical interpretation. Thus, before assessing the treatment effects, based on the whole data set constituted by the two studies, we constructed a general predictive model for the main endpoint (DD). All the baseline variables considered as clinically relevant potential predictors of DD entered a stepwise algorithm. Only variables with a significant effect (p < 0.05) were accepted into the model. This model was chosen to constitute a common adjustment basis for all the studies and all the analyses. Given the expected association of the secondary endpoints (see previous section) with DD and to adopt a uniform adjustment approach irrespective of the studied endpoint and study, we used the same model for the secondary analyses. For sensitivity purposes, we compared each result, using the whole model with only significant covariates.
2.4.4. Statistical Techniques
The meta-analysis was conducted according to IPD specific techniques. For all the analysed endpoints, we used a two-level multilevel model (patient/trial), by considering random treatment effect, fixed study effect, adjusting for baseline predictors. A General Linear Mixed Model was used [10] . We used a two-level multilevel model (patient/trial), by considering random Treatment effect, fixed study effect, adjusting for baseline predictors. By considering yij as the outcome variable of patient j in trial i, the following linear mixed model is used:

where Si designates a fixed trial effect, T is a fixed overall treatment effect supposed constant among trials, by an additional random effect specific trial τi distributed according to a normal distribution N(0, ), adjusted for a set (k = 1:n) of baseline covariates Zkij, γh to be estimated. Finally, the overall residual εij are assumed N(0,
 ), thus σ common to each treatment but varying across trials. The random centre effect was considered as fixed as relative sizes of treatment group remain similar between studies, and because random treatment differences already accounts for random trial effect.
For the main endpoint, we conducted a Cox proportional hazard using a frailty random factor, but we also conducted the Cox regression to study dose effect, and treatment effect, in adjusting for baseline covariates, by stratifying by studies [11] . For sensitivity purposes, non parametric estimates were calculated with and without stratification based on the log-rank test.
After finding this model, significant covariates were included into a final confirmatory model which added treatment, centre, and their first-order interactions with the selected covariates. This process is demonstrated not to inflate the type I error [12] . The first confirmatory model was tested without interaction, and first level interaction between covariates and treatment was added in secondary analyses, by considering interaction significant at statistical level p = 0.1, in order to identify possible differences of treatment efficacy according to particular values of covariates.
A responder analysis considered a responder to the therapy when DD was less than the median duration in the control group. The effect of dose and treatment on the proportion of responders was assessed by the above model through a General Linear Model featuring a logistic model.
NDS was analysed with a similar model featuring Poisson regression, by considering random treatment effect, fixed study effect, adjusting for baseline predictors. As overdispersion was possible, a quasi-Poisson approach was used when the dispersion parameter was larger than 2.
The effect of treatment on symptom improvement was tested according to the above General Linear Mixed Model in which intercept and treatment effect were considered as random across studies.
2.4.5. Supportive Analyses
The planned main model based on the risk of bias across studies was not re-tested in this analysis as this was already assessed [4] . The extent to which raw data should not be available, may induce a bias in unknown direction, thus our IPD results were compared with previous MAL results [4] presumed to have collected the exhaustive set of RCTs. A meta-regressions testing of the additional effect of the unavailable studies was conducted through a random effect model [14] using summary data.
2.4.6. Power and Sample Size
Through Monte-carlo techniques, based on a maximum of 1200 patients and five studies, we evaluated that hazard Rates as large as 1.20 and 1.50 should be detected at 0.95 and 0.999 level, associated with a constant power of 0.90. It was accepted that a Type I error of alpha = 0.001 for main effect was a reasonable value (as associated with a manifest clinically relevant HR = 1.5) to demonstrate a clinically relevant effect and to provide compelling results. As interaction effects need more power, they were considered as significant from level 0.05 in spite of the limited effect of this procedure, but in the absence of fixed assumptions [13] .
2.4.7. Missing Data Handling
Dealing with missing data was agreed in the study protocol and carefully specified in the Statistical Analysis Plan. For the above mentioned endpoints, missing data at end of the trial due to early interruption of the trial, the worst case scenario was used, in associating lost patients as therapy failures. Any patient lost before the end of the trial was regarded as a treatment failure, except for a reason unrelated to the pathology. Only when the reason of dropout was explicitly documented, did we proceed to determine whether or not the premature interruption was related to the pathology was determined blind to the treatment. No other missing data imputation was used for the studied endpoints.
2.4.8. Expression of Results
The main endpoint, DD, was expressed as hazard ratios (HR): ratio between the number of patients in the group of the considered treatment having recovered from diarrhoea at each time, was compared with placebo. The response was expressed as risk ratio (RR) defined as the ratio between the proportion of responders for two consecutive values of each predictor. Ratio were given with their 95% Confidence Interval (CI). Times were expressed in days.
3. Results
3.1. Description of Studies
Three studies (Baumer [5] , Vetel [personal communication], Coffin [personal communication]) were performed in France with outpatients visited by their general practitioners and the fourth (Hamza [6] ) was carried out in Tunisia with inand outpatients visited by their gastroenterologist.
The Vetel and Baumer studies shared the same design, except for the number of RC groups. The studies used the same definitions of inclusion and non inclusion criteria, the same primary efficacy criteria (DD), the same treatment and schedule. Vetel study assessed three doses of RC versus placebo, all the other studies compared the 100-mg dose with placebo, as this dose was considered as the adequate dose.
The Vetel and Baumer studies were older and the electronic data were not available. Their CRFs were fully retrieved, allowing a new data management from original data, and thus allowing new statistical analyses according to updated standards. Although both studies were conducted before the publication of ICH guidelines [15] , rules for Good Clinical Practice and the conduct of clinical trials were respected as these studies were conducted as pivotal studies for various national registration purposes [16] , and designed to comply with WHO [17] and FDA [18] . The Hamza study was a two-centre RCT study conducted in hospital in Tunis, with very similar selections and endpoints. The Coffin study was an unpublished study conducted during 2004-2005 with the aim to compare a new compound (dexecadotril) with RC and placebo (three arms study). Dexecadotril is not registered yet, but this study was eligible for our analysis, as RC and placebo were used as comparators. This study was conducted in general practice, under the ICH compatible Good Clinical Practices.
3.2. Patient Description
All the randomized patients of these four RCTs were considered as eligible for the analysis, irrespective of their outcome: the total number of patients was 669 (Table 1) and all the randomized patients were retrieved. Three dosages (30, 100 and 300 mg daily) were tested in the Vetel study (Table 1).
In the Baumer study [5] , RC-100 mg was compared with placebo: among 198 included patients, only 156 patients were analysed in the original analysis. Of these, 42 patients (21%) were excluded for the following reasons: premature treatment stop (38), major deviation (n = 1), lost to follow up (n = 3), stopping medication after 48 hours (n = 1). In the Vetel study (dose range study with RC 30, 100 and 300 mg versus placebo), of the 227 randomized patients, 196 patients were selected in the original analysis. Thirty patients were excluded from per protocol for the following reasons: no taken medication (n = 12), hours not filled by the patient (n = 2), no autoevaluation form (n = 7), lost to follow up before day 2 (n = 2). In the Hamza study, from 71 randomized patients, one was lost as refusal to continue for perceived lack of efficacy. In the Coffin study, a third arm (dexecadotril) was compared with RC and placebo, but not used here. All the randomized patients of the RC and placebo group (n = 173) were found and analyzed.
Population and diarrhoeal basal characteristics were homogeneous within studies and within therapeutic groups, as shown in Table 2. Some differences were observed between studies (Table 3).
3.3. Finding a Common Adjustment Model
Before assessing the treatment effects, based on the whole data set constituted by the two studies, we constructed a general predictive model for the main endpoint (DD), and we checked its consistency across the secondary endpoints (Symptom scores OSS, PS, and NS, NDS). All the baseline variables considered as clinically relevant potential predictors of DD entered a Cox Proportional hazard regression model, the selection of variable organized as a stepwise algorithm in which variables responsible for a significant decrease of Akaike Information Criterion were accepted into the model, and the study was used as a stratification variable [11] .
Only three variables were found as significant predictors (CGI, age and weight). CGI (considered as an ordinal scale): the more severe baseline status was associated with the longest duration (HR = 0.71 [0.63, 0.79] per severity grade). The next most significant factor was age which had negative effect (HR = 0.995, [0.989, 0.992]). The next factor was weight (HR = 0.993 [0.987, 0.997], p = 0.04). None of the other baseline variables were significant and no marked interaction was found significant. The same model incorporating CGI, age and weight was successfully tested for Symptoms and NDS and was considered as the adequate adjustment model for confirmatory analysis.
3.4. Treatment and Dose Effect
3.4.1. Main Endpoint
We first tested the dose effect of RC in comparing the three doses and placebo on DD (Table 4), in adjusting for

Table 1. Study by dose (sample size).
Table 2. Comparability between treatments.
Results expressed as (number of patients) and percentage, except for *: mean and SD; CGI = clinical global impression (impact level on usual activities of the patient).
baseline CGI, age and weight. The benefit of each dose compared with placebo were estimated by HRs. HR values of 1.40 [0.98, 2.00], 1.85 [1.54, 2.23] and 1.84 [1.28, 2.64] were found for low (30 mg), middle (100 mg) and high (300 mg) doses, respectively. The Minimum Effective Dose (MED) was identified through a stepdown algorithm in first comparing RC-300 with placebo (p = 0.003). This highly significant result allowed test of the 100 mg dose for which we found a borderline significant difference with HR = 1.479 (p = 0.05). As the 30 mg did not reach significance, the 100 mg was considered as the MED: it induced an 85% increase of the recovered patient proportion at anytime.
Table 3. Comparability between studies.
CGI = clinical global impression (impact level on usual activities of the patient).
Table 4. Dose and treatment effect versus placebo.
Cox proportional Hazards, Coefficient of Determination R2 = 0.168.
3.4.2. Overall Symptom Score (OSS), Pain (PS) and Nausea (NS) Symptoms Scores
We compared the three doses with placebo on change in time of OSS, PS and NS (Table 5) defined as the number of symptoms experienced by the patients estimated at 3 days after baseline (these indexes varying from 0 to 10).
All the symptoms decrease from baseline (Table 5). However, the final value depended on baseline severity and baseline CGI. For OSS, RR of 1.11 [1.09, 1.14] per level of baseline OSS was estimated, and ratio of 1.19 [1.11, 1.27] per baseline CGI. Irrespective of the initial level of baseline OSS and CGI, the studied drug reduced the final symptoms. The effect of each dose was compared with placebo: RR of 0.90 [0.75, 1.07], 0.73 [0.66, 0.80] and 0.65 [0.53, 0.80] were found for low (30 mg), middle (100 mg) and high (300 mg) doses respectively, corresponding to a reduction of symptoms of 10%, 27% and 35%, respectively. As for DD, the MED was identified through a stepdown algorithm in first comparing RC-300 with placebo (p < 0.001), allowing test of the 100 mg dose for which we still found a highly significant difference. As the 30 mg did not reach significance, the 100 mg was considered as the MED. This result was similar for the three considered indexes.
3.4.3. Secondary Endpoint: Responder Analysis
A patient was consideres to be responding to the therapy when time to end of diarrhoea was short. To quantify this, we considered that a recovery within elapsed time of at least the elapsed median observed in the placebo group should constitute a reasonable time. Over the four studies, the median DD (days) was 3.00 [Q1 = 2.00; Q3 = 5.00], and this median value did not significantly differ between studies. Given this constancy, we considered that recovering within the 3 days after taking the drug is considered as a success of the therapy.
We conducted a mixed model featuring a logistic regression by using treatment as random across studies. The RC-300 mg and RC-100 mg doses were significant, however, RC-30 mg was not (Table 6). As for the main endpoint, DD, the RC-100 mg dose was identified as the MED: it induced a 60% increase of the responder proportion (HR = 1.60 [1.37, 1.88]). We conducted sensitivity analyses in using 2 or 4 days as the cut-point to determine the definition of responder. The results were almost unchanged. Results from a logistic model instead of Poisson model provided the same significance of treatment effects.
Table 5. Overall symptom score (OSS), nausea & vomiting symptoms (NS) and abdominal pain symptoms (PS).
Values of reference = mean value of each symptom index, associated with a low severity baseline and low CGI value of zero.
Table 6. Responder analysis (occurrence of patient recovering within 3 days after baseline).
Non linear Poisson-Mixed model Meta-analysis, RC-100 versus Placebo. RR = risk ratio defined as the ratio between the proportion of responders for two consecutive values of each predictor. Linear Model, Sample Size = 669.
3.4.4. Number of Diarrheic Stools (NDS)
NDS during postbaseline was studied as the independent variable into a mixed model featuring Poisson regression, by considering constant and treatment effects as random across studies (Table 7). The baseline NDS was not found to be a significant predictor, however, the three other usual variables (age, baseline global evaluation) were confirmed as significant predictors. All the RC doses were found significantly better than placebo. In particular the RC-100 mg dose is characterized by a RR of 0.743, associated with a relative decrease of 26% compared with placebo.
3.4.5. Separate Efficacy of the 100 mg-Dose
The 100 mg dose was confirmed as the optimal dose through three differing endpoints. This dose was compared with placebo, in eliminating the low and high doses, and restarting the analyses. Results were almost identical based on 554 patients instead 669. We also conducted a Kaplan-Meyer survival and confirmed faster improvement in the group RC-100 mg, compared with placebo (Log Rank, p < 0.001). The survival curve (Figure 1) illustrates the faster recovery of patients, the difference decreasing until the 7th day after the onset of treatment.
Estimated median time to recovery were 2.86 days [2.68, 3.06] and 4.11 [3.79, 4.53] for RC and placebo, respectively: the median reduction time to recovery was 30.4 hours [25.2, 35.6]. Forest trees were calculated for evaluating the 100 mg dose compared with placebo over all the four studies: In particular, the proportion of recovered patients in the RC group was 80% higher than placebo: HR = 1.80 [1.30, 2,50], p < 0.001, Figure 2).
As for symptom scores, OSS was reduced by 23% compared with placebo (HR = 0.77 [0.68, 0.88], p < 0.001, Figure 3), and PS and NS were reduced by 47.1% (HR = 0.53 [0.43, 0.65], p < 0.001, Figure 4), 47.3% compared with placebo (HR = 0.53 [0.34, 0.82], p < 0.001, Figure 5), respectively.
3.4.6. Influence of Country and Ethnic Group
These trials have been conducted in various countries. In particular, a possible difference can be suspected between European countries and Tunisia. We tested this possibility in assessing the full factorial effect (study × treatment), thus including the main study and treatment effects, and their interaction, in considering the variable study as binary (1 = Tunisia, 0 = other countries). Results (Table 8) provide evidence of a non significant main country effect (HR = 1.27, p = 0.22), and a non significant interaction country-treatment (Hr = 1.00, p = 0.99).
Similarly, we tested the influence of ethnicity on results, a non negligible proportion of north-African patients (24.2%) being recruited in French studies. We assessed the full factorial effect (ethnicity × treatment), including the main ethnicity and treatment effects, and their interaction. Results (Table 9) provide evidence of a non significant main ethnicity effect (HR = 1.07, p = 0.72), and a non significant interaction ethnicity-treatment (Hr = 0.95, p = 0.82).
3.4.7. Sick Leave and Effect of Treatment
The mean number of sick leave days related with acute gastroenteritis counted from treatment start was 0.81 days (sd: 1.20, range: 0 - 6, quartiles [0.4, 0.8, 1.88]. The duration of post-treatment sick leave duration was compared among treatment groups by a Poisson regression adjusting for baseline CGI severity (Table 10).
Table 7. Number of diarrhoeic stools.
Poisson generalized linear model, RR = risk ratio defined as the ratio between the proportion of responders for two consecutive values of each predictor. Sample size = 668.
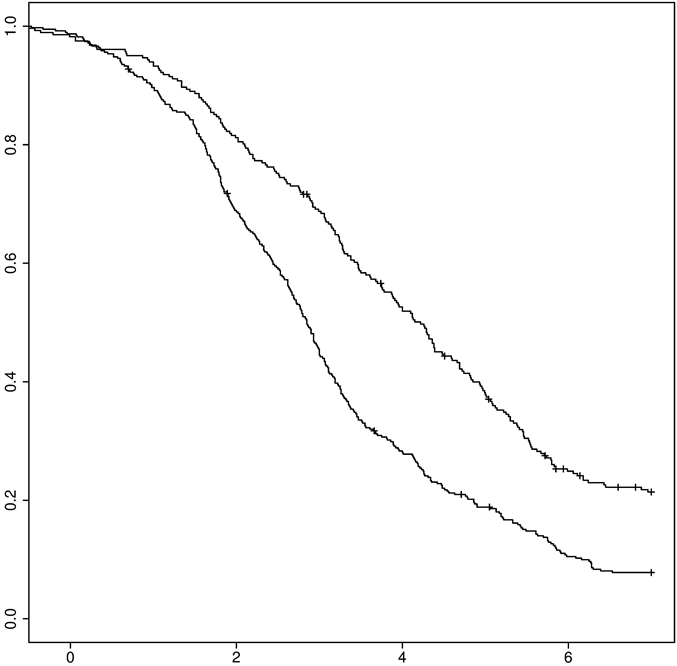
Figure 1. Kaplan-Meyer survival curve of diarrhoea: 100 mg-racecadotril (upper curve) versus placebo (lower curve), n = 554, p < 0.001.
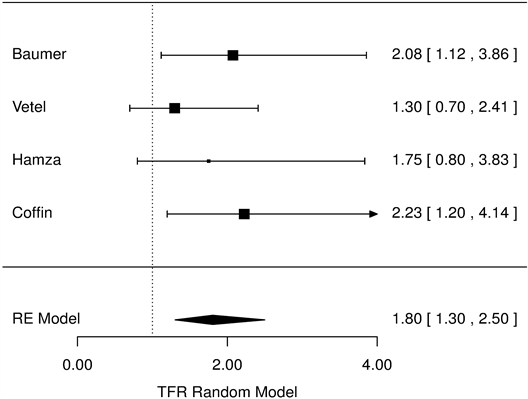
Figure 2. Diarrhoea duration, racecadotril-100mg versus placebo Forest Tree Hazard Risk n = 554; I2 = 0.23, p < 0.001.
The duration of sick leave is longer for patients with more severe baseline status (Ratio Rate: 1.204/CGI level, 95% CI 1.09-1.437, p = 0.039), whereas a beneficial effect was observed within the RC group compared with placebo (rR = 0.67, 95% CI 0.53-0.84, p < 0.001). An overall mean difference of −0.3 days (−0.5, −0.1, p < 0.001) was homogeneously observed among studies (Figure 6).
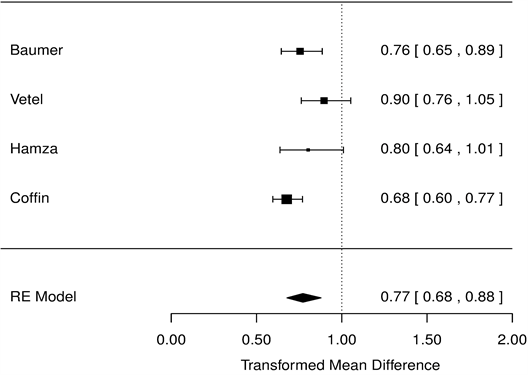
Figure 3. Mean overall symptom score, racecadotril-100 mg versus placebo forest tree hazard risk, n = 554; I2 = 0.27, p < 0.001.
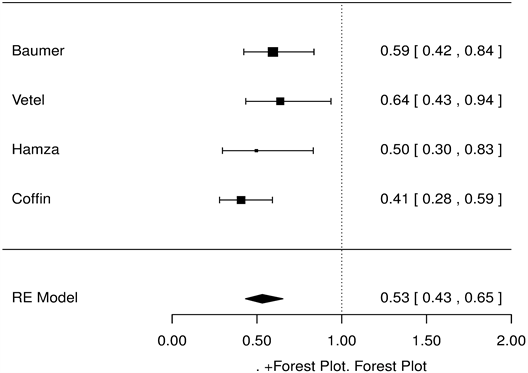
Figure 4. Pain symptoms, racecadotril-100 mg versus placebo forest tree hazard risk, n = 554; I2 = 0.31, p < 0.001.
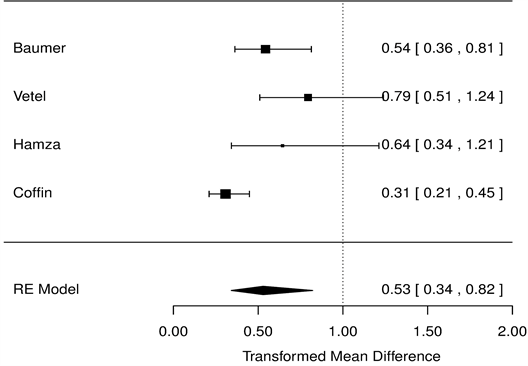
Figure 5. Nausea symptoms, racecadotril-100 mg versus placebo forest tree hazard risk, n = 554; I2 = 0.37, p < 0.001.
Table 8. Interaction tunis * treatment.
Final Results of Stepwise. Cox proportional Hazards, n = 669.
Table 9. Interaction ethnic group * treatment.
Final results of stepwise. cox proportional hazards, n = 669.
Table 10. Sick leave duration.
Poisson regression, Sample size = 611.
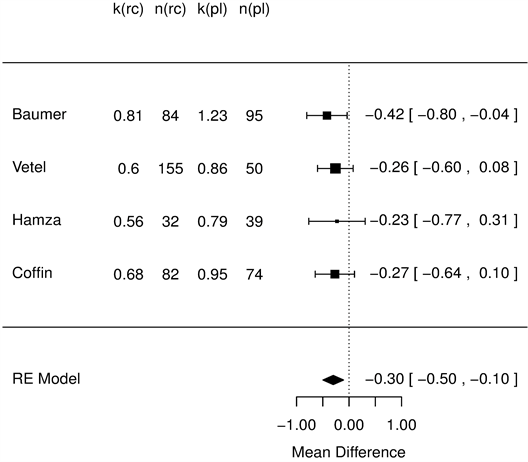
Figure 6. Sick leave duration (days), racecadotril-100 mg versus placebo forest tree hazard risk, n = 554; I2 = 0.02, p < 0.001.
4. Discussion
Our decision to review racecadotril effects in adult gastroenteritis was first justified by the necessity of analysing data on a strict intent to treat basis, instead of a per protocol by excluding many cases, as was done in the original analysis of these trials. To our knowledge, this work constitutes the first meta-analysis on this subject. It is based on four studies and 669 patients. Furthermore, thanks to the investigators efforts to gather all the original data, all the individual patient data were fully available.
As the original data were available, we were able to compare the treatment groups in homogenising the definition and calculation of the considered endpoints. In particular, DD was strictly calculated with the same definition of diarrhoea remission. This was also the case for all the other endpoints including the Symptom scores. In each study, the original analysis did not evaluate all the endpoints, in this analysis five endpoints (DD, OSS, PS, NS, NDS) were found over all the studies and compared among treatment.
An adequate comparison between treatment must account for the expected influence of baseline conditions on the studied outcome. Again, the available data on baseline provided us with the possibility of identifying predictors of outcome, for an appropriate adjustment for baseline severity. We found three important predictors: the first is the baseline clinical global evaluation of the investigator, the better the CGI at baseline, the better the predicted result. To a lesser extent, Age and Weight constituted two other independent predictors.
Based on these predictors, we adjusted all the results, and we found consistent efficacy of RC compared with placebo for the five considered endpoints. This analysis is important as it eliminates the influence of the important predictors that may have confounding effects, even in the context of RCTs. The number of patients remained limited.
Knowing the existence of predictors (CGI, age, weight), we tested the interaction with treatment and we did not found any significance for these factors. This means that the efficacy of the tested drug compared with placebo is apparently not different in particular sub-groups of patients, but remains constant, irrespective of the baseline value of the predictors.
In a similar context, we also tested possible interaction in assessing the effect of non-European trials or ethnicity: for both variables, the interaction was not significant, providing evidence that irrespective of the country or ethnicity of the patients, the relative efficacy of RC compared with placebo does not change. This provides some sign that the beneficial effect of racecadotril compared with placebo might be independent of the ethnicity and cultural diversity between countries, characterized by different medical practices.
Our main endpoint was DD considered as the most clinically relevant endpoint for adults. At the opposite of childhood diarrhoea potentially threatening life by dehydration, diarrhoea in adults is mainly causing disturbance in quality of life or involve difficulty or impossibility of work. We considered the other endpoints as secondary and supportive.
The separate analysis of the RC-100 mg dosage over the four studies demonstrated a HR of 1.80 [1.30, 2.50, p < 0.001]. That is, patients treated by RC-100 mg were characterized by a duration which was almost twice shorter.
In secondary endpoints, the relevance of the RC-100 mg was confirmed by 60% more patients observed to recover within a clinically relevant maximum duration of 3 days in the RC-100 mg compared with placebo. The severity of the symptom score was highly significantly reduced in the RC groups, and the RC-100 mg in particular, and the number of stools observed during the post-baseline period were also found significantly lower for the three RC dosages compared with placebo.
These results carried out on a Full Analysis Set, considering all the randomized patients irrespective of their outcome, provide evidence of the efficacy of RC in reducing time and severity of diarrhoea, the RC-100 mg considered as the MED providing a clinically relevant effect of the treatment compared with placebo. The 30-hours reduction of the median time to recovery may be compared to results from RCT including another safe antidiarrhoeal drug: diosmectite induced a 15.2 hours reduction, without significant effect on other parameters such as nausea or abdominal pain [19] .
Finally, we were able to provide some pharmaco-economic results in showing that RC seems to reduce sick leave from 33% compared with placebo, and this effect was shown through the mediation effect of a reduction of both the Pain and Nausea symptoms. Although the four RCTs did not included a direct economic analysis, nor allowed a retrospective cost calculation due to lack of socioprofessional data, one can speculate on the consequences of the sick leave reduction. Estimating the cost of “intestinal infectious diseases”, Garthright [1] underlined the magnitude of indirect cost: each no hospitalized case for which a physician was consulted, lost productivity induced a cost of 261 US dollars for a total of 348 US dollars per case (including all medical costs). With a 33% reduction of missed workdays, the productivity lost should be down to 175 US dollars, reducing the total cost of 86 US dollars per case. This estimation came from 1985 records [1] and should be updated.
5. Conclusion
The best predictor of an adult AD is the baseline clinical global impression by the physician. As compared to placebo, racecadotril induced several significant effects, such as reducing the diarrhoea duration, a number of stools and associated symptoms, leading to less productivity lost, the main source of AD cost.
Funding & Conflict of Interest Statement
This research received no specific grant from any funding agency in public, commercial or not-for-profit sectors. Authors have declared no competing interests exist.
References
- Garthright, W.E., Archer, D.L. and Kvenberg, J.E. (1988) Estimates of Incidence and Costs of Intestinal Infections Diseases in the United States. Public Health Reports, 103, 107-115. http://www.ncbi.nlm.nih.gov/pmc/articles/PMC1477958/
- Baldi, F., Bianco, M.A., Nardone, G., Pilotto, A. and Zamparo, E. (2009) Focus on Acute Diarrhoeal Disease. World Journal of Gastroenterology, 15, 3341-3348. http://dx.doi.org/10.3748/wjg.15.3341
- Eberlin, M., Mück, T. and Michel, M.C. (2012) Comprehensive Review of the Pharmacodynamics, Pharmacokinetics and Clinical Effects of the Neutral Endopeptidase Inhibitor Racecadotril. Frontiers in Pharmacology, 93, 1-16.
- Vetel, J.M., Hamza, H., Coffin, B. and Lehert, P. (2014) Racecadotril Efficacy in the Symptomatic Treatment of Adult Acute Diarrhoea. A Systematic Review and Meta-Analysis. International Journal of Clinical Medicine, in press.
- Baumer, P., Danquechin-Dorval, E., Bertrand, J., Vetel, J.M., Schwartz, J.C. and Lecomte, J.M. (1992) Effects of Acetorphan, an Enkephalinase Inhibitor, on Experimental and Acute Diarrhoea. Gut, 33, 753-758. http://dx.doi.org/10.1136/gut.33.6.753
- Hamza, H., Ben Khalifa, H., Baumer, P., Berard H. and Lecomte, J.M. (1999) Racecadotril versus Placebo in the Treatment of Acute Diarrhoea in Adults. Alimentary Pharmacology & Therapeutics, 13, 15-19. http://dx.doi.org/10.1046/j.1365-2036.1999.00002.x-i1
- Moraes, E., Chinzon, D., Coelho, L.G., Fernandes, T.F., Haddad, M.T. and the Brazilian Racecadotril Investigators Research Group (2001) A Multicentric, Randomised, Investigator-Blind, Parallel Group Study to Assess the Efficacy, Safety and Tolerability of Racecadotril versus Saccharomyces boulardii in the Treatment of Acute Diarrhoea in Adults. [Estudo Multicentrico de Grupos Paralelos, Randomizado, Cego para o Investigator, para Avaliar a Eficacia, Segurança e Tolerabilidade do Racecadotril versus Saccharomyces boulardii no tratamento da diarreia aguda em adultos]. Revista Brasileira de Medicina, 56, 65-74.
- Duncan, A.J. (1986) Quality Control and Industrial Statistics. 5th Edition, Irwin, Homewood.
- Core Team, R. (2013) A Language and Environment for Statistical Computing. R Foundation for Statistical Computing, Vienna. http://www.R-project.org/
- Higgins, J.P., Whitehead, A., Turner, R.M., Omar, R.Z. and Thompson, S.G. (2001) Meta-Analysis of Continuous Outcome Data from Individual Patients. Statistics in Medicine, 20, 2219-2241. http://dx.doi.org/10.1002/sim.918
- Tudur-Smith, C. and Williamson, P.R. (2007) A Comparison of Methods for Fixed Effects Meta-Analysis of Individual Patient Data with Time to Event Outcomes. Clinical Trials, 4, 621-630. http://dx.doi.org/10.1177/1740774507085276
- Edwards, D. (1999) On Model Prespecification in Confirmatory Randomized Studies. Statistics in Medicine, 18, 771- 785. http://dx.doi.org/10.1002/(SICI)1097-0258(19990415)18:7<771::AID-SIM80>3.0.CO;2-E
- Durand, C.P. (2013) Does Raising Type 1 Error Rate Improve Power to Detect Interactions in Linear Regression Models? A Simulation Study. PLoS ONE, 8, e71079. http://dx.doi.org/10.1371/journal.pone.0071079
- DerSimonian, R. and Laird, N. (1986) Meta-Analysis in Clinical Trials. Controlled Clinical Trials, 7, 177-188. http://dx.doi.org/10.1016/0197-2456(86)90046-2
- ICH E9 (1998) Statistical Principles for Clinical Trials.
- Good Clinical Practice (1987) Les Bonnes Pratiques Cliniques. Bulletin Officiel no. 87-32bis.
- WHO (1987) Guidelines for Planning Clinical Trials in Diarrhoeal Diseases. WHO/CDD/CMT/87.2.
- FDA (1977) Guidelines for the Clinical Evaluation of Antidiarrheal Drugs, HEW (FDA) 78-3049.
NOTES

*Corresponding author.