Open Journal of Medical Imaging
Vol.3 No.3(2013), Article ID:37127,7 pages DOI:10.4236/ojmi.2013.33011
Detectability of Renal Arteries in Living Renal Donors Using Multi-Detector CT: Comparison among Axial and Three-Dimensional Reconstruction Images
1Department of Diagnostic Imaging and Nuclear Medicine, Tokyo Women’s Medical University, Tokyo, Japan
2Department of Radiology, National Center for Global Health and Medicine, Tokyo, Japan
3Department of Urology, Tokyo Women’s Medical University, Tokyo, Japan
Email: *marimari@rad.twmu.ac.jp
Copyright © 2013 Mari Kohno et al. This is an open access article distributed under the Creative Commons Attribution License, which permits unrestricted use, distribution, and reproduction in any medium, provided the original work is properly cited.
Received April 21, 2013; revised May 21, 2013; accepted June 6, 2013
Keywords: Renal Transplantation; Laparoscopic Nephrectomy; MDCT; Renal Arteries; The ROC Analyses
ABSTRACT
Purpose: The purpose was to compare the effectiveness of MDCT reconstruction methods that improve detectability for detecting the renal arteries in patients undergoing laparoscopic nephrectomy irrespective of the ability of the radiologist. Methods: 128 patients with left nephrectomy and either one or multiple renal arteries were enrolled. Radiologists with varying levels of expertise (5 board-certified and 3 non-certified) interpreted all MDCT images, including axial, VR and MIP images, independently and determined the numbers of renal arteries. The interpretation times, sensitivity, specificity and diagnostic accuracy rates were analyzed. A receiver operating characteristic analysis was used to compare the results from the various reconstruction methods. Results: At surgery, there were 156 arteries: 101 donors had one renal artery and 27 had multiple arteries. The interpretation time for board-certified radiologists was shorter than that for non-certified radiologists, and the interpretation time using MIP images was significantly shorter than that of using the other reconstruction methods. The sensitivity, specificity and diagnostic accuracy on axial images were significantly higher than those on other images. The average Az value for detection of the numbers of renal arteries using axial images was higher than that of using other images. Conclusion: MDCT is helpful in reviewing the numbers of donated renal arteries for radiologists with different levels of expertise, and different types of reconstructions.
1. Introduction
Renal transplantation improves the prognosis of patients with chronic renal failure. Living-related renal transplantation with laparoscopic nephrectomy, which was first reported in 1995, reduces postoperative pain, allows shortened hospital stays, and costs less than open surgery [1,2]. Because the operative field of laparoscopic nephrectomy is more limited than that of open surgery, the field is more difficult to visualize during the former procedure [3,4], which can lead to vascular complications (e.g., hemorrhage and inadvertent ligation of donated vessels). It is therefore very important to prepare vascular mapping preoperatively, including the number of renal arteries and their branching patterns. Multi-detector computed tomography (MDCT) angiography is highly accurate for detecting the number of renal arteries and not invasive like other types of examinations (e.g., DSA) [5- 8].
Although there have been few reports comparing the effectiveness of the reconstruction methods using different thicknesses of preoperative CT [9], and there have been no studies at all on the differences in the detectability of renal arteries between axial images, volume rendering (VR) and maximum intensity projection (MIP), or on the relationship between these reconstruction methods and the level of experience of the radiologist. If it could be determined which reconstruction methods improve the detectability of arteries irrespective of the experience of the radiologist, then it would be possible for all radiologists to accurately review the renal artery images and reduce the complications of laparoscopic nephrectomy.
The left kidneys are often preferred for living renal transplantation due to a difference in their anatomical structure—that is, the left renal veins are longer than the right ones, and thus surgeons can remove and transplant the left kidney more easily [10,11]. Therefore, we selected only studies employing left nephrectomy for this analysis.
The purpose of our study was to detect reconstruction methods that improve detectability of renal arteries after laparoscopic nephrectomy irrespective of the ability of the radiologist.
2. Methods and Materials
2.1. Patients
This was a retrospective cross-sectional study. Between September 2008 and July 2010, 136 living renal donors were referred for MDCT examinations at our institute and underwent laparoscopic nephrectomy for the purpose of living renal transplantation. Among these donors, 8 donors with right nephrectomy were excluded. The frequency of anomalies of the left renal artery is higher than that of anomalies of the right, and this higher frequency of anomalies is the reason that the left renal arteries have a higher rate of detection than the right ones [12]. For the present analysis, we selected only studies employing left nephrectomies, because the purpose of this study was to detect reconstruction methods that improve the detectability of renal arteries regardless of the ability of the radiologist. One hundred and twenty-eight patients (44 men and 84 women; age range: 30 - 75 years; median age: 57 years; mean age: 55.3 years) were enrolled in the study.
2.2. MDCT Protocol
In all 128 donors, CT images were obtained using 16-MDCT scanners (in 77 patients an Aquilion 16 (Toshiba Medical Systems, Otawara) was used and in 51 patients a Light Speed 16 (General Electric Medical Systems, Milwaukee, WI) was used).
Unenhanced CT scans were obtained with 5-mm collimation covering from the diaphragmatic dome to the kidney. After unenhanced CT scans, arterial phase scans covering from the celiac axis to the kidney, and venous phase scans covering from the diaphragmatic dome to the bifurcation of the common iliac artery were obtained.
Nonionic contrast materials (Iohexol [Omnipaque®] 100 mL, 300 mgI/mL, Daiichi Sankyo, Tokyo, Japan; Iopamidol [Iopamiron®] 100 mL, 300 mgI/mL, Bayer Schering Pharma, Berlin, Germany; Iopamidol [Iopamiron®] 100 mL, 370 mgI/mL, Bayer Schering Pharma; and ioversol [Optiray®] 75 mL, 320 mgI/mL, Mallinckrodt, St. Louis, MO) were injected into the donor’s antecubital veins through a 20-gauge peripheral IV line using power injectors. Equal amounts of each contrast agent per unit of body weight, 500 - 600 mgI/kg, were used, and the injection rate was 2.5 - 3.5 mL/sec in all cases. The estimated dose was determined on the basis of total patient body weight as follows: weight of less than 45 kg, 75 mL 320 mgI/mL; 45 - 60 kg, 100 mL 300 mgI/mL; 60 - 70 kg, 100 mL 370 mgI/mL; more than 70 kg, 100 mL 300 mgI/mL. Bolus tracking imaging was performed 25 - 30 sec after the start of contrast material injection into the vein using a power injector. The arterial phase scan was started 10 sec after the triggering level of the abdominal aorta reached +100 Hounsfield units (HU). The portal phase scan started 90 sec after injection of contrast material.
Reconstruction parameters were a 1 mm slice thickness with a 0.938 mm slice pitch on Toshiba Medical systems and a 1.25 mm slice thickness with a 0.938 mm slice pitch on GE medical systems.
Thin-section axial images were transferred to a workstation installed with a PC-based three-dimensional (3D) program. Individual data were loaded into the 3D program, and were reformatted into 3D images including MIP and VR. VR was set at 30˚ and MIP was set at 15˚ intervals, and they were rotated toward the horizontal. The reason that the rotation angle of MIP was different from that of VR was that MIP images show the identical information on the reverse side.
2.3. Image Processing and Data Analysis
2.3.1. Detection Rates of Renal Arteries in Living Renal Donors Using MDCT
Two experienced abdominal radiologists (M.K., T.T.), who had no knowledge of the laparoscopic surgical results, reviewed all images including axial images, VR images and MIP images, retrospectively, and assessed the numbers of renal arteries in all 128 living renal donors. The locations of the main renal arteries and accessory arteries were compared with operative records of laparoscopic surgery, and the total numbers of left renal arteries in living renal donors were compared to those in the operative records. The sensitivity, specificity and diagnostic accuracy rates were then calculated on the basis of the two radiologists’ evaluations, and if there was a discrepancy between the two radiologists, they decided with consensus.
2.3.2. Overall Performance of Axial MDCT Images and Reconstruction Images
Two donor groups (group 1: 24 donors with a single renal artery; group 2: 24 donors with two renal arteries) were selected from the study population at the median age (group 1: 53.7 years; group 2: 53.2 years). Eight radiologists (5 radiologists board-certified by the JRS (Japanese Radiological Society) with 10 - 20 years of experience and 3 non-certified radiologists with 3 - 4 years of experience) interpreted three types of CT images independently in each group and determined the numbers of left renal arteries. Interpretation times, sensitivity, specificity and diagnostic accuracy rates were analyzed. Next, the receiver operating characteristic analysis (ROC analysis) was used to compare the results from the various reconstruction methods. The radiologists decided the grade of likelihood of different numbers of renal arteries on an eleven-point confidence scale: 0 = definitely one artery; 5 = probably but not definitely one or two arteries; 10 = definitely two arteries. The method of Hanley and McNeil was used for the paired testing of the significance of differences in the area under the ROC curve (Az) [13].
For the ROC analyses, accuracy was measured by the area under the ROC curve for each group with MedCalc, and was compared between the two groups and reconstruction methods. We evaluated the interpretation times, sensitivity, specificity and diagnostic accuracy rates for the detection of renal arteries; these parameters were compared among axial, MIP and VR images. In addition, the interpretation times and diagnostic accuracy rates were compared between board-certified radiologists and non-certified radiologists.
2.4. Statistical Analysis
For the comparison of continuous variables, an unpaired t-test was used. For categorical variables, Fisher’s exact and chi-square tests were applied. For comparison of two parameters, an unpaired t-test was used. For statistical analyses, analysis programs including JMP (version 9.0.2; SAS Institute Japan, Tokyo, Japan) and MedCalc (Version 11.6.1; MedCalc Software, Mariakerke, Belgium) (for ROC curves) were used. For all studies, a p value of <0.05 indicated a statistically significant difference.
This study had the approval of IRB on February 27, 2012.
3. Results
3.1. Image Processing and Data Analysis
3.1.1. Detection Rates of Renal Arteries in Living Renal Donors Using MDCT
At surgery, there were 156 arteries in 128 donors: 101 donors (78.9%) had one renal artery and 27 donors (21.1%) had multiple arteries: two arteries in 26 donors (20.3%) and three arteries in one donor (0.8%).
By MDCT image review with consensus of two radiologists, axial images identified 155 of 156 arteries (99.4%, 127 donors out of 128 donors), whereas both VR images and MIP images identified 147 of 156 arteries (94.2%, 119 donors out of 128 donors). All single arteries were correctly identified in axial, VR and MIP images. Among the 26 donors who had one regular plus one supernumerary arteries, seven donors were missed with VR and MIP images; one was missed with axial, VR and MIP images; one was missed with only VR images; and one was missed with only MIP images. For the donor who had one regular plus two supernumerary arteries, one of one regular plus two supernumerary arteries was missed with VR and MIP images. In addition, one of 26 donors with supernumerary arteries was not identified with axial images even retrospectively.
The diameters of the arteries missed with VR images (n = 9) ranged between 1.7 and 4.4 mm (median: 2.5 mm; average: 2.7 mm), and the distance between the main artery and accessory artery was 0 - 15 mm (median: 9.0 mm; average: 8.6 mm). The diameters of the arteries missed with MIP images (n = 9) ranged between 1.7 and 4.4 mm (median: 2.6 mm; average: 2.8 mm), and the distance between the main artery and accessory artery was 0 - 15 mm (median: 7.5 mm; average: 7.5 mm).
3.1.2. Overall Performance of Axial MDCT Images and Reconstruction Images
The interpretation time with MIP images (13.7 ± 12.4 sec) was significantly shorter than that by either axial images (16.7 ± 12.4 sec) or VR (16.4 ± 13.2 sec) images overall. The interpretation time for board-certified radiologists (axial images: 12.9 ± 8.1 sec; MIP images: 10.5 ± 9.9 sec; VR images: 13.6 ± 11.1 sec) was shorter than that for non-certified radiologists (axial images: 22.9 ± 15.5 sec; MIP images: 19.1 ± 14.3 sec; VR images: 21.2 ± 15.0 sec). In both groups, the interpretation time with MIP was shortest. In the comparison of the different reconstruction methods, there was a significant difference in interpretation time between the MIP images and VR images for the certified radiologists (p = 0.001), between axial images and MIP images for the certified radiologists (p = 0.002) and between axial images and MIP images for the non-certified radiologists (p = 0.011).
In the comparison between interpretation times required for board-certified radiologists and those required for non-certified radiologists, the interpretation times for non-certified radiologists using axial images, MIP images or VR images were significantly longer than those required for certified radiologists (p < 0.05) (Table 1). In addition, the interpretation time using MIP images was shorter than that using other reconstruction methods (board-certified radiologists: p < 0.05 by all methods; non-certified radiologists: p < 0.05 between axial and MIP images) (Table 1).
The sensitivity and specificity with axial images was higher than either MIP images or VR images by both board-certified radiologists and non-certified radiologists. Although there was also no difference in specificity among axial images, MIP images and VR images by board-certified radiologists, there was a difference in specificity between axial images, MIP and VR images by non-certified radiologists (Table 2).
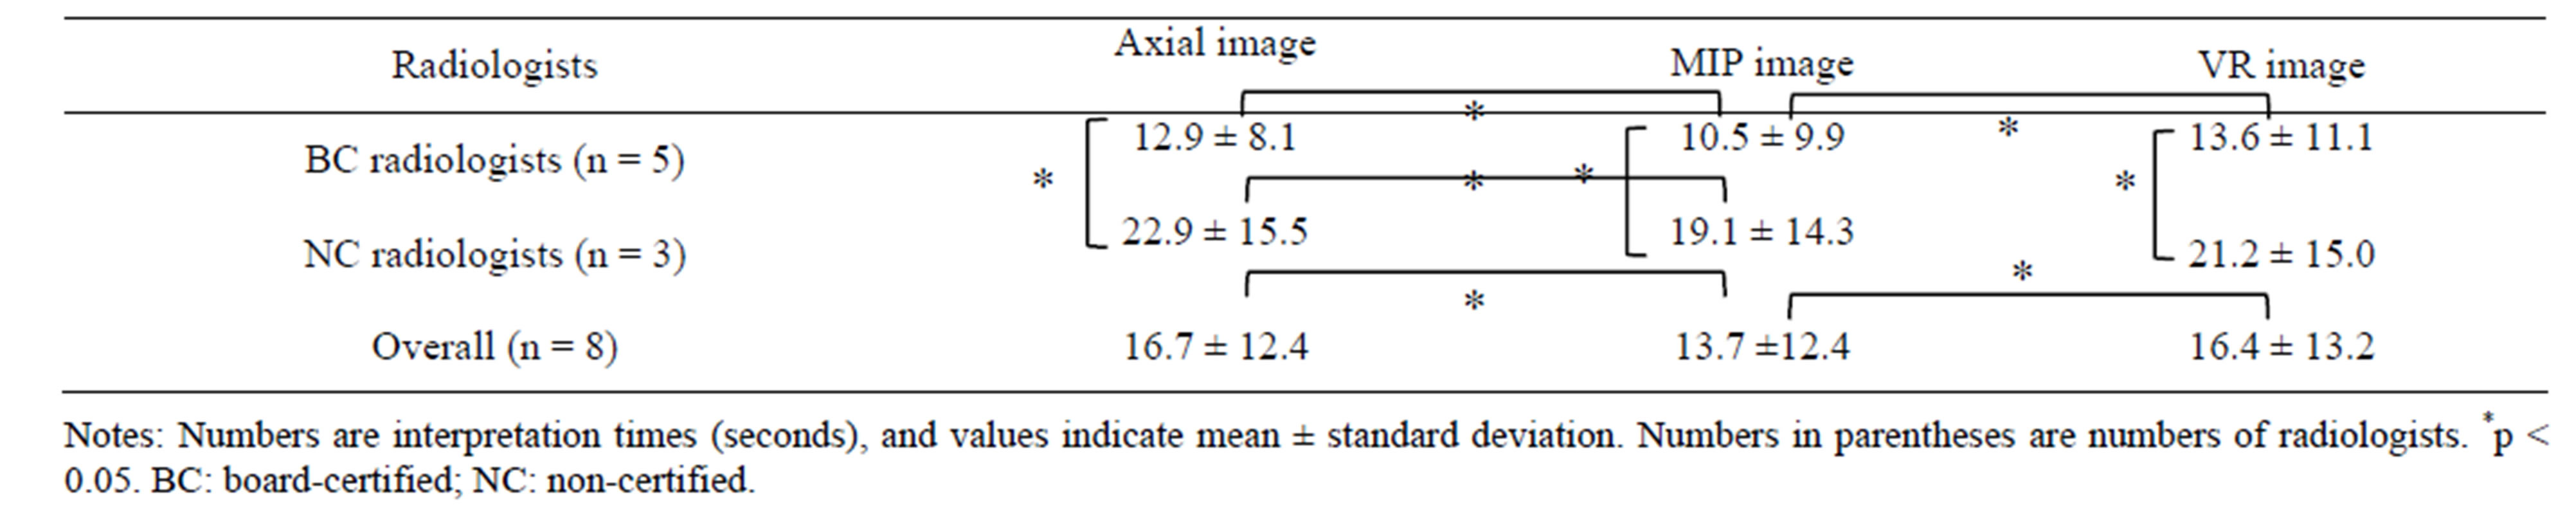
Table 1. Interpretation times for board-certified radiologists and non-certified radiologists reviewing the axial, MIP and VR images of the renal arteries of 48 donors.
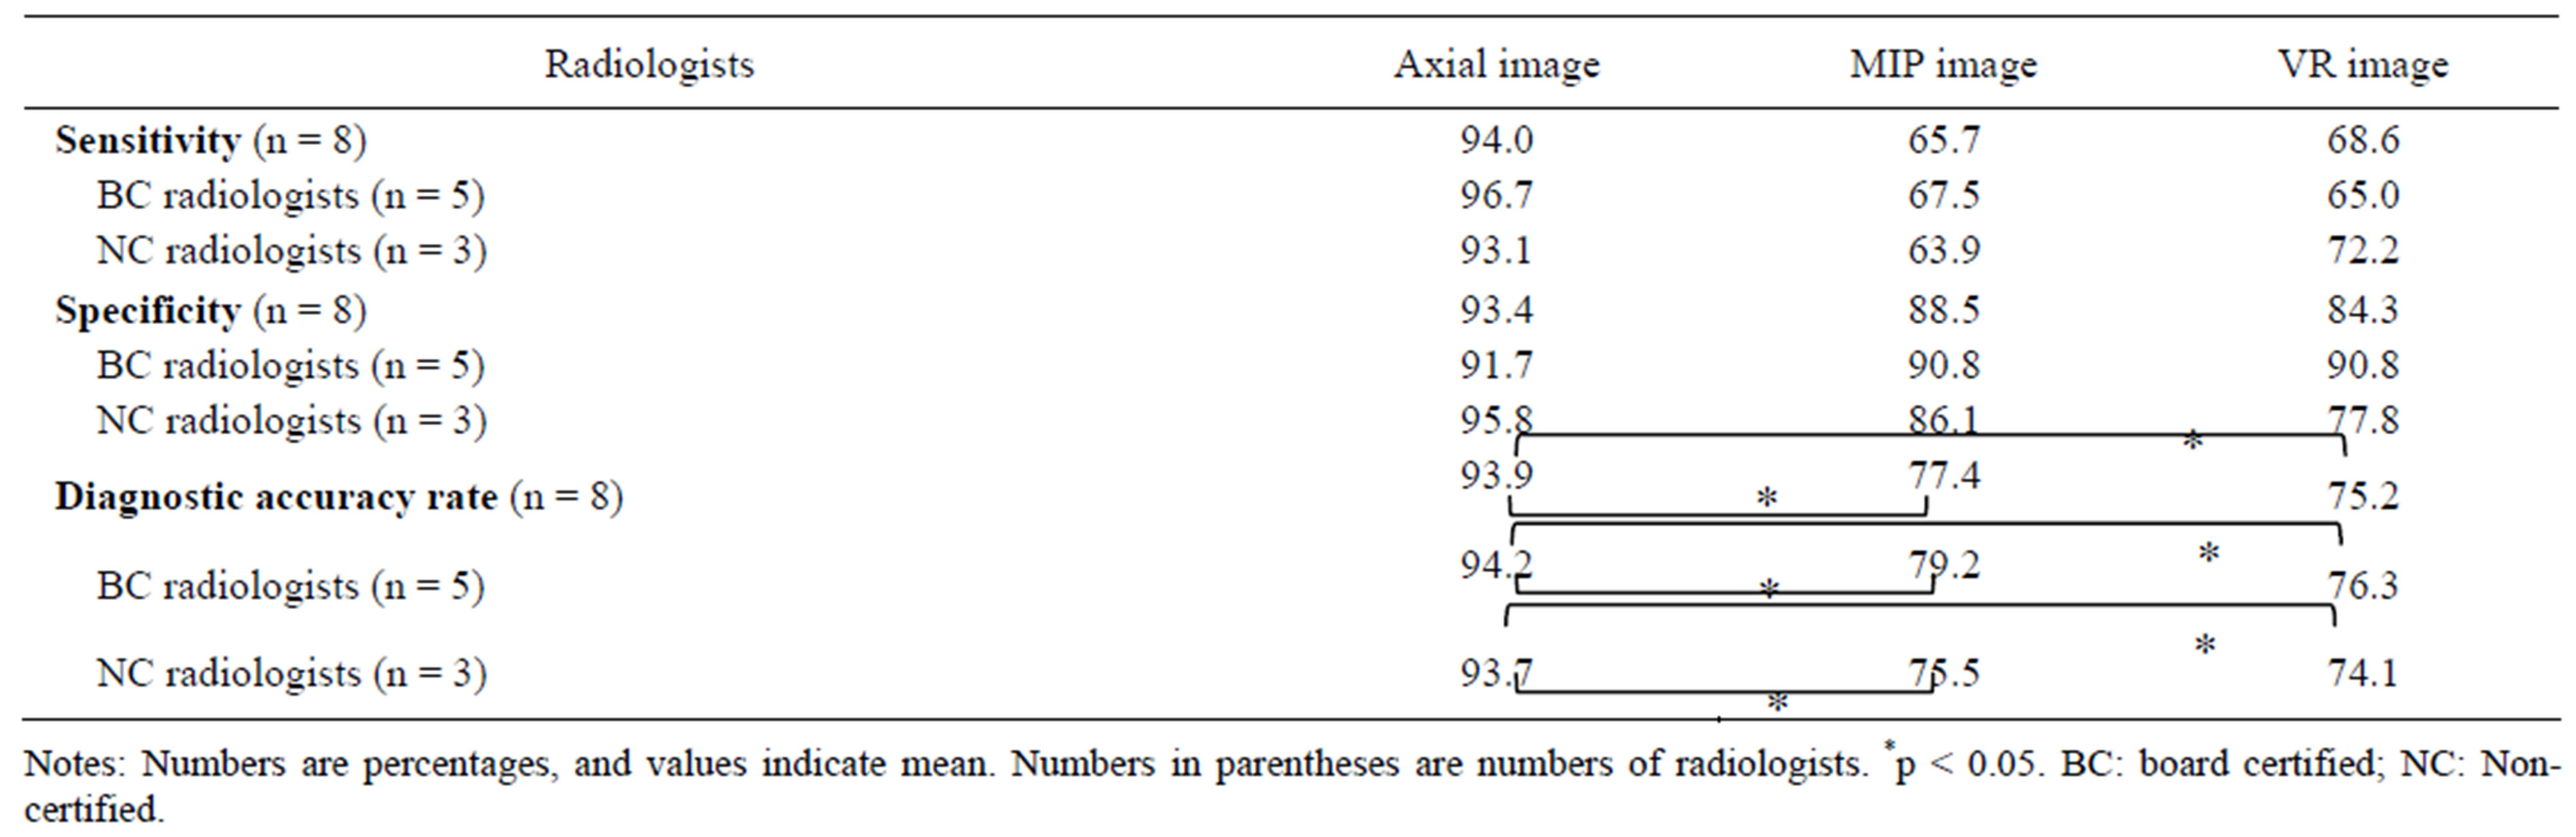
Table 2. Sensitivity, specificity and diagnostic accuracy rate for detection of renal arteries in 48 donors using axial, MIP and VR images.
The diagnostic accuracy with axial images was significantly higher than either MIP or VR images by both board-certified radiologists and non-certified radiologists. However, board-certified radiologists had a slightly higher accuracy rate for MIP and VR images than non-certified radiologists (p > 0.05) (Table 2).
In the ROC analysis, the average Az value for detection of the number of renal arteries in the donors using axial images was significantly higher than that using MIP images or VR images (p < 0.05 for both), and thus the axial images outperformed the other two modalities for detection of the number of arteries (Table 3).
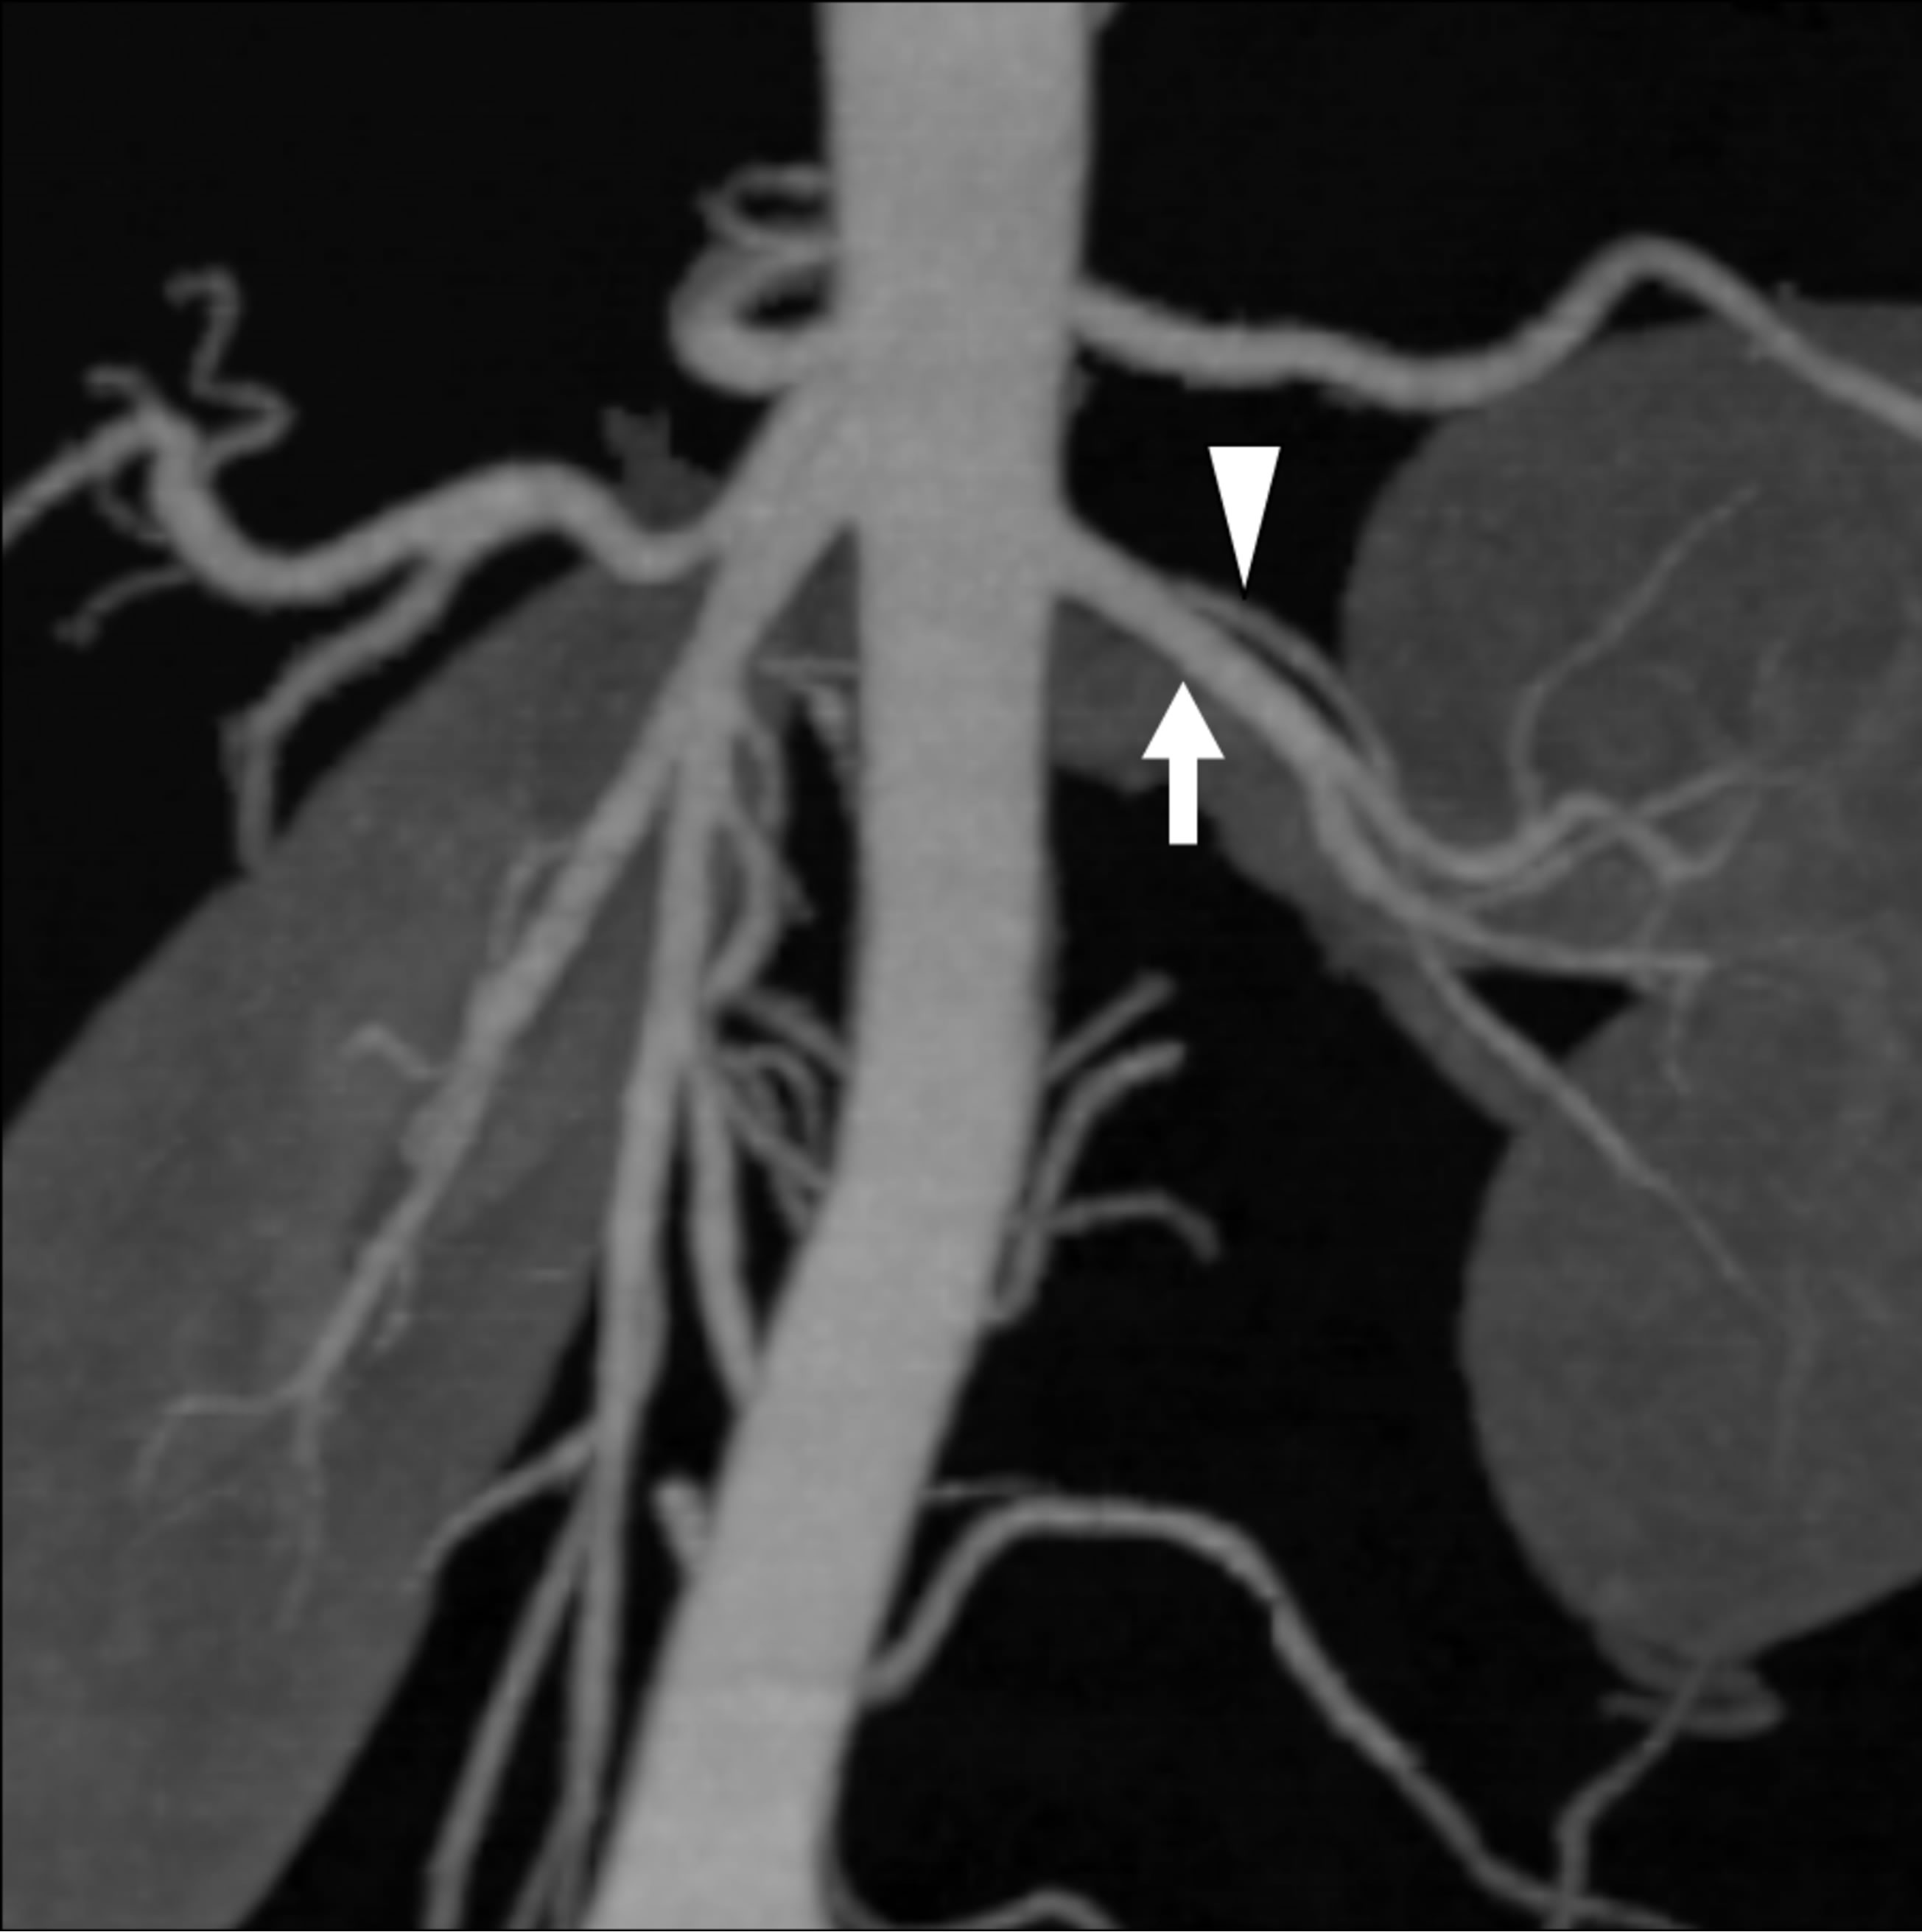
There were two cases with a discrepancy between non-certified radiologists and certified radiologists or between imaging methods. In one of these cases, two arteries diverged very close to each other from the abdominal aorta (Figure 1), and in the other case, the caliber of accessory artery was very small at the proximal or middle portion (Figure 2).
4. Discussion
In our study, the identification of renal arteries with axial images matched that in the surgical findings for 155 of 156 arteries, an accuracy of 99.4%. This result corresponded well with earlier reports that MDCT angiography was highly accurate for detecting the number of renal arteries [5-8]. According to Kim et al. [9], 19% - 31% of the left kidneys had supernumerary renal arteries, especially double arteries [14]. In our study, 21.1% of patients also had supernumerary arteries: double arteries were seen in 20.3%, and triple arteries in 0.8% of patients. Only one donor was missed on the interpretation with axial, VR and MIP images; the donor had an accessory artery to the upper pole of the left kidney, and this was not detected either in the interpretation without reference to the surgical findings, or in the retrospective reviews. This result was attributed to technical limitations (e.g., the slice at the axial image was thick, and the angle of rotation was wide at the VR and MIP images).
The diameters of the arteries missed in VR or MIP images ranged between 1.7 and 4.4 mm. Small-caliber accessory arteries were also described in previous studies, with a range from 3 to 4 mm in diameter [15]. Dushyant et al. also described that small arteries ranging from 1.5 to 2.5 mm in diameter were missed at the initial interpretation [6]. These results underscore that we should take notice of supernumerary arteries that are very small in caliber when we review the numbers of renal arteries.
In our study, axial images provided high accuracy, sensitivity and specificity even when reviewed by radiologists with varying levels of expertise. On the basis of these results of specificity and sensitivity, we suggest at this time that axial images are superior to MIP and VR
 (a)
(a)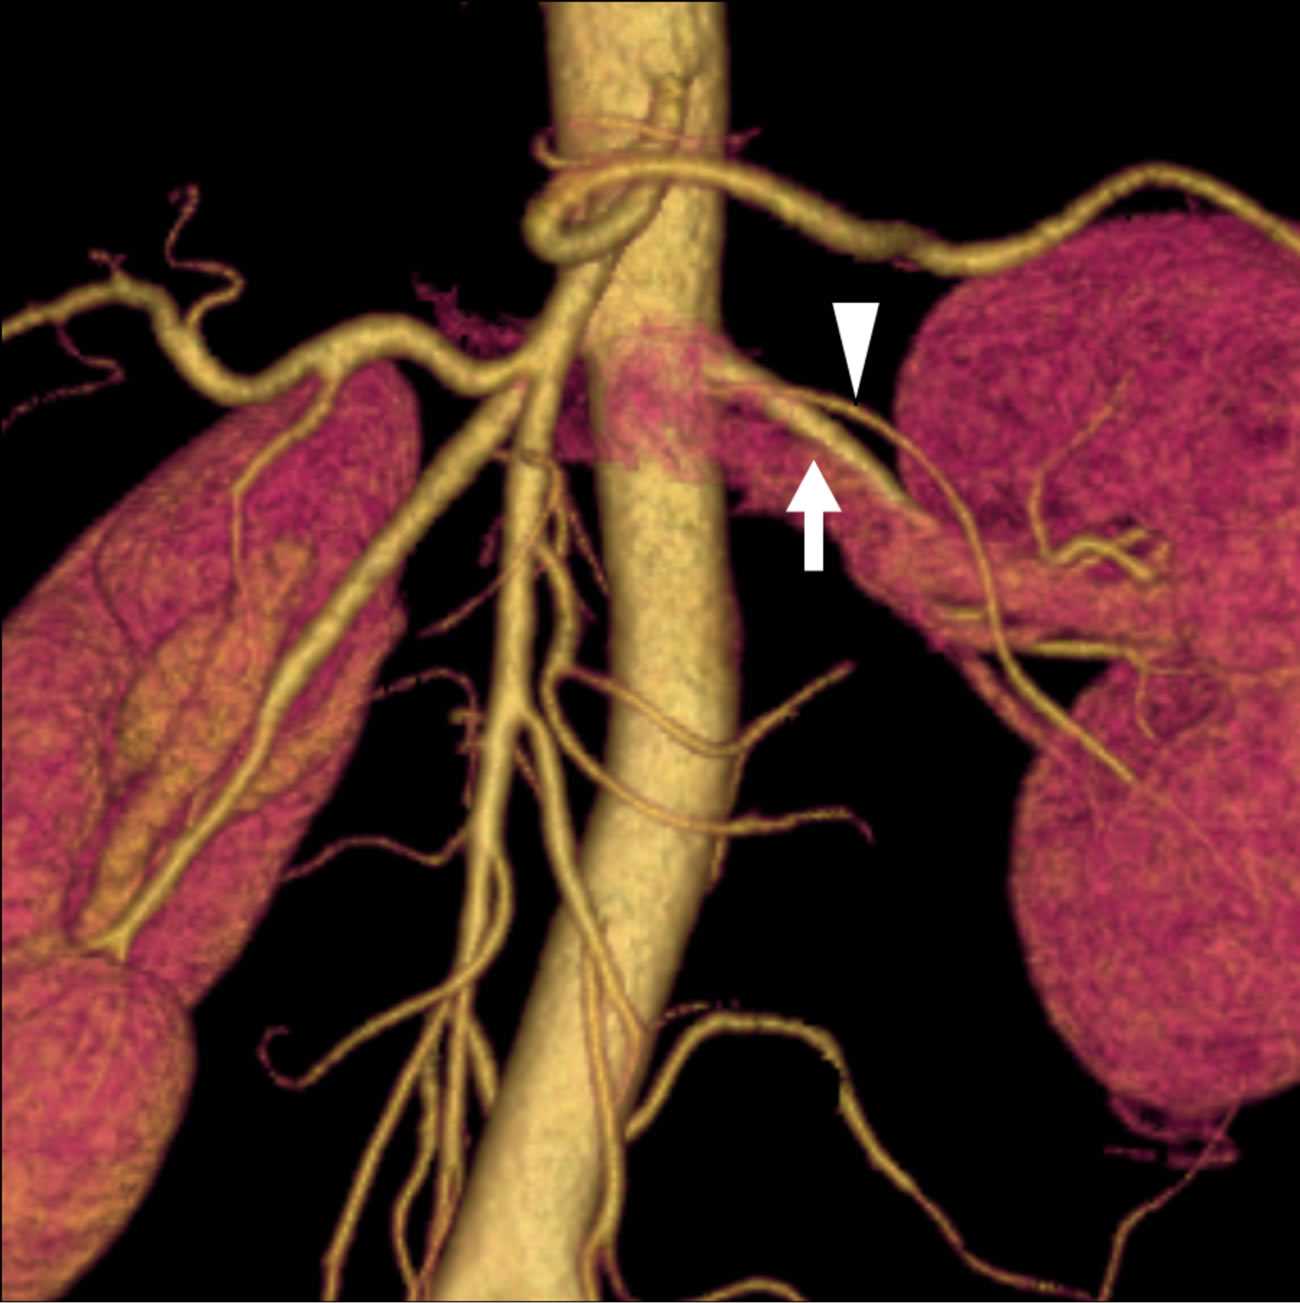 (b)
(b) (c)
(c)
Figure 1. A 40-year-old female donor who had two left renal arteries. (a) The axial CT image indicates the branching site of the double arterial branches of the left kidney (main renal artery: arrow; lower branch: arrowhead); (b) The volume rendering (VR) image can barely detect the branching site of the small lower branch; (c) The maximum intensity projection (MIP) image does not clearly differentiate the lower branch (arrowhead) from the main renal artery (arrow) because they branch at a level almost equivalent to that of the abdominal aorta. However, there was no difference in Az values between the VR and MIP images.
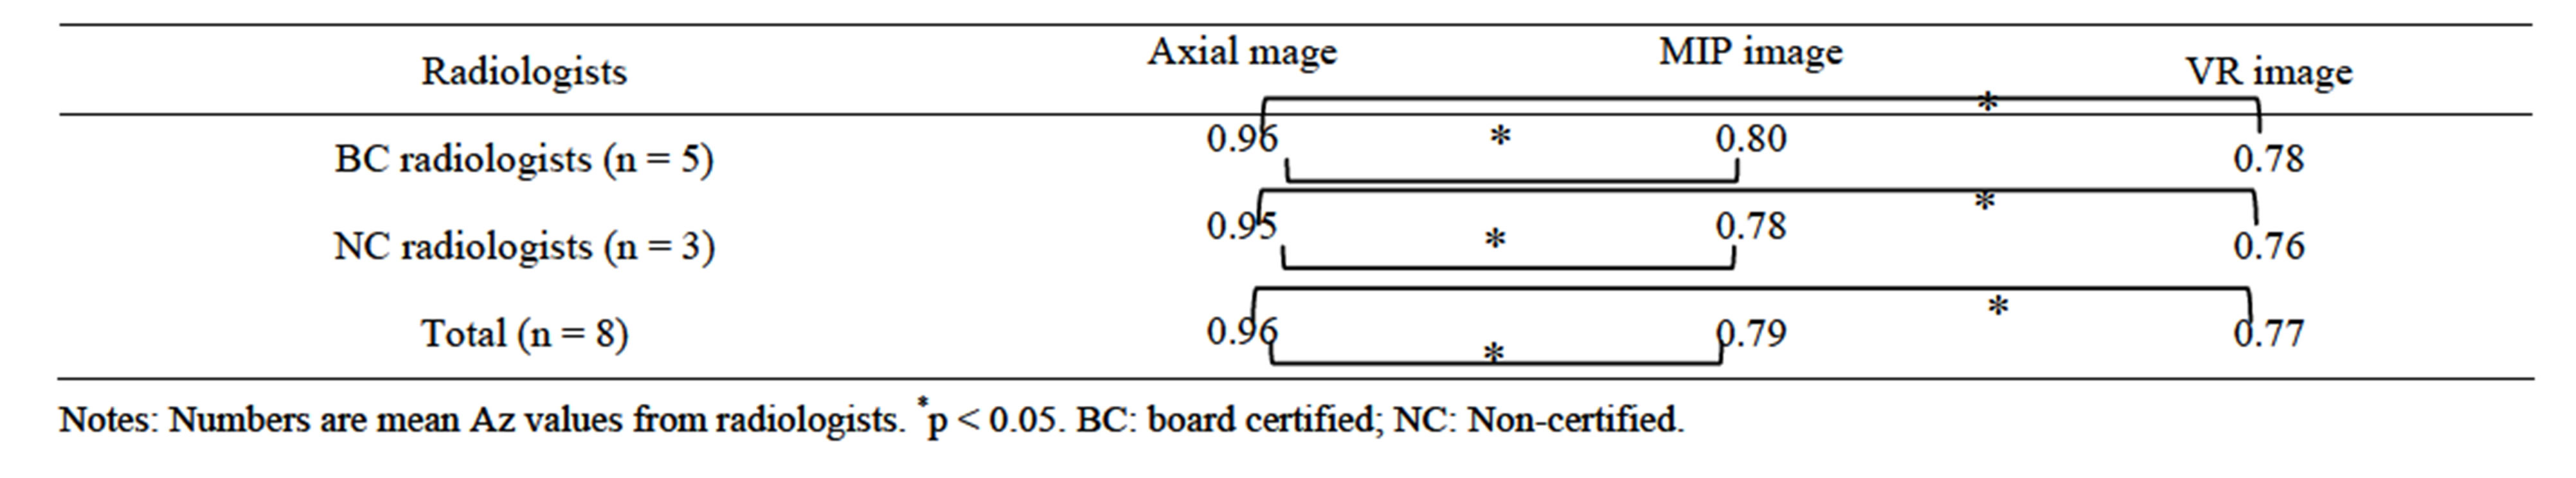
Table 3. Az values from ROC analysis for detection of numbers of renal arteries in the 48 donors using axial, MIP and VR images.
images for the evaluation of donated arteries, irrespective of the radiologist’s abilities. On the other hand, boardcertified radiologists had a slightly higher accuracy rate for MIP and VR images than non-certified radiologists. Changes in reconstruction techniques, such as a decrease in rotation angles or increase in rotation ranges, may improve the detectability for non-certified radiologists.
Although past studies showed that VR images were superior to MIP images for the detection of splanchnic small arteries [16,17], there have been reports that MIP images were superior to VR images for detecting hepatic arteries [18]. Kim et al. showed that there was a significant difference in the accuracy of renal artery detection between sliding thin-slab VR and MIP images and thickslab VR images [9]. Our study also showed that there was no significant difference between MIP and VR images for either non-certified radiologists or certified radiologists.
In our study, non-certified radiologists required more time to review axial images than to review either VR images or MIP images. MIP images required less time to review compared with other images for both groups. Board-certified radiologists required significantly less time to review all images than non-certified radiologists. These results suggest that MIP images may help to alleviate stress in board-certified radiologists when reviewing images.
Rastogi et al. [19] reported that smaller-sized accessory renal arteries, measuring less than 2 mm in diameter, were identified on 3D images alone. However, our study showed that small arteries with a diameter of 3 mm or less were difficult for especially non-certified radiologists to detect. However, accessory arteries with small diameter may not be important to surgeons, because in general small arteries supply a localized area in the kidney and surgeons need not anastomose in transplantation.
In this study, axial images had higher Az values for detectability than either MIP or VR images. This suggests that axial images are more effective for the detection of arteries irrespective of the level of expertise of the radiologist. Although the Az value did not reach 100%, improvement of imaging techniques and reconstruction methods may overcome this problem. These results indicate that MDCT with axial images has an advantage over MDCT with MIP or VR images for the preoperative detectability of donor renal arteries. On the other hand, VR and MIP images can provide the location of vessels and shorten the interpretation time.
 (a)
(a) (b)
(b)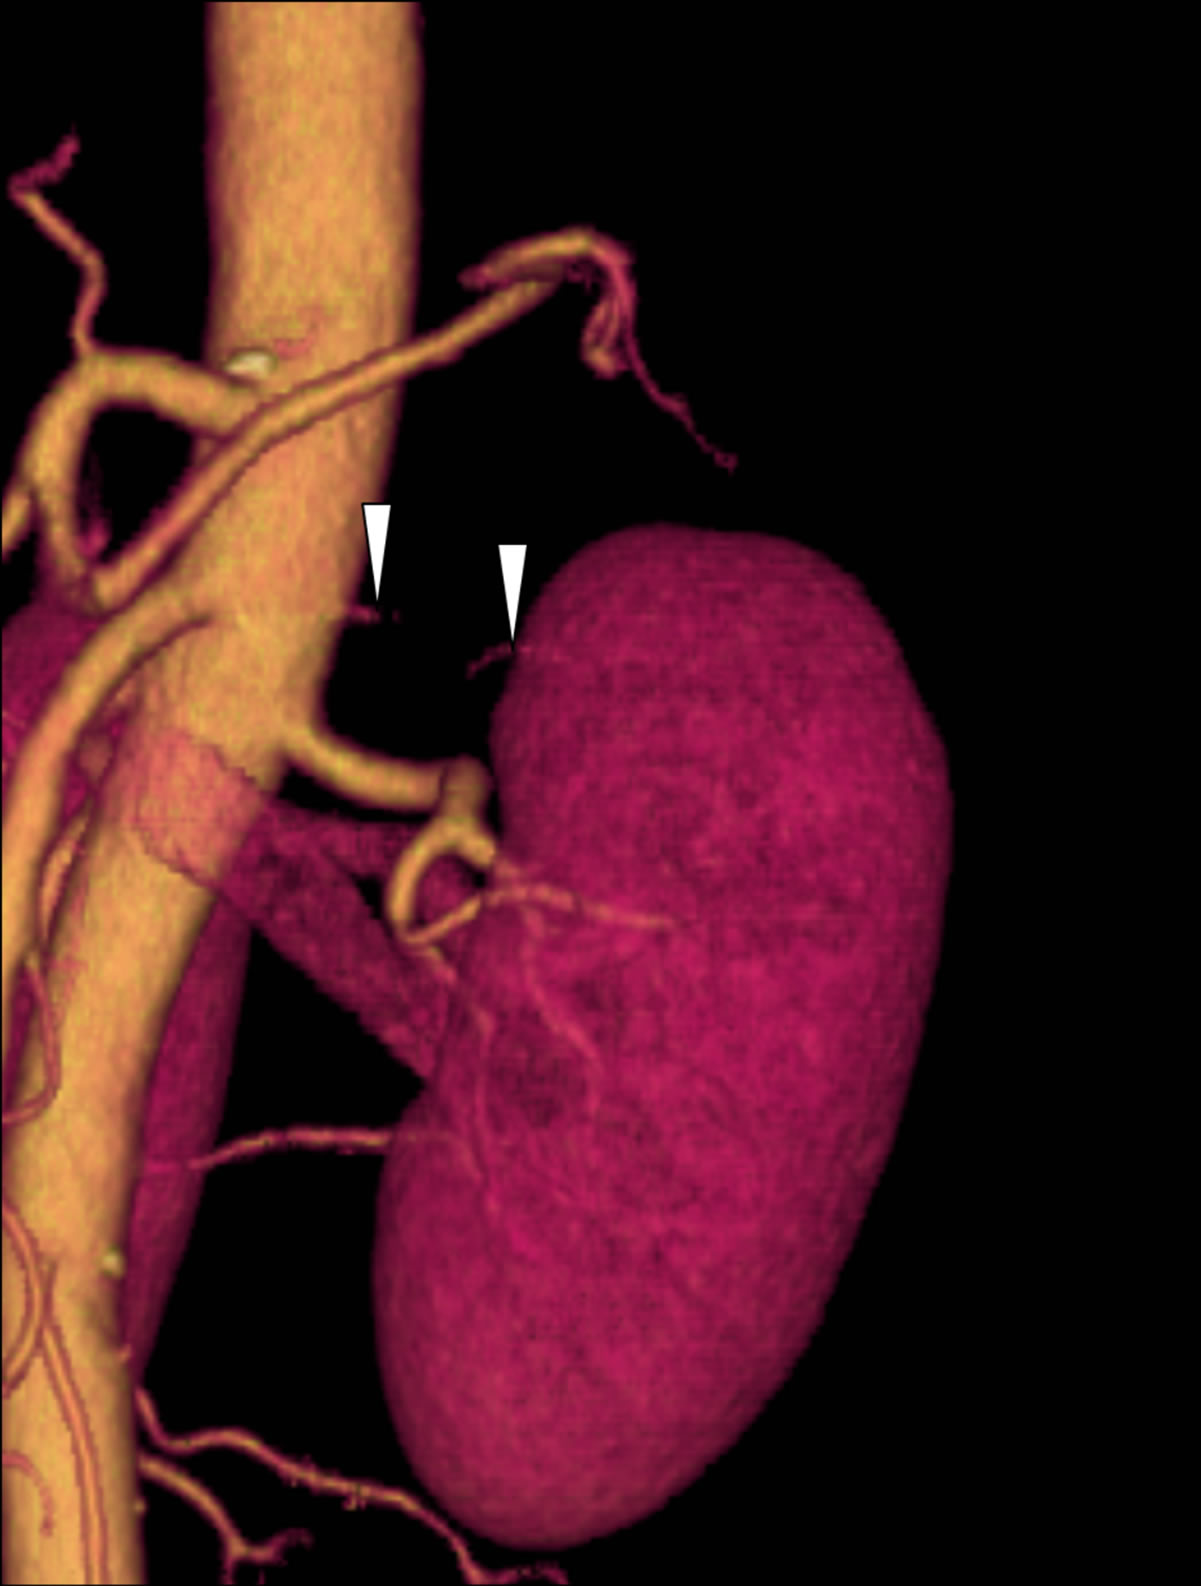 (c)
(c) (d)
(d)
Figure 2. A 30-year-old male renal donor who had two left renal arteries. (a) and (b) The axial CT images indicate the branching site of the upper branch of the left kidney (arrowheads). Note that the upper branch shows an irregular shape, composed of several erupted components; (c) and (d) On volume rendering (VR: (c)) and maximum intensity projection (MIP: (d)) images, the branching site of the upper branch of the renal artery is quite obliterated because of its small caliber (arrowheads).
Early branching is a variant that occurs within 2 cm of the main renal artery from the aorta. It can sometimes be confused in VR or MIP images with an accessory artery arising very close to the main renal artery from the aorta.
We recognized several limitations of our study. At first, as above mentioned, we did not evaluate the relationship between early branching and missing accessory arteries. Second, we excluded cases of right renal arteries. Presumably, if we had reviewed the renal arteries of right kidneys, the results will not have been the same. Distinguishing accessory arteries from renal arteries difficult in right than in left renal arteries, especially on VR or MIP images, because the renal veins are displayed along with the right renal arteries. The interpretation times required for right renal arteries may also be prolonged in all three imaging modalities.
5. Conclusion
MDCT is helpful in reviewing the numbers of donated renal arteries for radiologists with different levels of expertise, and different types of reconstructions. The development of reconstruction methods such as slice thickness and rotation angles may improve the specificity and sensitivity.
REFERENCES
- T. M. Sasaki, F. Finelli, E. Bugarin, D. Fowlkes, J. Trollinger, D. Y. Barhyte, et al., “Is Laparoscopic Donor Nephrectomy the New Criterion Standard?” Archives of Surgery, Vol. 135, No. 8, 2000, pp. 943-947. doi:10.1001/archsurg.135.8.943
- P. C. Kuo, L. B. Johnson and J. V. Sitzmann, “Laparoscopic Donor Nephrectomy with a 23-Hour Stay: A New Standard for Transplantation Surgery,” Annals of Surgery, Vol. 231, No. 5, 2000, pp. 771-779. doi:10.1097/00000658-200005000-00018
- S. S. Raman, S. Pojchamarnwiputh, K. Muangsmboon, P. G. Schulam, H. A. Gritsch, et al., “Surgically Relevant Normal and Variant Renal Parenchymal and Vascular Anatomy in Preoperative 16-MDCT Evaluation of Potential Laparoscopic Renal Donors,” American Journal of Roentgenology, Vol. 188, No. 1, 2007, pp. 105-114. doi:10.2214/AJR.05.1002
- S. Kawamoto, L. P. Lawler and E. K. Fishman, “Evaluation of the Renal Venous System on Late Arterial and Venous Phase Images with MDCT Angiography in Potential Living Laparoscopic Renal Donors,” American Journal of Roentgenology, Vol. 184, No. 1, 2005, pp. 539-545. doi:10.2214/AJR.05.1002
- J. W. Chai, W. Lee, Y. H. Yin, H. J. Jae, J. W. Chung, H. H. Kim, et al., “CT Angiography for Living Kidney Donors: Accuracy, Cause of Misinterpretation and Prevalence of Variation,” Korean Journal of Radiology, Vol. 9, No. 4, 2008, pp. 333-339. doi:10.3348/kjr.2008.9.4.333
- D. V. Sahani, N. Rastogi, A. C. Greenfield, S. P. Kalva, D. Ko, A. Saini, et al., “Multi-Detector Row CT in Evaluation of 94 Living Renal Donors by Readers with Varied Experience,” Radiology, Vol. 235, No. 3, 2005, pp. 905- 910. doi:10.1148/radiol.2353040496
- S. Kawamoto, R. A. Montgomery, L. P. Lawler, K. M. Horton and E. K. Fishman, “Multidetector CT Angiography for Preoperative Evaluation of Living Laparoscopic Kidney Donors,” American Journal of Roentgenology, Vol. 180, No. 6, 2003, pp. 1633-1638. doi:10.2214/ajr.180.6.1801633
- E. L. Hänninen, T. Denecke, L. Stelter, M. Pech, P. Podrabsky, J. Pratschke, et al., “Preoperative Evaluation of Living Kidney Donors Using Multirow Detector Computed Tomography: Comparison with Digital Subtraction Angiography and Intraoperative Findings,” Transplant International, Vol. 18, No. 10, 2005, pp. 1134-1141. doi:10.1111/j.1432-2277.2005.00196.x
- J. K. Kim, J. H. Kim, S. J. Bae and K. S. Cho, “CT Angiography for Evaluation of Living Renal Donors: Comparison of Four Reconstruction Methods,” American Journal of Roentgenology Vol. 183, No. 2, 2004, pp. 471- 477. doi:10.2214/ajr.183.2.1830471
- L. E. Ratner, L. R. Kavoussi, K. D. Chavin and R. Montgomery, “Laparoscopic Live Donor Nephrectomy: Technical Consideration and Allograft Vascular Length,” Transplantation, Vol. 65, No. 12, 1998, pp. 1657-1658. doi:10.1097/00007890-199806270-00021
- A. K. Mandal, C. Cohen, R. A. Montgomery, L. R. Kavoussi and L. E. Ratner, “Should the Indications for Laparoscopic Live Donor Nephrectomy of the Right Kidney Be the Same as for the Open Procedure? Anomalous Left Renal Vasculature Is Not a Contraindication to Laparoscopic Left Donor Nephrectomy,” Transplantation, Vol. 71, No. 5, 2001, pp. 660-664. doi:10.1097/00007890-200103150-00015
- S. S. Raman, S. Pojchamarnwiputh, K. Muangsmboon, P. G. Schulam, H. A. Gritsch and D. S. Lu, “Utility of 16- MDCT Angiography for Comprehensive Preoperative Vascular Evaluation of Laparoscopic Renal Donors,” American Journal of Roentgenology, Vol. 186, No. 6, 2006, pp. 1630-1638. doi:10.2214/AJR.05.0983
- J. A. Hanley and B. J. McNeil, “A Method of Comparing the Areas under Receiver Operating Characteristic Curves Derived from the Same Cases,” Radiology, Vol. 148, No. 3, 1983, pp. 839-843.
- S. Kawamoto, R. A. Montgomery, L. P. Lawler, K. M. Horton and E. K. Fishman, “Multi-Detector Row CT Evaluation of Living Renal Donors Prior to Laparoscopic Nephrectomy,” RadioGraphics, Vol. 24, No. 2, 2004, pp. 453-466. doi:10.1148/rg.242035104
- K. S. Satyapal, A. A. Haffejee, B. Singh, L. Ramsaroop, J. V. Robbs and J. M. Kalideen, “Additional Renal Arteries: Incidence and Morphometry,” Surgical and Radiologic Anatomy, Vol. 23, No.1, 2001, pp. 33-38. doi:10.1007/s00276-001-0033-y
- K. C. Hong and P. C. Freeny, “Pancreaticoduodenal Arcades and Dorsal Pancreatic Artery: Comparison of CT Angiography with Three-Dimensional Volume Rendering, Maximum Intensity Projection, and Shaded-Surface Display,” American Journal of Roentgenology, Vol. 172, No. 4, 1999, pp. 925-931. doi:10.2214/ajr.172.4.10587122
- P. T. Johnson, D. G. Heath, B. S. Kuszyk and E. K. Fishman, “CT Angiography with Volume Rendering: Advantages and Applications in Splanchnic Vascular Imaging,” Radiology, Vol. 229, No. 3, 2003, pp. 869-876.
- J. H. Byun, T. K. Kim, S. S. Lee, J. K. Lee, H. K. Ha, A. Y. Kim, et al., “Evaluation of the Hepatic Artery in Potential Donors for Living Donor Liver Transformation by Computed Tomography Angiography Using Multidetector-Row Computed Tomography: Comparison of Volume Rendering and Maximum Intensity Projection Techniques,” Journal of Computer Assisted Tomography, Vol. 27, No. 2, 2003, pp. 125-131. doi:10.1097/00004728-200303000-00004
- N. Rastogi, D. V. Sahani, M. A. Blake, D. C. Ko and P. R. Mueller, “Evaluation of Living Renal Donors: Accuracy of Three-Dimensional 16-Section CT,” Radiology, Vol. 240, No. 1, 2006, pp. 136-144. doi:10.1148/radiol.2401050780
NOTES
*Corresponding author.