Open Journal of Medical Imaging
Vol.2 No.3(2012), Article ID:22669,5 pages DOI:10.4236/ojmi.2012.23015
Eye Movements Provide Inhibitory Inputs to the Occipito-Temporal Region
1Kansei Fukushi Research Institute, Tohoku Fukushi University, Sendai, Japan
2Graduate School of Human Relations, Keio University, Incheon, Korea
Email: sung@tfu-mail.tfu.ac.jp
Received June 7, 2012; revised July 10, 2012; accepted July 22, 2012
Keywords: Eye Movements; Visual Object Processing; Occipito-Temporal Region; Inhibitory; Functional Mri (fmri)
ABSTRACT
Eye movements play an important role in attention and visual processing. However, the manner in which eye movements are involved in object processing is not clear. The aim of this study is to examine the effects of eye movements on object-processing areas in the occipito-temporal region. Eye movements are always accompanied by visual perception; therefore, the effects of eye movements on object-processing areas in which visual object information is sent via eye movements instead of via retinal inputs of visual images must be measured. For this purpose, response to an eyedrawing stimulation in subjects who drew pictures of faces or buildings by their moving eyes under closed-eye conditions was measured by functional magnetic resonance imaging. Functional areas in the occipito-temporal region showed negative responses to the eye-drawing stimulation, and the pattern of negative activation maps in the region was almost the same as that of positive activation maps observed after visual image stimulation. Responses in category-selective area showed category dependency to the eye-drawing stimulation. This suggests that eye movements provide inhibitory inputs to the object-processing areas in the occipito-temporal region, and these inputs may modulate visual inputs to these areas coming through the retina in the visual perception process.
1. Introduction
Functional magnetic resonance imaging (fMRI) demonstrated that many functional areas in the ventral visual pathway are activated by visual image stimulation. Activation is usually interpreted to be caused by visual information entering into these areas through the visual information pathway from the retina to primary visual areas. However, this activation may be the result of a combination of the visual image and inputs of eye movement because eyes have different movement patterns depending on what is being observed. Eye movements play an important role in visual information processing [1-4]. Visual perception, memory, and imagery are known to be clearly affected by eye movement restrictions [5,6]. A previous study has reported that eye movements are involved in visual information processing, and that traces of eyes used for perceiving a visual scene are similar to those used for retrieving that scene after it is memorized [7]. This suggests possible inputs of eye movements to visual object-processing areas; however, proving this is difficult. One of the reasons is the difficulty in separation of the response of pure eye movements from responses observed in those areas during visual perception or imagery processing because eye movements always occur during visual perception or imagery.
In this study, we designed a stimulation scheme in which visual object information is sent via eye movements instead of via retinal inputs of visual images, and investigated the effects of eye movements on the occipito-temporal region in the absence of retinal inputs of visual images by fMRI. We made the following two stimulation paradigms: an eye-drawing stimulation in which subjects drew pictures of faces or buildings by moving their eyes under closed-eye conditions, and a hand-drawing stimulation that is same as the eye-drawing stimulation except that a finger was used for drawing.
2. Methods
2.1. Subjects
Sixteen healthy volunteers (university students) participated in the eye-drawing experiment, and 12 of them participated in the hand-drawing experiment. They had no history of neurological disease or medical conditions contraindicating MRI, such as pregnancy, presence of a cardiac pacemaker, or claustrophobia. After giving the subjects a complete description of the study, written informed consent was obtained in accordance with the Declaration of Helsinki. This study was approved by the institutional review board of Tohoku Fukushi University.
2.2. Stimulation Procedure
The subjects were notified to start and stop drawing by making single and double sounds (double sounds were made at a 1-s interval), respectively. They were instructed to draw pictures of faces or buildings with their eyes in the eye-drawing experiment or with their right index fingers (drawing on the patient table) in the hand-drawing experiment, and to repeat the drawing as many times as possible for 15 s. The subjects practiced the tasks outside the scanning room before undergoing MRI. For both eyeand hand-drawing experiments, an initial 30-s control state was followed by one task block (face or building drawing) of 15-s with a 31-s inter-task control state and then another task (building or face drawing), which was followed by a 31-s post-stimulus control state. In the control states the subjects were resting with their eyes closed. The ordering of the tasks was counter-balanced in each subject. For each experiment two runs were performed for each subject. Eye movements of each subject were monitored through an online display on the MRI console, and their finger movements were monitored using an infrared camera mounted in the scanning room. The experiments were performed with subjects’ eyes closed in the dark scanning room. To investigate response characteristics in occipito-temporal region by the drawing stimulations in the absence of retinal inputs of visual images we compared activation maps of the eyedrawing and hand-drawing stimulations with those of visual image stimulations used in our previous study [12]. The subject group was different in this study from that of the previous but we compared the data from different two groups because the similar activation maps of occipitotemporal region had been observed from different subject groups when we used pictures of faces and buildings as visual stimulation.
2.3. Stimulation Procedures in Our Previous Study
In the visual image stimulation, pictures of faces or buildings were presented on an overhead screen to the subjects [12]. The visual stimulation procedure involved two 10-s stimulation blocks of the face or building with 30-s preand post-stimulus control states and a 30-s inter-task control state. Twenty pictures of faces or buildings were presented in each block with a 300-ms onduration and 200-ms off-duration. In the control states the subjects had fixated on a cross-hair. The pictures were presented on a screen over the head through a projector (SANYO, JAPAN, LP-FX31, spatial resolution 1024 × 768, refresh rate 60 Hz) in the outside of the scanner room. The pictures occupied 5 × 7 degrees of the subject’s visual field around the fovea. A gray cross point of 0.34 × 0.34 degrees on the black background (2 cd/m2) was presented throughout this experiment. The pictures were gray scale images with average contrast of 105 cd/m2.
2.4. Measurements
All MRI experiments were performed using Verio (Siemens, Germany) with a standard, 12-channel, head matrix coil operating at 3 Tesla. After obtaining initial localizing images, T1-weighed anatomical images were obtained by inverted, recoveryand magnetization-prepared rapid acquisitions using a gradient echo with a matrix size of 256 × 256 mm over a 256-mm field of view and a slice thickness of 1 mm. For functional imaging, single shot gradient echo planar imaging was performed with 1000-ms repetition time, 25-ms echo time, 90˚ flip angle, 200 - 230 mm field of view, 64 × 64 mm matrix size, and slice thickness of 5 mm with a gap of 0.8 mm. Eighteen slices parallel to AC-PC were acquired for each volume.
2.5. Sound Signal for Eye Movements
The subjects were made to wear headphones (Resonance Technology, USA), and sounds to notify them to start and stop eye movements were made using an audio amp (Panasonic, Japan) placed outside the scanner room. The sounds had a frequency of 3.5 KHz and were made at a duration of 8-ms.
2.6. Image Data Analysis
Data obtained from fMRI were processed using the Brain Voyager QX software (Brain Innovation B.V., Postbus, Netherlands). All image data obtained from the functional sessions conducted for each subject were preprocessed using Brain Voyager QX, motion correction, scan time correction, and high-pass filtering with a cut-off frequency of 0.005 Hz. In each functional session, first 10 volumes were discarded to ensure that a steady state was reached. Two-dimensional data from the functional session were incorporated into three-dimensional data via trilinear interpolation and were transformed into Talairach space using Brain Voyager QX. For multi-subject analysis, three-dimensional Gaussian spatial smoothing (full width at half maximum, 5 mm) was applied to the data sets. Multi-subject analysis was performed using a multi-subject random effect approach. Statistical analysis was performed as per the procedure based on general linear modeling using Brain Voyager QX. Each experimental condition (except for the control) was defined as a separate predictor. The reference time course used as the predictor was the two-gamma hemodynamic response function. This analysis was performed independently for the time course of each individual voxel for each subject. To complete this analysis, the time series of the images obtained from each subject were converted into Talairach space and were z-normalized. Subsequently, the relative contributions of each predictor for each contrast were separately estimated for each subject, and the significance at the multi-subject level (random effects) was calculated from the obtained set of values (one mean value and variance for each subject). Multi-subject functional maps for each statistical test were superimposed on a Talairach-normalized brain of each subject.
3. Results
We first compared activation maps that were estimated by contrasting the tasks to the control states.
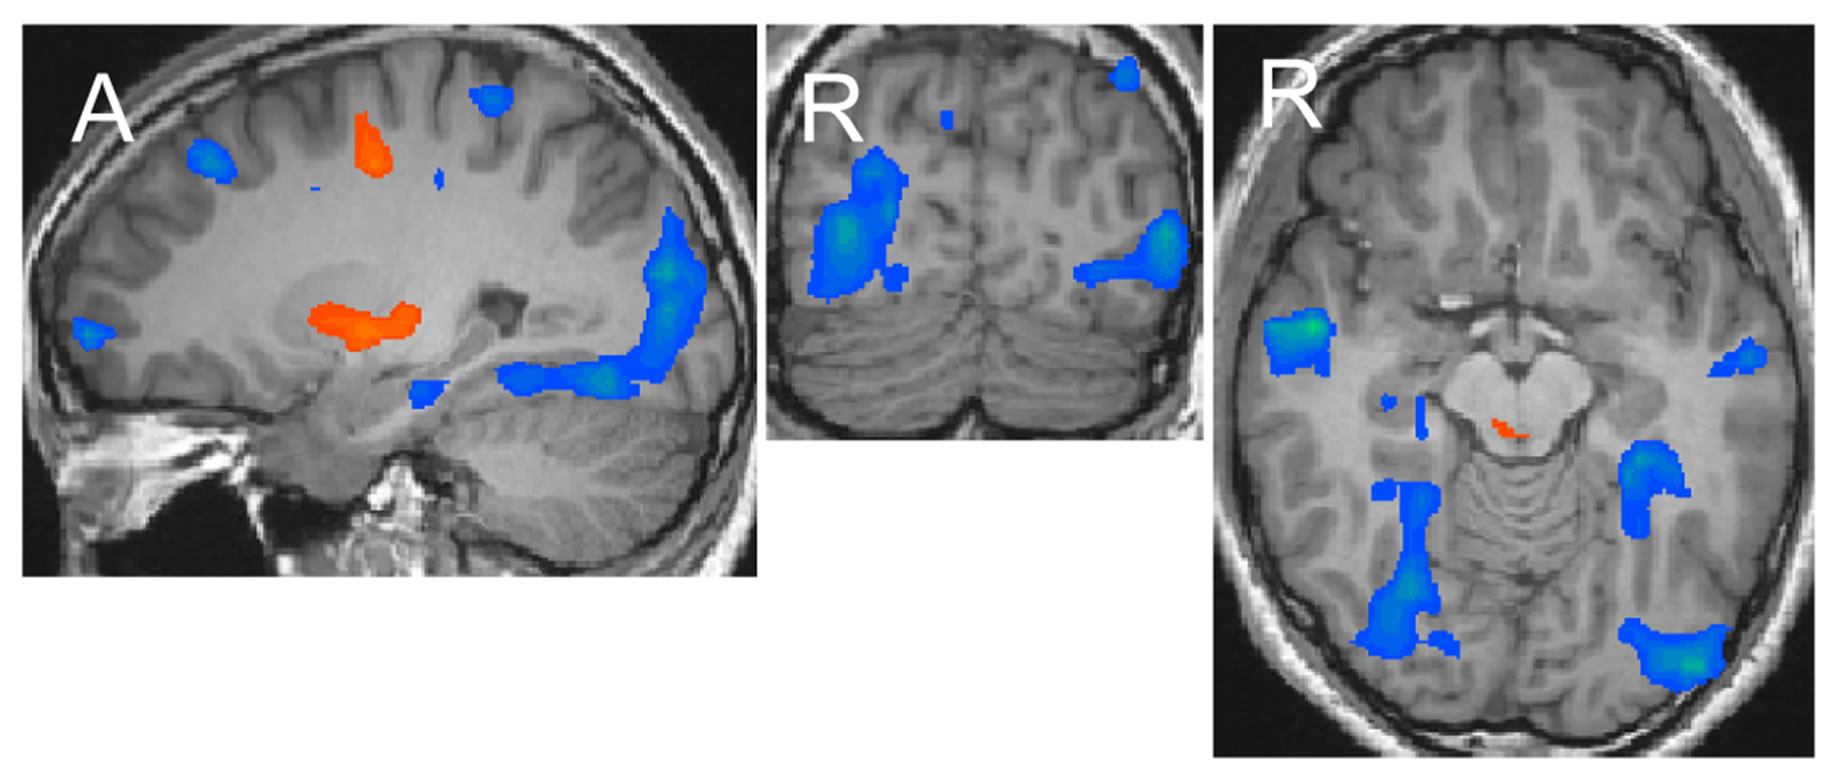
The eye-drawing stimulation induced negative activations in the occipito-temporal region (Figure 1(a)). The activation of areas in the left hemisphere was weaker than that in the right hemisphere, but the activation patterns in both hemispheres were similar with lowered thresholds. The activated areas extended from the dorsal to anterior ventral occipito-temporal regions, which included the lateral occipital complex known for processing objects, the occipital face area and face fusiform area (FFA) known for processing faces, and the parahippocampal place area (PPA) known for processing places [8-11]. The activation pattern observed with the eyedrawing stimulation was very similar to that observed with the visual image stimulation. Activation maps generated in our previous study are shown in Figure 1(b) [12]. The areas activated by the eye-drawing and visual image stimulations almost completely overlapped as the threshold was lowered (Figure 2). In contrast, with the hand-drawing stimulation, no significant activation was observed in the ventral occipito-temporal region except for an activation observed in the inferior occipital gyrus (Figure 1(c)). Further activation of areas in the occipitotemporal region did not occur by the hand-drawing stimulation even though the threshold was further lowered.
We next compared the face and building responses in FFA and PPA to examine whether the negative response to the eye-drawing stimulation showed a difference in terms of category dependency. The region of interest (ROI) for FFA was considered approximately (x = 40, y = –46, and z = –16; Talairach’s coordinates) in the common activation areas of the eye-drawing and visual image stimulations, and ROI for PPA was considered approximately (x = 26, y = –33, and z = –10) because the coordinates had been identified for FFA and PPA with the visual image stimulation (Sung and Ogawa, 2008).
The responses were significantly different in PPA (p = 0.015; paired t-test), and not in FFA (p = 0.32; paired t-test), between the drawings of the face and building (Figure 3). Other areas in the occipito-temporal region did not show significant differences between the drawings of the face and building (p > 0.1; paired t-test).
 (a)
(a)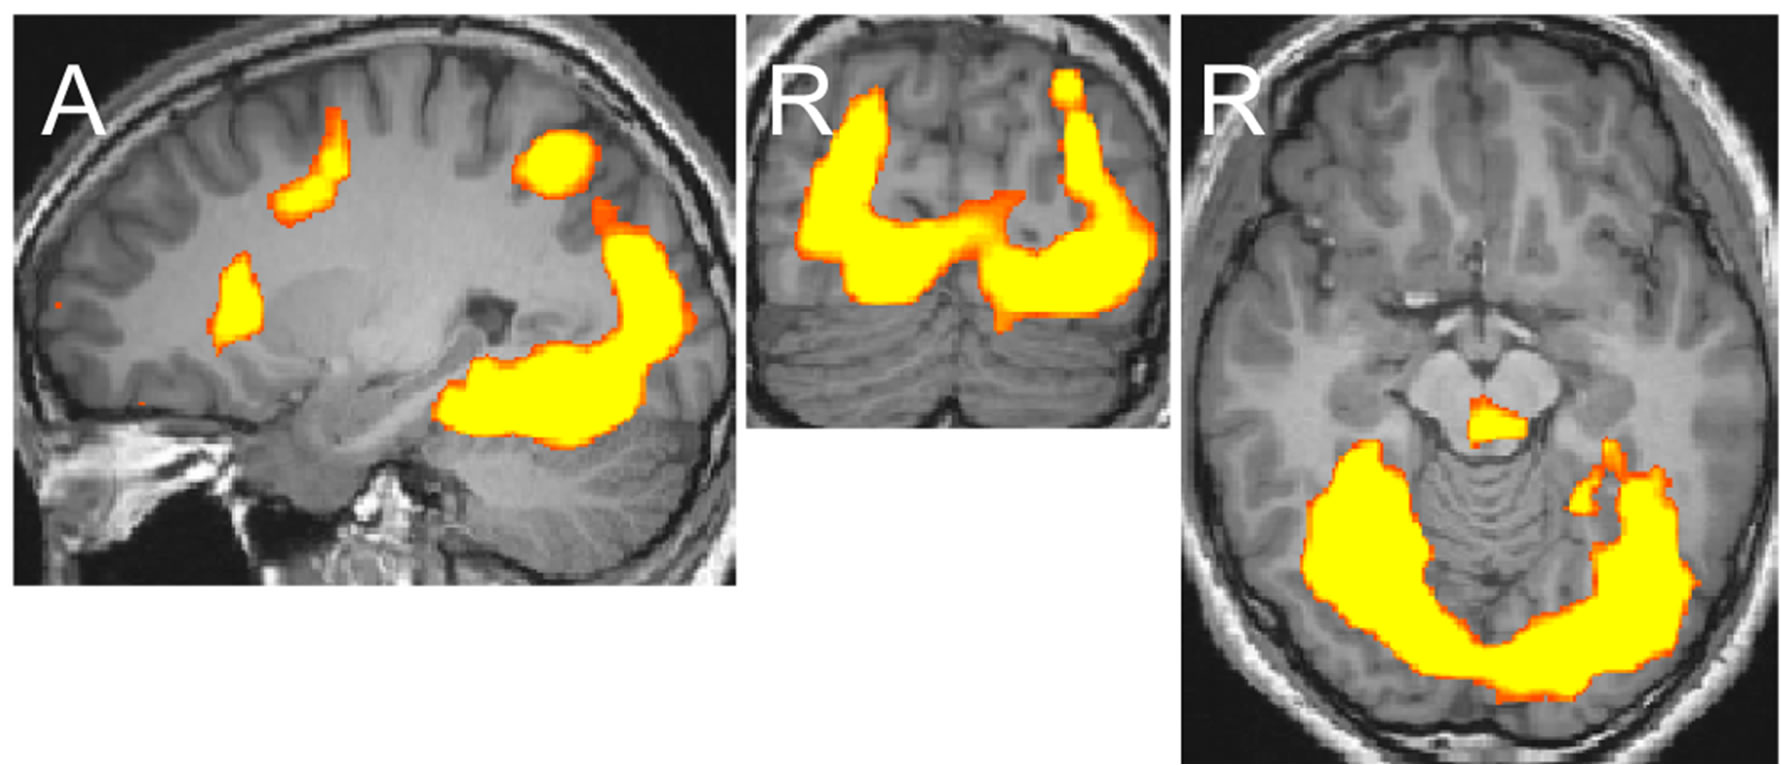 (b)
(b)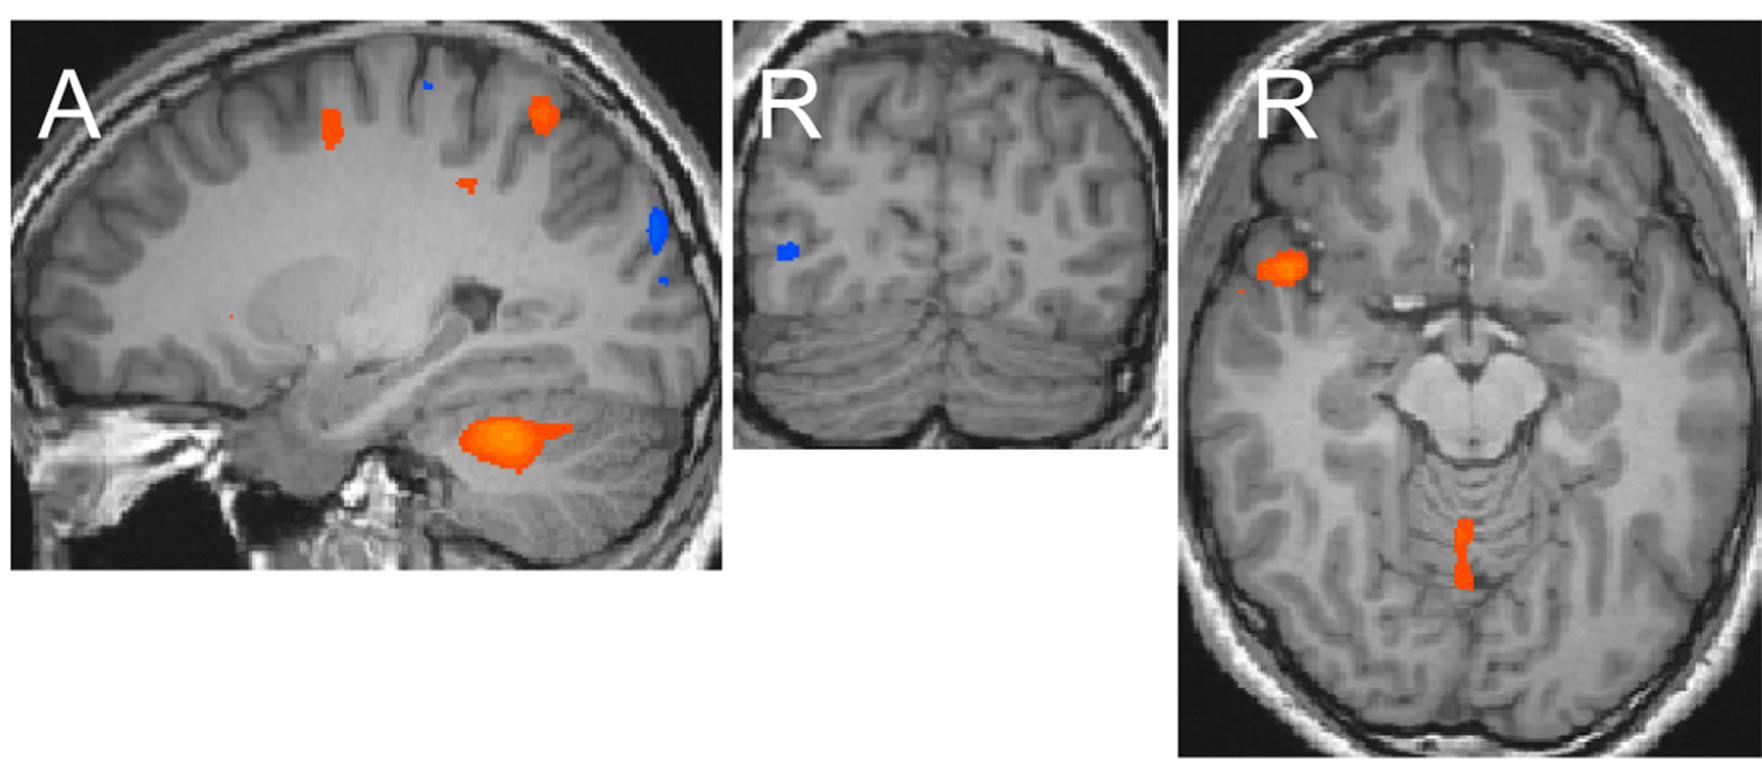 (c)
(c)
Figure 1. Activation maps of areas in the occipito-temporal region generated after each stimulation at the levels of x = 26, y = −78, and z = −10 in Talairach’s coordinates (p < 0.002). The upper and lower ends of continuous maps in the sagittal image are at (x = 26, y = −83, and z = −24) and (x = 26, y = −44, and z = −10), respectively. Orange-yellow indicates positive activation, blue indicates negative activation. (a) Eye-drawing stimulation; (b) Visual image stimulation; (c) Hand-drawing stimulation.

Figure 2. Comparison of the maps of areas in the occipitotemporal region generated after the eye-drawing and visual image stimulations, with the eye-drawing stimulation at a lowered threshold (p < 0.02). Orange-yellow indicates positive activation, blue indicates negative activation.
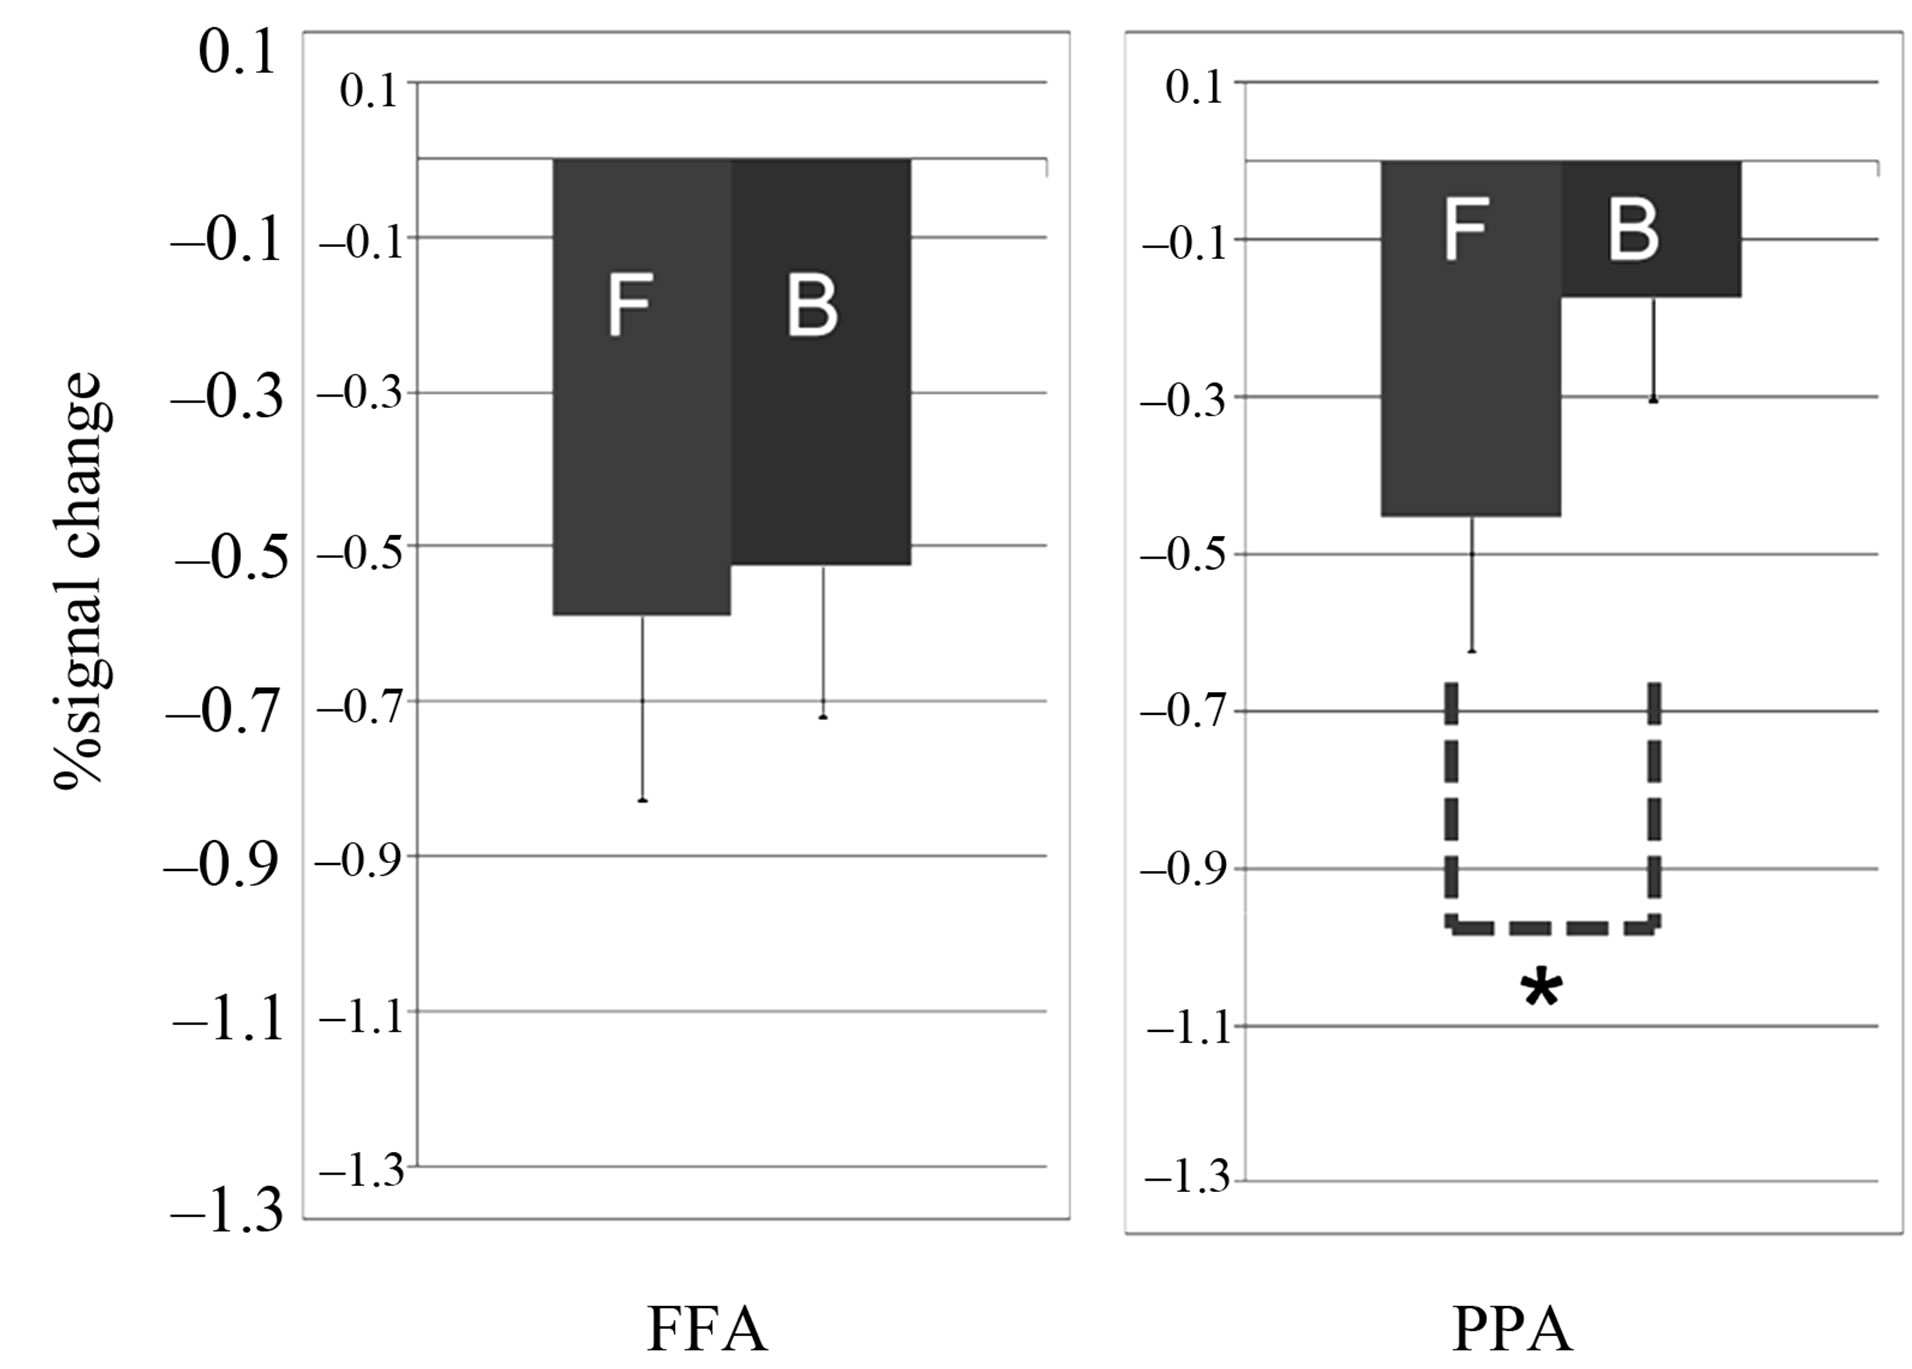
Figure 3. Responses to the eye-drawing stimulation in FFA (x = 35, y = −50, and z = −16) and PPA (x = 30, y = −33, and z = −10). F stands for the drawing of faces and B for that of buildings. *p = 0.015, Error bars: S.E.M.
4. Discussion
This study investigated the effects of eye movements on the occipito-temporal region by fMRI. We observed that activations with the eye-drawing stimulation are negative in the occipito-temporal region, and the negative activation maps are almost the same as the positive activation maps generated after the visual image stimulation. Face and building category-selective areas, FFA and PPA, show different response patterns to the drawings of the face and building.
Although some conceivable presence of visual imagery during the drawing under the closed-eye condition may be a confounding factor, we can exclude its presence because no significant activation in the occipitotemporal region was observed under the same condition in the hand-drawing experiment. Some studies on visual imagery show positive activation in FFA or PPA; thus, negative activation in PPA observed in this study denies visual imagery as a confounding factor [12,13]. The negative activation observed under the closed-eye condition cannot be ascribed to only spontaneous neuronal activation observed as oscillation in the resting state when the tasks were performed with the eyes closed because the eye-drawing and hand-drawing stimulations were both performed under the same closed-eye condition, and only the eye-drawing stimulation activated the areas [14]. This suggests that moving the eyes for drawing faces and buildings provides inhibitory inputs to the occipito-temporal region and these inputs include the face and building information sent via eye movements. The results thus indicate that eye movements associated with a visual experience or perception process may provide inhibitory inputs to the object-processing areas. This is a different aspect from the well-known functions of eye movements in the human brain, such as attention and saccade.
In this study, we could not evaluate whether the patterns drawn were actually pictures of faces and buildings, but the subjects were sufficiently prepared for the task by practicing the drawing before fMRI. Responses in PPA show that the subjects would draw two different drawings and one of them would be the building. The negligible difference in responses in FFA between the drawings of the face and building may result from the properties of FFA. The cases of visual image stimulation also showed similar trends in terms of difference in responses in FFA between the face and building; the difference in FFA is usually much smaller than that in PPA, and the difference in FFA often disappears depending on experimental conditions.
These findings demonstrate that eye movements provide inhibitory inputs to the occipito-temporal region and that these inputs depend on stimulatory content sent via eye movements.
5. Conclusion
Eye movements provide inhibitory inputs to object-processing areas in the occipito-temporal region.
6. Acknowledgements
Supported by Program of Funding Basic Research Centre in Private University (MEXT) to the Kansei Fukushi Ressearch Centrer, Tohoku Fukushi University (2008- 2012) and KOSEF grant funded by the Korea government (MEST) (R332011000101190).
REFERENCES
- D. Noton and L. W. Stark, “Scanpaths in Eye Movements during Pattern Perception,” Science, Vol. 171, No. 3968, 1971, pp. 308-311. doi:10.1126/science.171.3968.308
- I. A. Rybak, V. I. Gusakova, A. V. Golovan, L. N. Podladchikova and N. A. Shevtsova, “A Model of AttentionGuided Visual Perception and Recognition,” Vision Research, Vol. 38, No. 15-16, 1998, pp. 2387-2400. doi:10.1016/S0042-6989(98)00020-0
- M. Rucci, R. Iovin, M. Poletti and F. Santini, “Miniature Eye Movements Enhance Fine Spatial Detail,” Nature, Vol. 447, No. 7146, 2007, pp. 851-854.
- L. Saether, W. Van Belle, B. Laeng T. Brennen and M. Overvoll, “Anchoring Gaze When Categorizing Faces’ Sex: Evidence from Eye-Tracking Data,” Vision Research, Vol. 49, No. 23, 2009, pp. 2870-2880. doi:10.1016/j.visres.2009.09.001
- Z. M. Hafed and R. J. Krauzlis, “Ongoing Eye Movements Constraint Visual Perception,” Nature Neuroscience, Vol. 9, No. 11, 2006, pp. 1449-1457. doi:10.1038/nn1782
- B. Laeng and D.-S. Teodorescu, “Eye Scanpaths during Visual Imagery Reenact Those of Perception of the Same Visual Scene,” Cognitive Science, Vol. 26, No. 2, 2002, pp. 207-231. doi:10.1207/s15516709cog2602_3
- S. Brandt and L. W. Stark, “Spontaneous Eye Movements during Visual Imagery Reflect the Content of the Visual Scene,” Journal of Cognitive Neuroscience, Vol. 9, No. 1, 1997, pp. 27-38. doi:10.1162/jocn.1997.9.1.27
- R. A. Epstein and N. A. Kanwisher, “A Cortical Representtation of the Local Visual Environment,” Nature, Vol. 391, No. 6676, 1998, pp. 598-601. doi:10.1038/33402
- M. L. Gomo-Tempini and C. J. Price, “Identification of Famous Faces and Buildings,” Brain, Vol. 124, No. 19, 2001, pp. 2087-2097. doi:10.1093/brain/124.10.2087
- K. Grill-Spector, “The Neural Basis of Object Perception,” Current Opinion in Neurobiology, Vol. 13, No. 2, 2003, pp. 159-166. doi:10.1016/S0959-4388(03)00040-0
- N. Kanwisher, J. McDermott and M. M. Chun, “The Fusiform Face Area: A Module in Human Extrastriate Cortex Specialized for Face Perception,” Journal of Neuroscience, Vol. 17, No. 11, 1997, pp. 4302-4311.
- Y. Sung and S. Ogawa, “A Property of Face Representation at the Categorical Level,” Neuroscience Letters, Vol. 448, No. 1, 2008, pp. 1-5. doi:10.1016/j.neulet.2008.09.053
- C. Summerfield, E. Egner, M. Greene, E. Koechlin, J. Mangels and J. Hirsch, “Predictive Codes for Forthcoming Perception in the Frontal Cortex,” Science, Vol. 314 No. 5803, 2006, pp. 1311-1314. doi:10.1126/science.1132028
- M. D. Fox and M. E. Raichle, “Spontaneous Fluctuations in Brain Activity Observed with Functional Magnetic Resonance Imaging,” Nature Reviews Neuroscience, Vol. 8, No. 9, 2007, pp. 700-711. doi:10.1038/nrn2201