Open Journal of Blood Diseases
Vol.2 No.3(2012), Article ID:22216,7 pages DOI:10.4236/ojbd.2012.23008
Utility of Flow Cytometry to Classify Abnormal Plasma Cell Populations in Marrow Samples Collected from Patients with Putative Plasma Cell Neoplasms
![]()
1Division of Hematopathology, Department of Laboratory Medicine and Pathology; 2Department of Genetics, Cell Biology, Development, University of Minnesota, Minneapolis, USA.
Email: linde013@umn.edu
Received July 24th, 2012; revised August 28th, 2012; accepted September 5th, 2012
Keywords: Flow Cytometry; MGUS; Multiple Myeloma; Plasma Cells
ABSTRACT
Plasma cell neoplasms comprise a spectrum of diseases that include monoclonal gammopathy of undetermined significance (MGUS) and multiple myeloma (MM). Flow cytometric immunophenotyping has become an invaluable tool as an ancillary and diagnostic test for hematologic malignancies and is being used with increasing frequency in the diagnosis and monitoring of plasma cell neoplasms. As multiparameter flow cytometry has evolved, faster fluidics and detection systems facilitate the screening of a large number of events and the detection of multiple antigens simultaneously. This review addresses the approaches used to evaluate clonal plasma cell neoplasms and describes different surface and cytoplasmic markers and techniques that are important for the study of these diseases.
1. Introduction
Plasma cell neoplasms are a heterogeneous group of diseases that include monoclonal gammopathy of undetermined significance (MGUS) and multiple myeloma. Typically the gold standard for diagnosis has been to correlate morphologic assessment with serologic data, including protein electrophoresis and immunofixation. As technology has improved, especially monoclonal antibody production and instrumentation, multicolor flow cytometry has become an important tool to demonstrate that the plasma cells present in a marrow specimen are clonal or immunophenotypically abnormal [1]. Additionally, emerging data demonstrate that flow cytometry can provide key prognostic information in plasma cell neoplasms both pre and post treatment [1]. Preliminary data suggest that flow cytometry will play an increasingly important role in evaluating for chemotherapeutic sensitivity and emergence of drug resistance. In this review we discuss the approaches taken to evaluate for plasma cell neoplasms by flow cytometry, the different markers and techniques that can influence overall interpretation, and candidate markers to predict drug response.
2. Overview of Current Clinical Classifications of Clonal Plasma Cell Neoplasms
The 2006 Bethesda international consensus recommendations on clinical indications for the flow cytometric analysis of hematolymphoid neoplasms suggest screening bone marrow samples for plasma cell neoplasms in patients presenting with cytopenias and elevated white blood cell counts [2]. More commonly, detection of increased monoclonal serum or urine gamma globulins by electrophoresis prompt the laboratory evaluation of blood and/or bone marrow for plasma cell neoplasms (PCNs) [2], including monoclonal gammopathy of undetermined significance (MGUS), plasma cell multiple myeloma (MM), plasma cell leukemia (PCL) and immunoglobulin deposition diseases (IDD). While serum M-protein less than 3 g/dL and less than 10% clonal plasma cells in bone marrow in the absence of clinical manifestations represents MGUS, asymptomatic MM (AMM) is characterized by the presence of ≥3 g/dL of M-protein and ≥10% of clonal plasma cells in the absence of hypercalcemia, renal insufficiency, anemia or bone lesions [3]. Clinical and pathological distinction between these entities can be challenging; sometimes patients are placed in an intermediate category termed smoldering myeloma. The presence of aforementioned clinical manifestations attributable to clonal plasma cell proliferation is diagnostic of symptomatic MM, irrespective of serum M-protein levels or plasma cell numbers. The 2008 WHO classification of hematolymphoid neoplasms, therefore, requires the use of a combination of clinical, morphologic, and laboratory findings for the sub-categorization of PCNs. Flow-cytometric immunophenotyping performed on blood or bone marrow specimens obtained for the evaluation of PCN is one of the most important laboratory studies that can provide quantitative and phenotypic assessment of plasma cells, and has diagnostic, prognostic and predicttive utility.
3. Sample Preparation and Overall Approach to Analysis
Typically, second-pull bone marrow aspiration or a whole blood specimen drawn in heparin or EDTA is processed for diagnostic flow cytometry. Marrow is the most common specimen, and blood is typically only sent when a provider needs to evaluate the burden of circulating neoplastic plasma cells typically seen in PCL. After performing cell counts on automated instruments or manually using a hemacytometer, a portion of the cells are stained with multiple antibodies either prior to or after removal of erythrocytes. Either a fixative-free erythrocyte lysis method or a fixative and permeabilization method can be used for obtaining cell count and assessing phenotypic markers present on the cell surface. The latter method is necessary for the analysis of intracellular immunoglobulin light chains. Either approach provides a global estimate of plasma cell counts. However since plasma cells often get lysed during processing, and since the first drawn specimen is usually sent for morphological assessment of counts, the plasma cell percentage as assessed by flow and morphology may be discrepant. A significant discrepancy of up to 60% - 70% in counts may be seen and warrant a repeat assessment. Such discrepancies may arise due to poor specimen quality (due to hemodilute second aspirate), different distribution of plasma cells in particle-associated and liquid marrow components, significant time delay between specimen procurement and processing, or unintentional exclusion of neoplastic plasma cells, which have unpredictable forward and side scatter profiles, while analyzing a case.
4. Recommended Panels and Markers
Gating for plasma cells requires knowledge of normal plasma cell characteristics and abnormally expressed antigens. Compared to lymphocytes, non-neoplastic plasma cells have low forward/side scatter, variable to absent expression of CD45, and lack CD20, CD22, and surface immunoglobulins. They are brightly positive for CD38, CD138, and CD19 [4,5] and have polyclonal cytoplasmic immunoglobulins. In contrast, myeloma cells demonstrate monoclonal cytoplasmic immunoglobulin and almost always lack CD19 (95%) and surface immunoglobulin [5]. Myeloma cells, similar to nonneoplastic plasma cells, strongly express CD38, CD138, and CD79a [5]. For primary gating, European Myeloma Network-2008 (EMN) consensus guidelines advocate the use of four color detectors and inclusion of three antibodies (CD38, CD138 and CD45) in the identification of an abnormal clone [6]. These guidelines are based on studies that have shown nearly 100% sensitivity with the use of all three markers (CD38, CD138 and CD45) compared to the use of any two markers (CD38 vs CD138 98%; CD38 vs CD45 90%; and CD138 vs CD45 79%) [6]. CD38 expression by myeloma cells is typically dimmer compared to normal plasma cells, but is brighter than hematogones and lymphocytes. While CD138 is more specific to plasma cell lineage and is expressed more brightly by myeloma cells than normal plasma cells, it is highly temperature sensitive and its expression is particularly affected by processing times. CD45, in comparison, while dim on non-neoplastic plasma cells can either be decreased or increased in intensity in PCNs—with dim to absent or intermediate to bright staining. Therefore, to ensure the inclusion of CD45 myeloma cells especially in cases where CD45+ myeloma cells are in majority, it might be pragmatic to gate CD38 vs CD138 first and gate CD38 vs CD45 expression subsequently. However, it is important to scrutinize all plots comparing these antigens to look for an abnormal population. Once primary gating has isolated the plasma cell population, additional antigens are evaluated to establish an aberrant immunophenotype. Aberrant lack of CD19 and CD45 and expression of CD56 (65% - 80%), CD117 (20% - 30%), CD20 (10% - 30%) [7], allow for designing gating strategies to improve PCN characterization. Typical 8 color panels include CD19, CD20, CD38, CD45, CD56, CD138, and kappa and lambda immunoglobulin light chains.
5. Candidate Markers
In addition to the standard markers described in the prior section, numerous research studies have investigated the utility of additional markers such as CD27, CD28, CD81, CD74 and CD229. The memory B cell marker CD27 has a consistent bright expression in plasma cells in MGUS with intensity similar to non-neoplastic plasma cells, while its expression is heterogeneous and has low intensity on myeloma cells. Additionally, this reduction of CD27 expression correlates with loss of CD19 and progression of MGUS to MM [8]. Conversely, only very few cases of MGUS express CD28 [4], while this marker is expressed brightly in MM. Similarly, CD81 is brightly expressed by myeloma cells in a subset of patients, where it may be associated with CD19 co-expression, and poor clinical outcome [9]. CD229 surface expression is found on myeloma cells and B cells, in a regenerating and transplant marrow; however, the intensity of CD229 staining is brighter in myeloma cells than non-neoplastic B cells, regardless of disease stage or current treatment [10]. Furthermore, down-regulation of CD229 by myeloma cells has been shown to correlate with increased myeloma-specific cytotoxicity following melphalan and bortezomib chemotherapy. Markers such as CD74 and CD66a [11] reportedly have been found to be expressed on neoplastic plasma cells, however, their expression profiles are not well characterized and need support from further flow based studies and clinical correlations.
6. Utility in Diagnosis
The primary utility of flow cytometry in PCN is to document an aberrant immunophenotype and to estimate the percentage of plasma cells comprising the total non-erythroid cells (CD45-positive leukocytes). The ratio of neoplastic:non-neoplastic cells is also useful. A study by Perez-Persona et al. found that, at 5 years, the risk of progression of MGUS and AMM to symptomatic MM was 25% and 64% respectively, in cases where ≥95% of all bone marrow plasma cells had an aberrant phenotype on flow cytometry, at diagnosis [12]. As previously suggested, these counts may be affected by multiple factors, including cell loss during processing. Recent studies, however, have shown that despite a generally lower yield of plasma cell counts on flow cytometry, there remains a significant positive correlation between the counts obtained by morphology and flow cytometry, and the count of bone marrow myeloma cells obtained by flow cytometry is an independent prognostic factor for overall survival. Additionally, the number of non-neoplastic plasma cells as a percentage of total plasma cells at diagnosis is an important flow cytometric assessment in patients with symptomatic MM, since patients with more than 5% normal plasma cells at diagnosis have a significantly lower frequency of high-risk cytogenetic abnormalities, a higher rate of response to treatment and an overall favorable baseline clinical prognosis.
There is a general agreement about the lack of utility of any single antigen or combination of multiple antigens in differentiating myeloma cells from non-neoplastic plasma cells, Evidence from some studies and the European Myeloma Network-2008 guidelines suggests that the lack of CD19 in 95% and expression of CD56 in 80% of myeloma cells can be exploited in conjunction with CD38, CD45 and CD38 to differentiate a myeloma clone from normal plasma cells in up to 90% of cases; addition of CD20 or CD117 increases the detection to up to 95% cases [6]. Furthermore, demonstration of clonality for either cytoplasmic κ or λ by flow cytometry, using standard fixation and permeabilization kits, is important in establishing the diagnosis of MM. In our experience at the University of Minnesota, eight color flow cytometry using CD19, CD20, CD38, CD45, CD56, CD138 and cytoplasmic κ and λ has been useful in our laboratory in the identification and characterization of most of the PCNs at diagnosis and in the detection of residual disease (Figure 1). The combination of these markers has additional value in distinguishing non-Hodgkin B-cell lymphomas with plasmacytoid differentiation from CD20+ MM, as the latter tends to lack CD19, and expresses CD138 brightly.
7. Utility in Monitoring Residual Disease
Another use of flow cytometry is in the detection of minimal residual disease (MRD) after institution of chemotherapy or transplantation. Since the most achievable goal of current myeloma therapy is to control disease [13], being readily able to detect small amounts of residual disease is important and the most common PCN specimen type seen in our flow cytometry lab comes from MM patients after therapy. Although the reliable limit of detection for flow cytometry immunophenotyping for MRD in most settings is 20 neoplastic cells, the European Myeloma Network-2008 recommends that at least 100 neoplastic cells should be acquired for accurate enumeration to reduce the coefficient of variation. To achieve a clinically relevant cut-off for MRD in MM, studies have shown that a sensitivity of 0.01% is needed for flow cytometry based detection of malignant plasma cells. Thus, to achieve this sensitivity at least 1 × 10⁶ total events must be evaluated, distributed in single or several tubes. Assessment for MRD by flow cytometry isbecoming particularly important since patients without MRD at day 100 following autologous stem cell transplant have significantly better progression-free and overall survival than those with MRD. The biggest challenge in assessing MRD by flow is that the tumor cell burden may be falsely low because of the hemodilution of the aspirated marrow. Analysis of the number of neoplastic plasma cells as a percentage of total plasma cell count rather than as a percentage of total leukocyte count is therefore recommended since hemodilution would likely cause a proportionate reduction in the numbers of both the normal and the clonal plasma cells [14]. A study by Gupta et al. has shown that a neoplastic plasma cell index (percentage of neoplastic/non-neoplastic plasma cells) of less than 30 on flow cytometry might further be of potential use in differentiating complete treatment response (immunofixation negative) from a partial re sponse (immunofixation positive) [14]. The second challenge in assessing MRD by flow cytometry is “antigen shifts” in neoplastic cells following treatment [15]. These changes include gain or loss of immunoreactivity for a previously unexpressed antigen or changes in the intensity of an
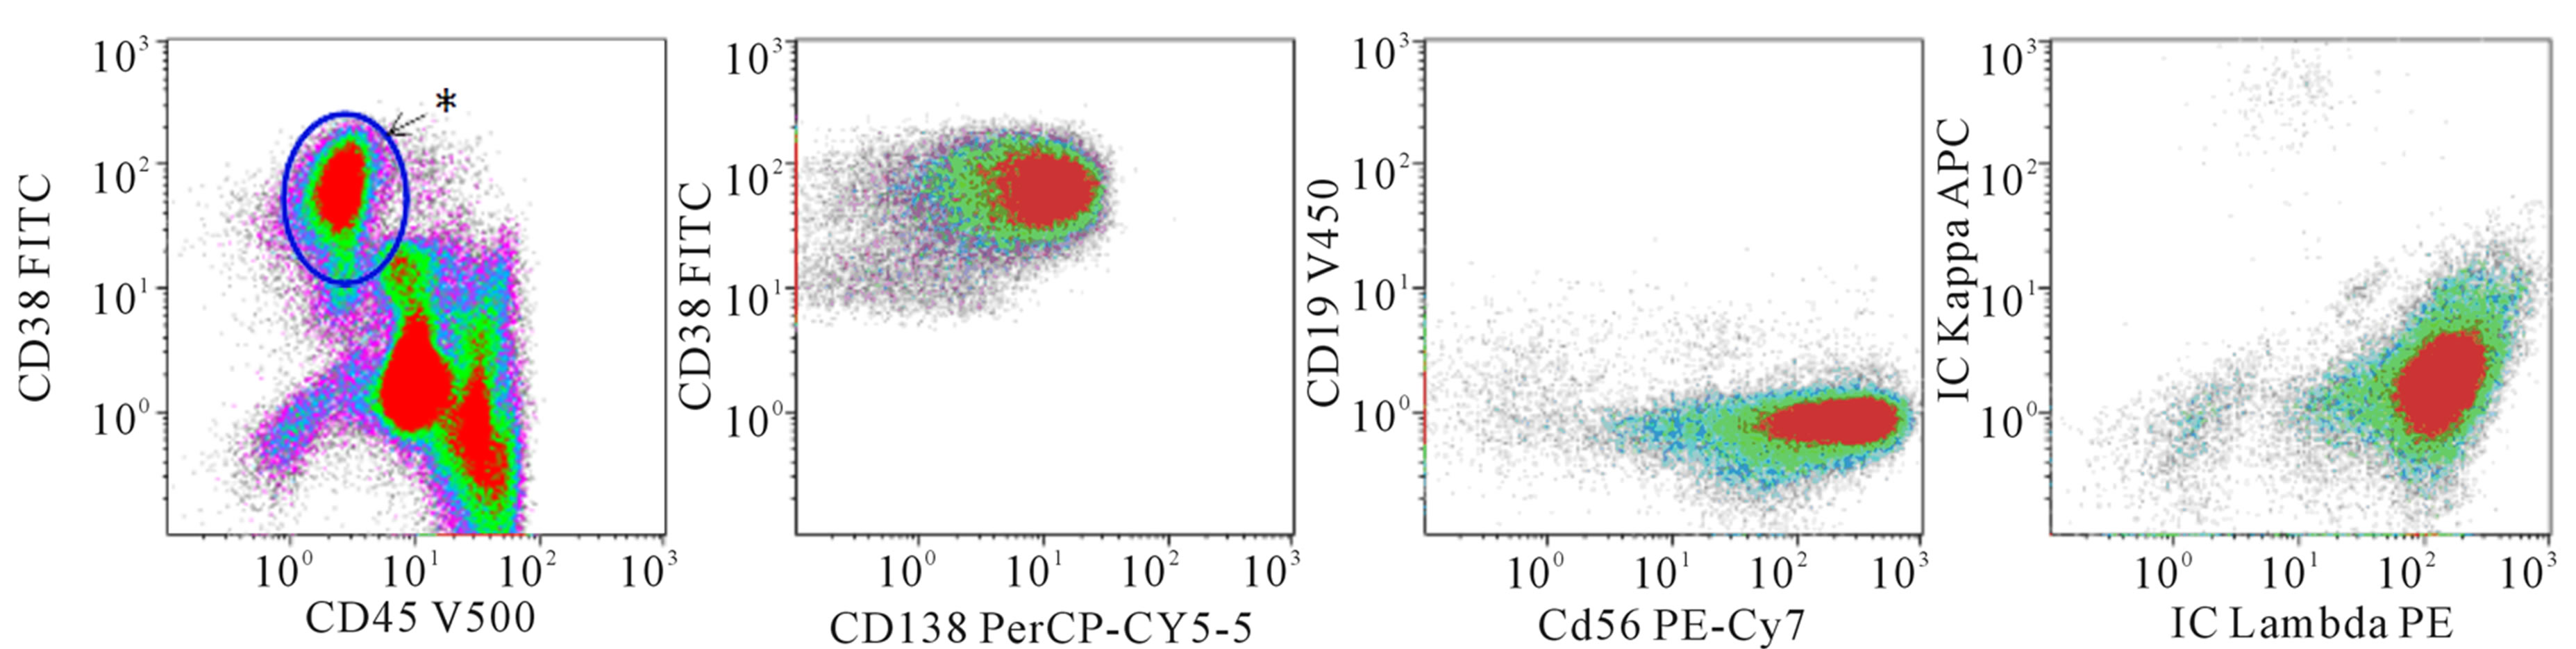 (a) Diagnosis
 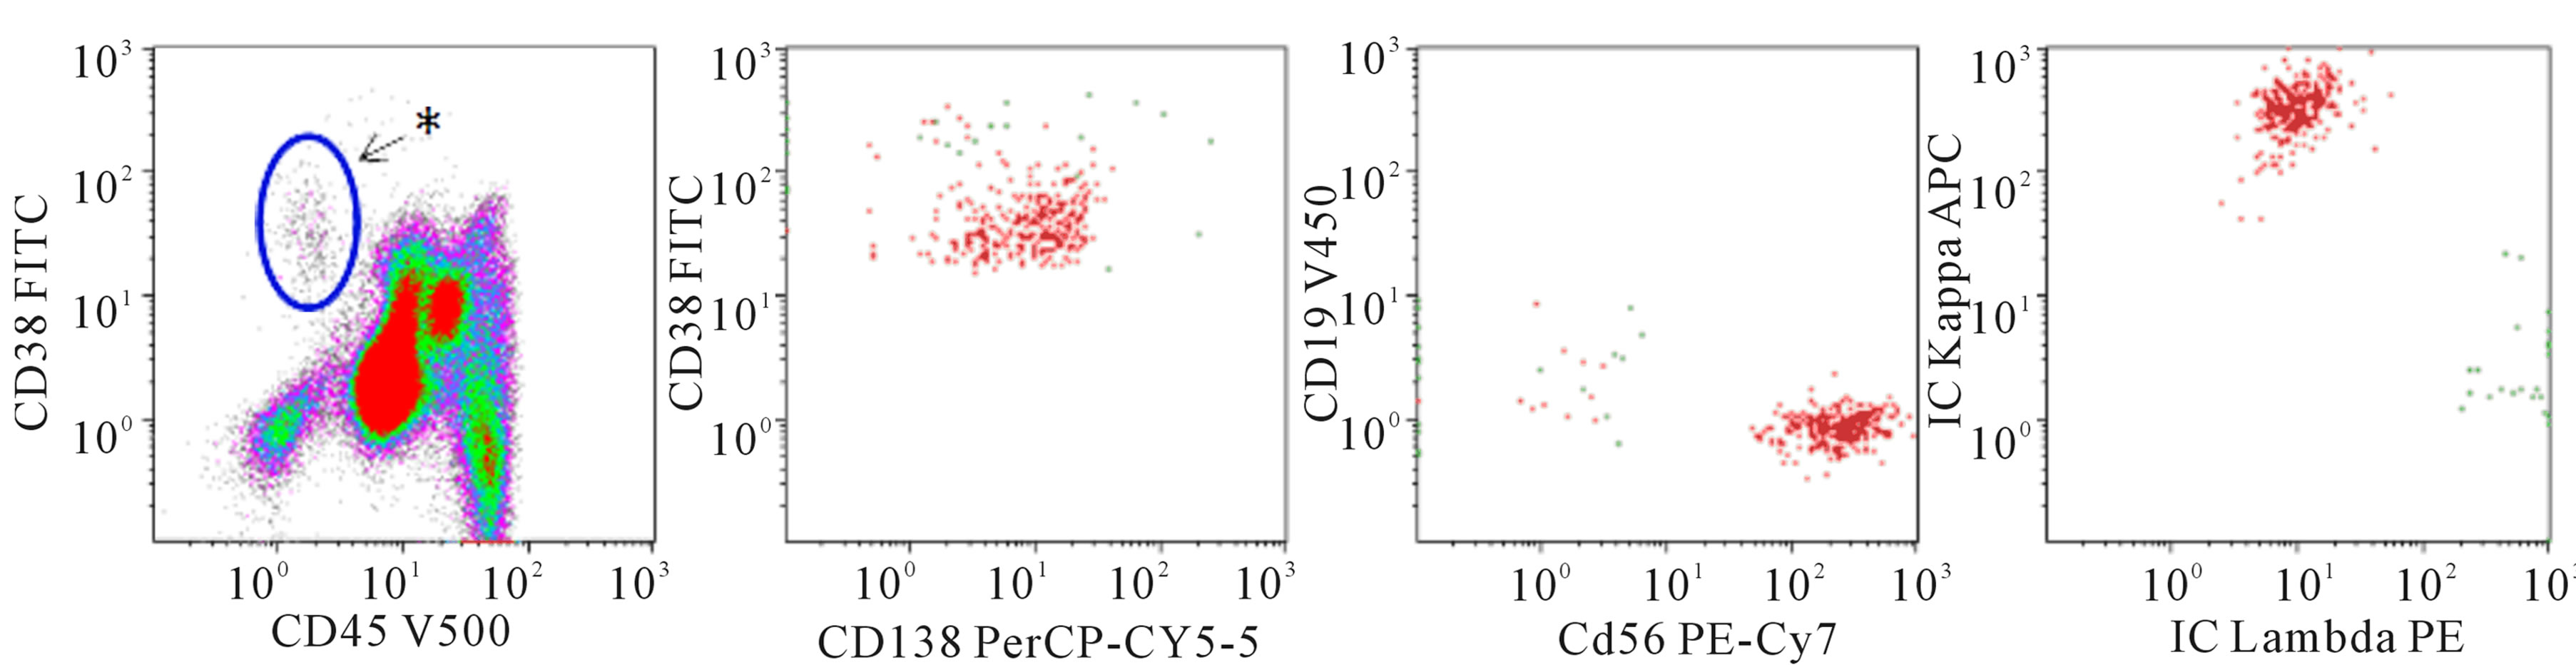 (b) Residual disease
Figure 1. 8-color flow cytometry was performed on a BD FACSCanto II with the following markers: CD19, CD20, CD38, CD45, CD56, CD138, cytoKAPPA, cytoLAMBDA. Cells are fixed and permeabilized for cytoplasmic KAPPA and LAMBDA staining. Individual fluorochromes are listed on the axes. CD20 (not shown) is conjugated to APC-H7. Data were analyzed with Kaluza ® v 1.2 software. (a) Multicolor flow cytometry performed on a marrow aspirate from a patient with a new diagnosis of a plasma cell neoplasm. In the left-most plot, the asterisk denotes where we typically find normal plasma cells. This patient has a large increase in plasma cells (15% of leukocytes) that have decreased CD45 expression (population circled). In addition, while the surface expression of CD38 is brighter than the lymphocytes and granulocytes, it is slightly lower in the group of neoplastic plasma cells compared to normal plasma cells. The plasma cell population is gated and viewed in the 3 plots to the right. The plasma cells express CD138, but they lack CD19. CD56 is aberrantly expressed. The plasma cells are restricted for cytoplasmic lambda light chains; (b) Multicolor flow cytometry performed on a marrow aspirate from a patient with a diagnosis of multiple myeloma. While there are a few plasma cells with normal CD45 expression (near the asterisk), there is a collection of plasma cells with decreased CD45 and slightly decreased CD38. This population comprises 0.1% of leukocytes. The plasma cells have an atypical immunophenotype with 1) decreased CD45, 2) decreased/absent CD19 expression, 3) aberrant expression of CD56 and 4) kappa light chain restriction.
antigen expressed by the clone pre-treatment. The shifts are most often seen in CD45 in terms of gain of expression and brightness of intensity followed by gain of CD19 and CD20 [15]. Any panel including all these markers, as suggested previously, might therefore be able to account for changes in the immunophenotype. Finally, expression of cytoplasmic κ and λ alone is not adequate for assessment of MRD, since the polyclonal background may be intense and monoclonal plasma cells are needed in high numbers for accurate distinction.
8. Predictive and Prognostic Implications
In addition to their diagnostic utility, flow cytometric expression of CD45, CD117, CD28, CD20 and CD56 has been found to have prognostic and predictive implications.
Studies have found higher percentages of CD45+ myeloma cells in MGUS and asymptomatic MM compared to symptomatic and relapsed cases, and a lower percentage of CD45+ in patients with bone lesions and high-grade angiogenesis [16]. CD45 positivity in MM, therefore, correlates with better overall survival (CD45+, 39 months vs CD45−, 18 months). CD117 is expressed with equal intensity in both MGUS and MM and is associated with better progression-free and overall survival in MM [17]. Conversely, CD28, when expressed, is bright in MM compared to MGUS and its expression correlates with the presence of t(11;14), t(4;14), deletion of 17p and 13q, non-hyperdiploid karyotype, and is considered an aggressive phenotype [4]. Cases with expression of both CD28 and CD117 on multivariate analysis have prognosis comparable to CD28+ cases and do not show favorable prognosis associated with CD28- CD117+ cases [17]. Similarly, although CD19 is expressed in 5% of myelomas in a study by Mateo et al., its presence has been shown to have lower progression free and overall survival in univariate but not in multivariate analysis [17]. CD20+ myeloma cells tend to have small plasma cell morphology and presence of t(11;14), and although there are some studies that have shown association with poor overall survival, the prognostic implications are not well established [18]. Although lack of CD56 expression in MM has been shown to correlate with fewer lytic bone lesions [19] and CD56 positivity is associated with presence of neoplastic plasma cells in circulation, conflicting studies [18] regarding flow cytometric expression of CD56 and prognosis in MM undermine its utility as a prognostic marker.
9. Emerging Markers—Cues from Preclinical Models
While flow cytometry has been useful to determine whether there is an atypical plasma cell clone, immunophenotypic data are not routinely used to predict chemotherapeutic response. We previously described a murine model of MM that has similar characteristics to human MM [20-22]. Using tumor lines derived from this model, we identified genotypic and immunophenotypic features of resistance to the proteasome inhibitor bortezomib (Stessman, et al., submitted manuscript). Our data show that as the neoplastic plasma cells develop bortezomib resistance, they have a germinal center B cell like immunophenotype, including decreased to absent expression of CD69, CD93, and CXCR4. While CD93 has been studied extensively in the mouse and has been found to be important for B and plasma cell development particularly for the maintenance of long-lived plasma cells in the bone marrow [23], its homolog in humans has not been studied in plasma cells. CD69 has not been studied in human multiple myeloma or in plasma cells, though it has been shown that human chronic lymphocytic lymphoma cells, when induced toward a plasma cell phenotype with tetradecanoyl phorbol acetate (TPA) have increased CD69 expression [24].
CXCR4 expression by human B and plasma cells is much more widely described in the literature—its expression plays an important role in the migration and homing of plasma cells to the bone marrow. In non-neoplastic condition, such as systemic lupus erythematosus (SLE) and ulcerative colitis (UC), CXCR4 has differential expression. In one study, patients with SLE were found to have decreased non-switched memory B cells; however these cells had increased CXCR4 expression and elevated serum SLE auto-antibodies, suggesting that the B cells had a more plasma cell like phenotype [25]. In a study of patients with inflammatory bowel disease, patients with ulcerative colitis or Crohn’s disease were more likely to have circulating peripheral blood immature plasma cells with higher CXCR4 expression [26]. However, it appears that most human plasma cells express some degree of CXCR4, including those found in the peripheral blood [27]. In one study myeloma plasma cells had lower surface CXCR4 expression than nonneoplastic plasma cells [28]. Additionally, CXCR4 expression can be modulated by drug treatment. Treatment of myeloma cell lines with thymoquinone (the major active component of the medicinal herb Nigella sativa Linn) results in decreased CXCR4 expression, possibly by inhibiting CXCL12 [29]. This is further supported by studies that demonstrate that the CXCR4 inhibitor AMD3100 disrupts the interaction between the myeloma cells and the bone marrow, enhancing their chemosensitivity [30] Finally, thalidomide therapy has been shown to decrease CXCR4 expression by myeloma cells in patients undergoing treatment, compared to their original diagnostic specimen [31]. The role that these new emerging markers will play in the clinical lab is uncertain and will require additional study.
10. Summary
In summary, flow cytometry in the useful in the diagnosis of PCNs and in the estimation of minimal residual disease detection (MRD) after therapy. The role of using flow cytometry for prognostication of MM and predicting chemotherapeutic response is still evolving. While CD19, CD20, CD38, CD45, CD56, CD138 and cytoplasmic κ and λ can identify most of the neoplastic plasma cell clones, additional markers such as CD27, CD28 and CD229 may be useful additional markers. Although flow cytometry provides a very high sensitivity of 0.01% in MRD analysis in myeloma, antigenic shifts, hemodilution, and unintentional plasma cell lysis during processing may be the biggest challenges in accurate assessment. A careful assessment for variable light and forward scatter profiles of plasma cells, not just at diagnosis, but also during follow-up post-treatment especially for CD45 and CD20 must be done. Finally, the intensity of expression of CD45, CD20 and CD56 along with new markers such as CD117 and CD28 correlates with specific cytogenetic abnormalities, treatment response and progression free survivals, hence this information from flow cytometry can help in appropriate development of and triaging based on institution specific or centralized treatment protocols.
REFERENCES
- S. Cherian and B. Wood, “Flow Cytometry in Evaluation of Hematopoietic Neoplasms,” CAP Press, Northfield, 2012.
- F. E. Craig and K. A. Foon, “Flow Cytometric Immunophenotyping for Hematologic Neoplasms,” Blood, Vol. 111, No. 8, 2008, pp. 3941-3967. doi:10.1182/blood-2007-11-120535
- The International Agency for Research on Cancer (IARC), “WHO Classification of Tumours of Haematopoietic and Lymphoid Tissue,” 4th Edition, World Health Organization, Lyon, 2008.
- H. E. Johnsen, M. Bøgsted, T. W. Klausen, et al., “Multiparametric Flow Cytometry Profiling of Neoplastic Plasma Cells in Multiple Myeloma,” Cytometry Part B: Clinical Cytometry, Vol. 78B, No. 5, 2010, pp. 338-347. doi:10.1002/cyto.b.20523
- R. Bataille, G. Jégo, N. Robillard, et al., “The Phenotype of Normal, Reactive and Malignant Plasma Cells. Identification of ‘Many and Multiple Myelomas’ and of New Targets for Myeloma Therapy,” Haematologica, Vol. 91, No. 9, 2006, pp. 1234-1240.
- A. C. Rawstron, A. Orfao, M. Beksac, et al., “Report of the European Myeloma Network on Multiparametric Flow Cytometry in Multiple Myeloma and Related Disorders,” Haematologica, Vol. 93, No. 3, 2008, pp. 431- 438. doi:10.3324/haematol.11080
- P. Lin, R. Owens, G. Tricot and C. S. Wilson, “Flow Cytometric Immunophenotypic Analysis of 306 Cases of Multiple Myeloma,” American Journal of Clinical Pathology, Vol. 121, No. 4, 2004, pp. 482-488. doi:10.1309/74R4TB90BUWH27JX
- E. Cannizzo, G. Carulli, L. Del Vecchio, et al., “The Role of CD19 and CD27 in the Diagnosis of Multiple Myeloma by Flow Cytometry: A New Statistical Model,” American Journal of Clinical Pathology, Vol. 137, No. 3, 2012, pp. 377-386. doi:10.1309/AJCP63TOCFNAMDMS
- B. Paiva, N. C. Gutiérrez, X. Chen, et al., “Clinical Significance of CD81 Expression by Clonal Plasma Cells in High-Risk Smoldering and Symptomatic Multiple Myeloma Patients,” Leukemia, Vol. 26, No. 8, 2012, pp. 1862- 1869. doi:10.1038/leu.2012.42
- D. Atanackovic, J. Panse, Y. Hildebrandt, et al., “Surface Molecule CD229 as a Novel Target for the Diagnosis and Treatment of Multiple Myeloma,” Haematologica, Vol. 96, No. 10, 2011, pp. 1512-1520. doi:10.3324/haematol.2010.036814
- C. Lee, B. A. Guinn, S. E. Brooks, D. Richardson and K. Orchard, “CD66a (CEACAM1) Is the Only CD66 Variant Expressed on the Surface of Plasma Cells in Multiple Myeloma: A Refined Target for Radiotherapy Trials?” British Journal of Haematology, Vol. 149, No. 5, 2010, pp. 795-796. doi:10.1111/j.1365-2141.2010.08100.x
- E. Pérez-Persona, M.-B. Vidriales, G. Mateo, et al., “New Criteria to Identify Risk of Progression in Monoclonal Gammopathy of Uncertain Significance and Smoldering Multiple Myeloma Based on Multiparameter Flow Cytometry Analysis of Bone Marrow Plasma Cells,” Blood, Vol. 110, No. 7, 2007, pp. 2586-2592. doi:10.1182/blood-2007-05-088443
- S. V. Rajkumar, G. Gahrton and P. L. Bergsagel, “Approach to the Treatment of Multiple Myeloma: A Clash of Philosophies,” Blood, Vol. 118, No. 12, 2011, pp. 3205- 3211. doi:10.1182/blood-2011-06-297853
- R. Gupta, A. Bhaskar, L. Kumar, A. Sharma and P. Jain, “Flow Cytometric Immunophenotyping and Minimal Residual Disease Analysis in Multiple Myeloma,” American Journal of Clinical Pathology, Vol. 132, No. 5, 2009, pp. 728-732. doi:10.1309/AJCP1GYI7EHQYUYK
- W. Cao, C. L. Goolsby, B. P. Nelson, S. Singhal, J. Mehta and L. C. Peterson, “Instability of Immunophenotype in Plasma Cell Myeloma,” American Journal of Clinical Pathology, Vol. 129, No. 6, 2008, pp. 926-933. doi:10.1309/8UVF7YQ1D4D4ETQV
- S. Kumar, S. V. Rajkumar, T. Kimlinger, P. R. Greipp and T. E. Witzig, “CD45 Expression by Bone Marrow Plasma Cells in Multiple Myeloma: Clinical and Biological Correlations,” Leukemia, Vol. 19, No. 8, 2005, pp. 1466-1470. doi:10.1038/sj.leu.2403823
- G. Mateo, M. A. Montalbán, M. B. Vidriales, et al., “Prognostic Value of Immunophenotyping in Multiple Myeloma: A Study by the PETHEMA/GEM Cooperative Study Groups on Patients Uniformly Treated with HighDose Therapy,” Journal of Clinical Oncology, Vol. 26, No. 16, 2008, pp. 2737-2744. doi:10.1200/JCO.2007.15.4120
- N.-T. Ngo, C. Brodie, C. Giles, et al., “The Significance of Tumour Cell Immunophenotype in Myeloma and Its Impact on Clinical Outcome,” Journal of Clinical Pathology, Vol. 62, No. 11, 2009, pp. 1009-1015. doi:10.1136/jcp.2009.065128
- S. A. Ely and D. M. Knowles, “Expression of CD56/ Neural Cell Adhesion Molecule Correlates with the Presence of Lytic Bone Lesions in Multiple Myeloma and Distinguishes Myeloma from Monoclonal Gammopathy of Undetermined Significance and Lymphomas with Plasmacytoid Differentiation,” The American Journal of Pathology, Vol. 160, No. 4, 2002, pp. 1293-1299. doi:10.1016/S0002-9440(10)62556-4
- K. L. M. Boylan, M. A. Gosse, S. E. Staggs, et al., “A Transgenic Mouse Model of Plasma Cell Malignancy Shows Phenotypic, Cytogenetic, and Gene Expression Heterogeneity Similar to Human Multiple Myeloma,” Cancer Research, Vol. 67, No. 9, 2007, pp. 4069-4078. doi:10.1158/0008-5472.CAN-06-3699
- W. C. Cheung, J. S. Kim, M. Linden, et al., “Novel Targeted Deregulation of c-Myc Cooperates with Bcl-X(L) to Cause Plasma Cell Neoplasms in Mice,” The Journal of Clinical Investigation,” Vol. 113, No. 12, 2004, pp. 1763-1773.
- M. Linden, N. Kirchhof, C. Carlson and B. Van Ness “Targeted Overexpression of Bcl-XL in B-Lymphoid Cells Results in Lymphoproliferative Disease and Plasma Cell Malignancies,” Blood, Vol. 103, No. 7, 2004, pp. 2779-2786. doi:10.1182/blood-2003-10-3399
- S. Chevrier, C. Genton, A. Kallies, et al., “CD93 Is Required for Maintenance of Antibody Secretion and Persistence of Plasma Cells in the Bone Marrow Niche,” Proceedings of the National Academy of Sciences of the United States of America, Vol. 106, No. 10, 2009, pp. 3895-3900. doi:10.1073/pnas.0809736106
- G. B. Segel, T. J. Woodlock, J. Xu, et al., “Early Gene Activation in Chronic Leukemic B Lymphocytes Induced toward a Plasma Cell Phenotype,” Blood Cells, Molecules & Diseases, Vol. 30, No. 3, 2003, pp. 277-287. doi:10.1016/S1079-9796(03)00035-4
- B. Rodríguez-Bayona, A. Ramos-Amaya, J. J. PérezVenegas, C. Rodríguez and J. A. Brieva, “Decreased Frequency and Activated Phenotype of Blood CD27 IgD IgM B Lymphocytes Is a Permanent Abnormality in Systemic Lupus Erythematosus Patients,” Arthritis Research & Therapy, Vol. 12, No. 3, 2010, pp. R108-R117. doi:10.1186/ar3042
- S. Hosomi, N. Oshitani, N. Kamata, et al., “Increased Numbers of Immature Plasma Cells in Peripheral Blood Specifically Overexpress Chemokine Receptor CXCR3 and CXCR4 in Patients with Ulcerative Colitis,” Clinical and Experimental Immunology, Vol. 163, No. 2, 2011, pp. 215-224. doi:10.1111/j.1365-2249.2010.04290.x
- A. Caraux, B. Klein, B. Paiva, et al., “Circulating Human B and Plasma Cells. Age-Associated Changes in Counts and Detailed Characterization of Circulating Normal CD138− and CD138+ Plasma Cells,” Haematologica, Vol. 95, No. 6, 2010, pp. 1016-1020. doi:10.3324/haematol.2009.018689
- M. S. Iqbal, K.-I. Otsuyama, K. Shamsasenjan, et al., “Constitutively Lower Expressions of CD54 on Primary Myeloma Cells and Their Different Localizations in Bone Marrow,” European Journal of Haematology, Vol. 83, No. 4, 2009, pp. 302-312. doi:10.1111/j.1600-0609.2009.01284.x
- G. Badr, E. A. Lefevre and M. Mohany, “Thymoquinone Inhibits the CXCL12-Induced Chemotaxis of Multiple Myeloma Cells and Increases Their Susceptibility to Fas-Mediated Apoptosis,” PLoS One, Vol. 6, No. 9, 2011, p. e23741. doi:10.1371/journal.pone.0023741
- A. K. Azab, J. M. Runnels, C. Pitsillides, et al., “CXCR4 Inhibitor AMD3100 Disrupts the Interaction of Multiple Myeloma Cells with the Bone Marrow Microenvironment and Enhances Their Sensitivity to Therapy,” Blood, Vol. 113, No. 18, 2009, pp. 4341-4351. doi:10.1182/blood-2008-10-186668
- A. M. Oliveira, D. A. Maria, M. Metzger, et al., “Thalidomide Treatment Down-Regulates SDF-1α and CXCR4 Expression in Multiple Myeloma Patients, Leukemia Research, Vol. 33, No. 7, 2009, pp. 970-973. doi:10.1016/j.leukres.2008.09.018