Natural Resources
Vol.5 No.5(2014), Article ID:44816,15 pages
DOI:10.4236/nr.2014.55017
Effect of γ-Valerolactone Blending on Engine Performance, Combustion Characteristics and Exhaust Emissions in a Diesel Engine
Ákos Bereczky1*, Kristóf Lukács1, Mária Farkas2, Sándor Dóbé2*
1Department of Energy Engineering, Budapest University of Technology and Economics, Budapest, Hungary
2Institute of Materials and Environmental Chemistry, Research Centre for Natural Sciences, Hungarian Academy of Sciences, Budapest, Hungary
Email: *bereczky@energia.bme.hu, *dobe.sandor@ttk.mta.hu
Copyright © 2014 by authors and Scientific Research Publishing Inc.
This work is licensed under the Creative Commons Attribution International License (CC BY).
http://creativecommons.org/licenses/by/4.0/


Received 1 January 2014; revised 9 February 2014; accepted 6 March 2014
ABSTRACT
γ-valerolactone (GVL) is a C5-cyclic ester that can be produced from biomass providing a potentially renewable fuel for transportation and feedstock for the chemical industry. Experiments were performed with fossil diesel (D), D + biodiesel (BD) and D + BD + GVL blends. A four-cylinder, turbocharged direct injection diesel engine was used for the tests. The engine was coupled to a dynamometer to vary the load. CO, NOx, THC and smoke emissions were measured by using a multi-channel gas analyzer. Combustion characteristics were assessed by in-cylinder pressure data with respect to crank angle and the derived heat release rates. Compared with D, and D + BD blends, addition of GVL had relatively little effect on engine performance and NOx emission, but reduced the exhaust concentration of CO, unburned fuel and smoke significantly. The smoke reduction is particularly notable in view of the very recent suggestion that black carbon is the second most important greenhouse gas in the atmosphere next to carbon dioxide. No diesel engine study with GVL has been reported so far.
Keywords:Second Generation Biofuel, γ-Valerolactone, Diesel Blend, Engine Performance, Emissions

1. Introduction
Energy security and concerns related to climate change as well as the need to provide subsistence for rural communities have led to worldwide interest in the production and use of biofuels over the past decades (see e.g. [1] and a selection of recent review articles in [2] ). The principal biofuels under consideration are alcohols (most notably bioethanol) and methyl esters of long chain fatty acids (FAMEs), usually also referred to as “biodiesel”, which are typically used blended in gasoline and fossil diesel, respectively.
Life-cycle analyses have questioned the sustainability of many first generation biofuels, such as corn ethanol, stimulating worldwide interest in second generation (2G) biofuels. 2G biofuels are produced from non-edible lignocellulosic raw materials, which constitute a huge renewable source of biomass providing the potential of mitigating global warming [3] [4] .
Following the pioneering work of Horváth and co-workers [5] [6] , multiple catalytic methods have been developed in recent years for the production of γ-valerolactone (GVL) from carbohydrates [7] [8] and even directly from biomass feedstock [9] [10] . GVL is a sweet odour cyclic ester that occurs naturally in fruits and it has long been used as a food additive. It is liquid in a wide temperature range (−30˚C - 208˚C), which does not hydrolize and form peroxides, therefore it is easy and safe to store and transport.

γ-valerolactone (GVL)
In recent years, GVL has become the focus of interest for organic chemists as a sustainable, versatile platform molecule and for use as a green solvent: an excellent review of the subject has been published [8] . GVL has been widely considered also as a potential biofuel. In contrast with this, to our knowledge, there has been just a single study published on the application of GVL as an automotive fuel: mixtures of 90% (v/v) conventional gasoline with 10% GVL and with 10% ethanol have been demonstrated to have practically the same research octane numbers and similar physical properties [5] ; no engine performance and emission issues were addressed, however.
As part of an ongoing research program on the applicability of GVL as a fuel in IC engines, and concerning its combustion kinetics, and atmospheric chemistry, we report here our first results. The effect of GVL on diesel engine performance, combustion characteristics and exhaust emissions was studied for assessing its potential as a diesel blend. Comparative experiments were performed with fossil diesel, diesel-biodiesel and dieselbiodiesel-GVL fuels.
Our preliminary tests showed GVL to have a low cetane number (CN) and it is known to have a comparable low heating value (Table 1). These drawbacks may be compensated, however, by its potentially advantageous effects on the emission characteristics when used blended in fossil diesel. In particular, the reduction of smoke emission would be of great value. Particulates (PM) associated with diesel exhaust are of very small size; they have large surface areas with adsorbed species; some of which are strongly mutagenic and carcinogenic [11] . Moreover, according to a very recent comprehensive study, the contribution of soot (black carbon) to global warming is much higher than that previously thought [12] . Its impact on the climate is larger than that of methane and roughly amounts to two-thirds of that of carbon dioxide thus ranking black carbon the second largest man-made contributor to global warming [12] . Note that diesel emissions are major sources of black carbon worldwide [11] .
2. Experimental
2.1. Test Engine Setup
The test engine facility has been described previously [13] -[15] . It can be divided into three main parts: 1), the compression ignition engine coupled to a dynamometer, 2), an exhaust gas analyzer and 3), measurement control and data acquisition units (Figure 1).
An off-road, four-cylinder, turbocharged, direct injection, water-cooled diesel engine with exhaust gas recirculation (Audi-VW 1.9L TDI) was used to perform the experiments. The main technical specifications of the engine were the following: bore × stroke, 79.5 × 95.5 mm; compression ratio, 19.5:1; maximum power, 66 kW at 4000 rpm; peak torque, 202 Nm at 4000 rpm; injection pressure, 180 bar. The diesel fuels were introduced into the engine from a fuel tank equipped with a fuel mass flow meter (AVL 7131). All tests were performed on the unmodified diesel engine.

Figure 1. Schematic layout of the engine test bed: 1: VW-AUDI 1Z CI engine; 2: Borghi & Saveri eddy-current dynamometer; 3: fuel consumption measuring system; 4: Horiba emission analyser; 5: optical encoder; 6: piezo transducer with charge amplifier; 7: fuel temperature controller; 8: intercooler temperature controller; 9: smoke meter; 10: indication system; 11: test system controller PC.
A Borghi & Saveri (type FE-350S) eddy-current dynamometer was used for loading the diesel engine. It allowed the braking load (M) and rotation speed (N) to be varied in a wide range independently from each other (maximum power 257 kW, maximum speed 8000 rpm, maximum torque 1400 N m).
A Horiba Mexa-820 exhaust gas analyzer was applied to analyze engine emissions. The Horiba system has different modules to measure a variety of chemical species including the regulated emissions of NO/NOx (NO + NO2) using a chemiluminescence analyzer (H.CLD, CLA-53M), total unburned hydrocarbons (THC) using a flame ionization detector (H.FID, FIA-22), and CO/CO2 using a nondispersive infrared (NDIR, AIA-23) detector. Before starting the measurements, the gas analyzer was calibrated by known gas mixtures. The emitted PM concentration was measured by a smoke meter (AVL-415). The sampling system was placed before the oxidation catalytic converter in the exhaust pipe of the engine. A K-type thermocouple (Omega Eng. Inc.) was used to monitor the exhaust gas temperature (EGT).
An integrated hardware-software system of units organised by a master PC and LabView programme made possible the on-line control of most of the experimental parameters and simultaneous measurement of engine performance and emission characteristics. The dynamometer settings and the engine throttle were controlled and the respective data acquired by a test assistant control system. Indication diagrams were obtained by measuring the pressure (p) inside one of the piston cylinders with a pressure transducer (Kistler KIAG 6031) which was connected to a charge amplifier. The crank angle (θ) positions needed were attained at the crankshaft by using an optical encoder (Hengstler RI32). The p-θ signals were fed into a SMETEC-COMBI PC indication system for data acquisition. The data acquisition system was externally triggered 1024-times in one revolution by the encoder. The measured emission, temperature and flow data were recorded also by a computer in real time.
2.2. Test Fuels
The fossil diesel (2-D), used as the base fuel, and the biodiesel (FAME) were obtained from commercial sources in Hungary. GVL (≥98%, FCC, FG) was supplied by Sigma-Aldrich (SAFC). Some properties of these fuels are given in Table 1.
Solubility tests were performed prior to the preparation of fuel blends by visual inspection. γ-valerolactone (GVL) was well miscible with biodiesel (BD), but showed poor solubility in conventional diesel fuel (<2.5 v/v% at room temperature). In a three-component blend, biodiesel served as a co-solvent mitigating GVL solubility to

Table 1. Selected properties of fuels used in the experiments.
aEN 14214 limit. bASTM D676 limit. cDetermined by the EN ISO 5165:1999 method.
quite some extent. A mixture of 10:3:1 (v/v) = 71.4% diesel (D): 21.5% biodiesel (BD): 7.1% γ-valerolactone (GVL) was found stable for a prolonged time at room temperature.
3. Results and Discussions
3.1. Operating Conditions
Engine performance and emission tests were carried out by using the following fuels: 1), 100% D; 2), 76.9% D + 23.1% BD and, 3), 71.4% D + 21.5% BD + 7.1% GVL. The varied experimental parameters were the engine brake torque (M), i.e., load, and the engine speed (N). The brake torque was set, on average, to 44, 87, 131 and 172 N m corresponding to 25%, 50%, 75% and 100% engine load, respectively. Tests were performed at the engine rotational speeds of 1900, 2000, 2200, 2500 and 3000 rpm. Experiments with the different fuel blends were conducted back-to-back by maintaining the very same operational conditions in each run.
Several performance parameters and emission data were determined among which we report and discuss here the brake power (BP), brake specific fuel consumption (BSFC), indicator diagrams, as well as the exhaust gas concentrations for total unburned hydrocarbons (THC), carbon monoxide (CO), nitrogen oxides (NOx) and smoke (PM).
3.2. Engine Performance
3.2.1. Brake Power (BP)
The variation in engine power at maximum load with different engine speeds is shown in Figure 2. As seen, there are no noticeable differences in the measured power output between the studied 100% D and 77% D + 23% BD fuels. Inclusion of GVL, that is, the use of the blend 71% D + 22% BD + 7% GVL results in systematically, but only slightly lower BP: on average, the engine power is less by 3.2% compared with the neat diesel fuel case. The reduction of brake power by GVL is in accordance with the significantly lower calorific value of this blend component (Table 1). Biodiesel possesses also lower heating value compared with fossil diesel, but the reduction in brake power for the D-BD blend is somewhat less than expected because of the possible power recovery effects [19] -[21] . The brake power increases with the increase of engine speed approximately linearly up to ~2500 rpm for all tested fuels. At even higher speed, the change becomes slower likely due to a growing increase of engine friction losses. Moreover, BP has been found to increase linearly at constant speed with the increase of engine load which is the expected behavior and reflects essentially the consistency of the results obtained with the current test apparatus.
3.2.2. Brake Specific Fuel Consumption
Variation of BSFC with engine speed at maximum load is presented in Figure 3. The best performance was

Figure 2. BP at full load as a function of engine speed for D, D-BD and D-BD-GVL blends.
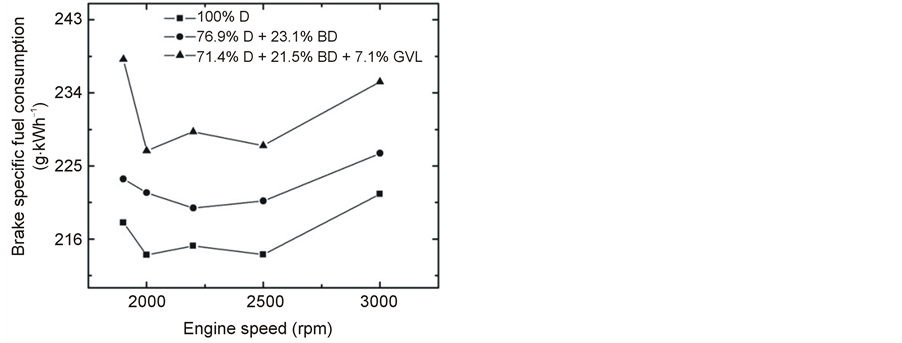
Figure 3. BSFC at full load as a function of engine speed.
provided by the neat diesel fuel, while the three-component blend showed the highest specific fuel consumption. On average, BSFC was higher by 2.7% when the (76.9% D + 23.1% BD) blend was used, and it was higher by 6.8% in the case of the (71.4% D + 21.5% BD + 7.1% GVL) blend compared with 100% D.
BSFC is seen to go through a minimum at around 2400 - 2500 rpm with increasing engine speed (Figure 3). Similar BSFC curve was reported in the literature, e.g. in [22] and [23] . One possible explanation of the observed trend is that at lower speeds BSFC increases due to increased time for heat losses from the gas to the cylinder and piston walls and because of the lower charging pressure, while at high rotational speeds, the increasing frictional losses reduce the fuel efficiency [24] .
With the increase in load, the BSFC decreases (Figure 4), but the trend remains the same for the three fuels as noted above. This observation may be explained by the higher percentage of increase in brake power with load as compared to fuel consumption [19] .
It is generally accepted that the fuel consumption of a diesel engine operated with biodiesel or oxygenate blends is higher compared to the base-line fossil diesel because of the need to compensate for the loss of heating values of the blending fuel components (see, e.g., in [14] and the recent review paper by Xue et al. [19] ). Basically, this effect explains the higher specific fuel consumption for the diesel-biodiesel and diesel-biodiesel-GVL blends we have observed in our current work. The heating values of the 76.9% D + 23.1% BD and 71.4% D + 21.5% BD + 7.1% GVL blends are lower by ~2.7% and ~5.5%, respectively, compared to fossil diesel. These figures are to be compared with the respective increase in fuel consumption by 2.8% and 6.8%. Beside the lower heat content, the higher density and higher viscosity of BD and GVL, as well as the engine type and operating conditions also affect the fuel efficiency that may serve as an explanation for the slightly higher fuel consumption than expected by the differences in the heating values.
3.2.3. Brake Thermal Efficiency
Figure 5 shows the variation of BTE vs. engine speed at maximum load and Figure 6 gives its variation as a function of engine load at 2500 rpm. The BTE-N curves first increase, then decrease with increasing rotational speed, the maxima being at around 2500 rpm (Figure 5). The observed maximal thermal efficiency is practically the same for the three fuels studied: 38.8% ± 0.1%. BTE is the reciprocal of BSFC normalized to the heating value of the fuel. Thus, the observations concerning BTE are fully consistent with the slight increase of the fuel consumption for the D-BD and D-BD-GVL blends due to their lower heating values as discussed in the previous paragraph.
3.2.4. Indication Diagrams
The in-cylinder pressure versus crank angle data were measured at each test condition for the three fuels studied. P-θ traces for 100 consecutive cycles were recorded and then averaged to obtain a data set from which heat release rates were calculated. The calculation was based on the first law of thermodynamics for an open system assuming the contents of the combustion chamber to be uniform in temperature and pressure and to obey ideal gas law, supplying [14] [24] :
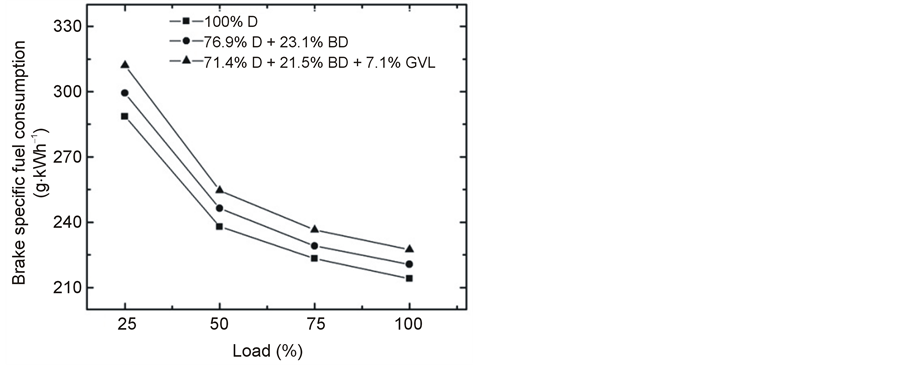
Figure 4. Variation of BSFC at 2500 rpm engine speed with increasing load.
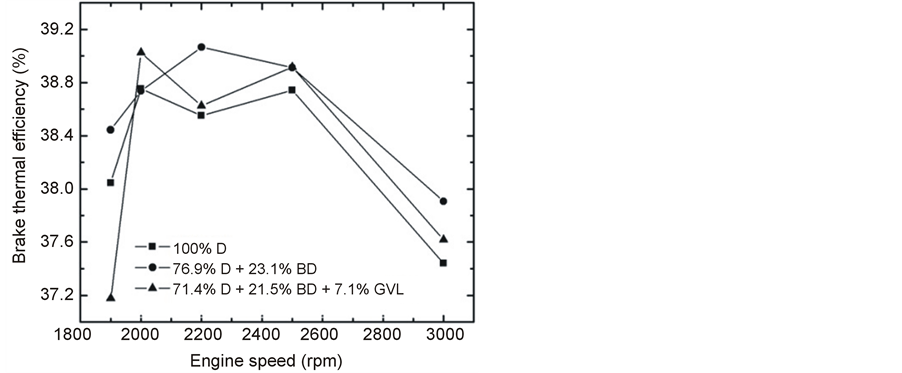
Figure 5. BTE at full load as a function of engine speed.
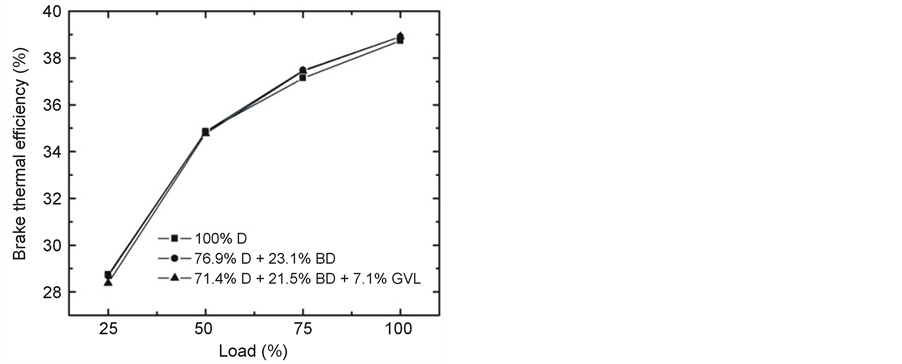
Figure 6. Variation of BTE at 2500 rpm engine speed with increasing load.
 (1)
(1)
where:
 is the net heat release rate [24]
(hereafter called “heat release rate” in short, HRR) and γ = cp/cv
is the ratio of the constant pressure and constant volume specific heat.
is the net heat release rate [24]
(hereafter called “heat release rate” in short, HRR) and γ = cp/cv
is the ratio of the constant pressure and constant volume specific heat.
The measured in-cylinder peak pressures are presented in Figure 7 as a function of engine speed at maximum load. The pressures are seen to increase with increasing speed up to about 2500 rpm and decrease above that for all three fuels studied. The fuel delivery advance angles increased from 8 to 12 BTCD (before top dead center) angles in the operation range of 1900 - 3000 rpm. The peak pressures are lower for the blended fuels compared with neat diesel, but the effect is less than one would expect by the reduced heating values: 100% D = 43, (76.9% D + 23.1% BD) = 41.9 and (71.4% D + 21.5% BD + 7.1% GVL) = 40.6 MJ/kg. This very same picture has emerged for the brake power as presented and discussed in Section 3.2.1.
Figures 8-10 show the averaged pressure vs. crank angle traces and the derived HRR diagrams at full load operation with 1900, 2500 and 3000 rpm engine speed. The p-θ data points are seen to display little variation at each engine speed for the three fuels studied. The heat release diagrams reveal more differences, which are, however, also of small extent. These features are consistent with the observed relatively small differences in the performance parameters of the tested three fuels. The heat release diagrams in Figures 8-10 present the bimodal distribution of HRRs which is characteristic for CI engines indicating a phase of premixed combustion followed by a phase of mixing controlled combustion [24] .
The measured peak cylinder pressures at 1900 rpm engine speed and full load were 114.3, 113.21 and 113.4 bar for the fuels 100% D, 76.9% D + 23.1% BD and 71.4% D + 21.5% BD + 7.1% GVL, respectively. Addition of GVL to the D + BD blend has left the peak pressure practically unchanged, which is understood by the compensating effect seen by the HRR diagram in Figure 8. The ignition delay time has slightly increased in the case of the three-component blend. This gave rise to an increased accumulation of fuel during the relatively longer delay period resulting in an increased HRR peak of the premixed combustion phase and so an increased gas pressure in the cylinder contrary to the lower heating value of the mixture. The pressure maximum occurred at 369.5˚CA (degree crank angle) for the D-BD-GVL blend and it was at 370.4˚CA for both D and the D-BD blends.
The peak cylinder pressures at the operating condition of 2500 rpm @ 100% load were 122.6, 122.0 and 121.1 bar for the fuels 100% D, 76.9% D + 23.1% BD and 71.4% D + 21.5% BD + 7.1% GVL, respectively. That is, just a small decrease, on average less than 1%, was observed for the peak pressures at going from neat diesel to the two and three component blends; the maxima were at 369.5˚CA for all three fuels studied. An inspection of the HRR graphs (Figure 9) unveils similar heat release rates for the oxygen-containing blends in the premixed combustion phase which are slightly more intense compared with fossil diesel, but there are no
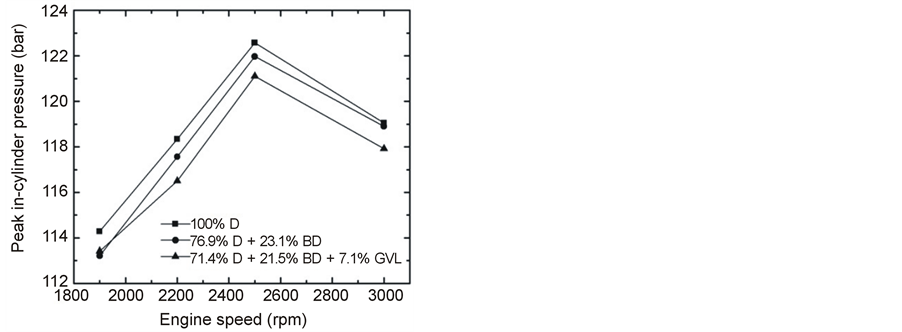
Figure 7. Peak in-cylinder pressures versus engine speed at full load.
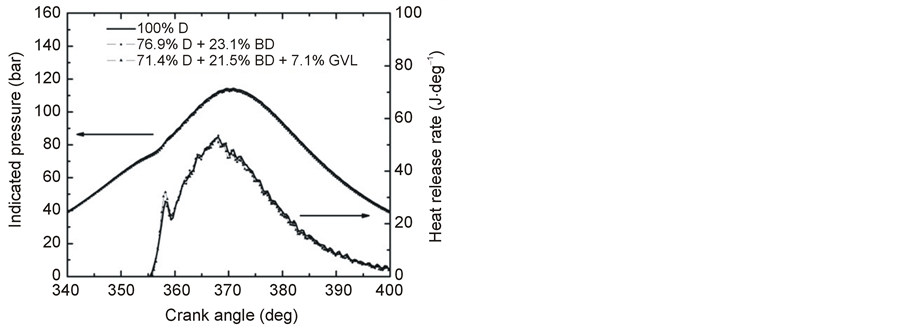
Figure 8. Variation of in-cylinder pressure and HRR versus crank angle at full load and 1900 rpm engine speed.
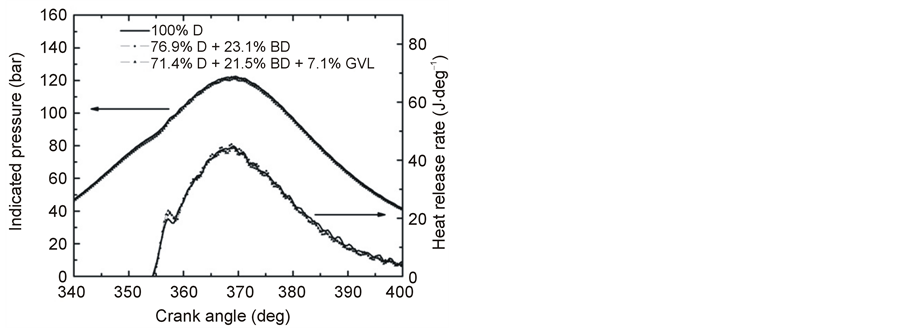
Figure 9. Variation of in-cylinder pressure and HRR versus crank angle at full load and 2500 rpm engine speed.
measurable differences in the ignition delays.
The maximum cylinder pressures measured at 3000 rpm engine speed and full load were the following: 100% D, 119.1 bar; (76.9% D + 23.1% BD), 118.9 bar; (71.4% D + 21.5% BD + 7.1% GVL), 117.9 bar. That is, the pressures have displayed but small decrease similar to that observed at lower engine speeds. At the engine parameters of 3000 rpm and 100% load, the HRR diagrams have revealed a small, but definite increase of the ignition delay times in the order D + BD + GVL > D + BD + GVL > D (Figure 10). As a consequence, the premixed combustion phase was the most intense when the engine was operated with the three-component fuel blend and it had the lowest intensity in the case of the fossil diesel fuel (Figure 10). Corresponding to the increased ignition delays, the maxima of the premixed combustion phase have shifted to slightly larger crank angles. Similar observations have been reported on the indication diagrams from comparative studies of diesel and biodiesel fuels [25] , but the reverse trend of a decreasing ignition delay with increasing biodiesel content of diesel blends has been concluded by other authors, see, e.g. [21] -[26] .
3.3. Exhaust Emissions
3.3.1. Total Unburned Hydrocarbons (THC)
At maximum load of the engine, the unburned fuel was significantly less in the exhaust gas when the fossil diesel was replaced by the diesel-biodiesel blend, and it was even further reduced in the case of the GVL-containing fuel (Figure 11). However, in practical applications when the engine is operated at lower loads, this advantageous effect would be less pronounced (Figure 12). One straightforward explanation for the reduced THC is the oxygen content of BD and GVL which may lead to more complete combustion [19] [27] .
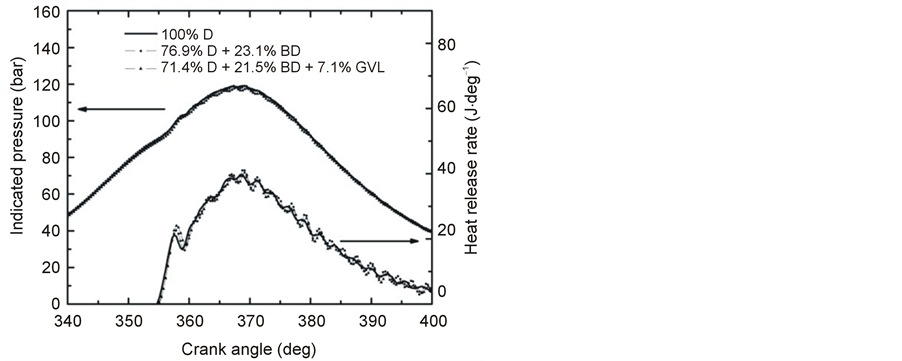
Figure 10. Variation of in-cylinder pressure and HRR versus crank angle at full load and 3000 rpm engine speed.
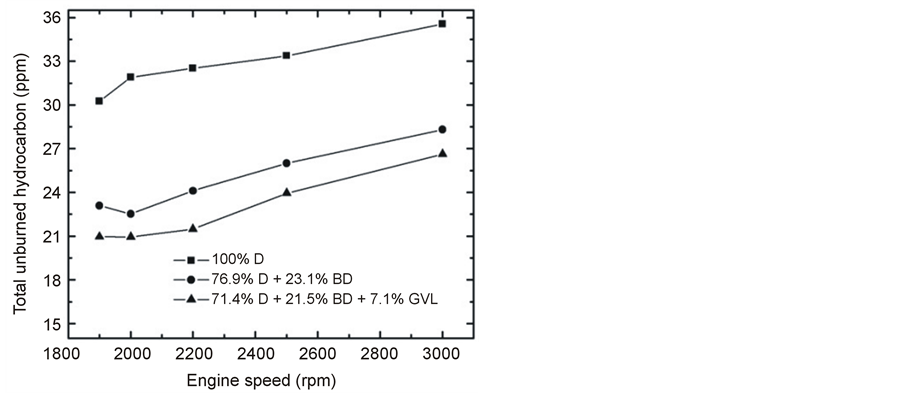
Figure 11. Emitted THC at full load as a function of engine speed.
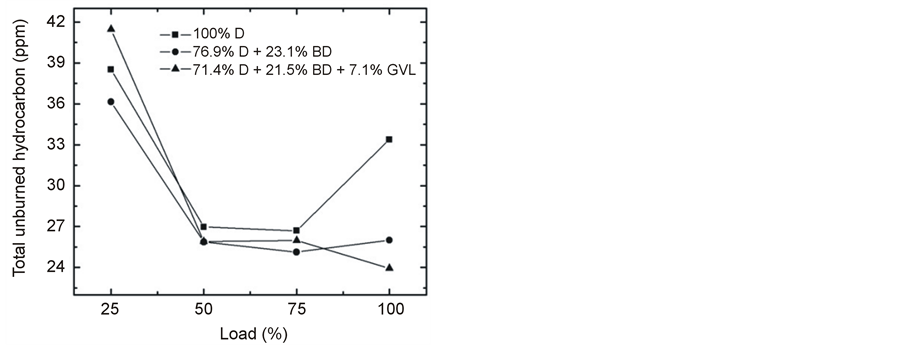
Figure 12. Variation of THC at 2500 rpm engine speed with increasing load.
3.3.2. Carbon Monoxide (CO)
The emitted CO at full engine load was reduced very significantly by the oxygen-containing blending components in the medium range of engine speed (Figure 13). On the other hand, the CO concentration was practically the same for all three fuels tested and increased with decreasing engine load at constant rotational speed (Figure 14). This latter observation can be explained by that lower loads result in lower combustion temperature and lower EGT (Figure 15) giving rise to less complete oxidation of the fuel and hence an increased emission of CO [14] [28] . Most of the papers in the literature report that CO emissions reduce when fossil diesel is replaced by biodiesel or biodiesel-oxygenate blends due to the higher oxygen content and lower carbon to hydrogen ratio [19] of these fuels which is basically consistent with our present findings.
3.3.3. Nitrogen Oxides (NOx)
NOx formation was found to decrease with an increase in engine speed at full load (Figure 16) that may have been primarily caused by a shorter residence time that was available for NOx formation [19] [21] . As load grew (Figure 17), the temperature became higher in the combustion chamber and NOx increased due to the strong temperature dependence of its formation [29] [30] . An indication for the soaring combustion temperature with increasing engine load was provided by the strong increase of the exhaust gas temperature (Figure 15). Favorably, the NOx emissions were very close to each other concerning the tested three fuels in contrast with many literature sources that reported an increase of NOx when blends of biodiesel or other oxygenates were compared with conventional diesel fuel [19] [29] .
3.3.4. Smoke (PM)
The emitted smoke concentrations are shown in Figure 18 and Figure 19 as a function of engine speed at 100% load and plotted against the engine load at 2500 rpm, respectively. A very significant decrease in PM was observed when fossil diesel was replaced by the tested blends. At full load, the average reduction in smoke was 23% for the 76.9% D + 23.1% BD blend, and it was 47% for 71.4% D + 21.5% BD + 7.1% GVL compared to 100% D. The reducing effect was more pronounced at high engine loads and slower rotations, but it was significant at all conditions. Also, the trend remained the same, including the effect of GVL to provide an additional reduction of smoke emissions.
The PM concentration in the exhaust decreased with increasing engine speed for the tested three fuels (Figure 18). Similar observation was reported in several other papers in the literature and attributed to an increase in turbulence effects which enhance the extent of complete combustion [19] . At constant speed, the increased engine load was found to result in higher PM emission (Figure 19) which can be understood by the effect of increased fuel amount, decreased air-to-fuel ratio and hence a less complete combustion (see, e.g. [31] and the review by Xue et al. [19] ).
Our results support the conclusion of most of the literature studies that biodiesel and other oxygenates reduce the smoke emission of diesel engines by providing extra oxygen for a more complete combustion and crucially
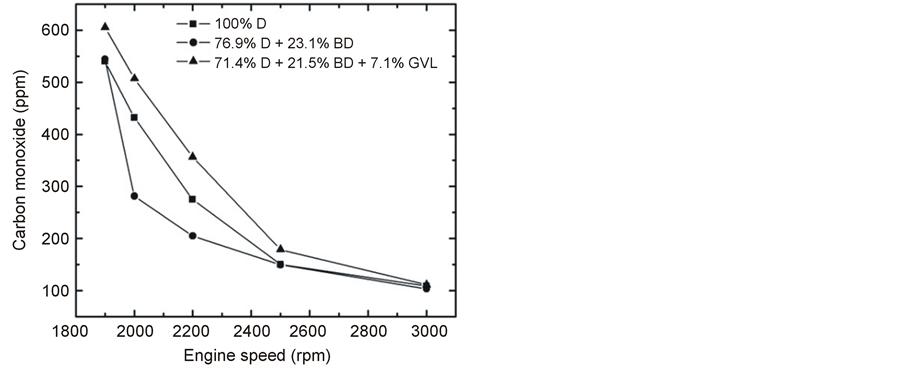
Figure 13. Emitted CO at full load as a function of engine speed.
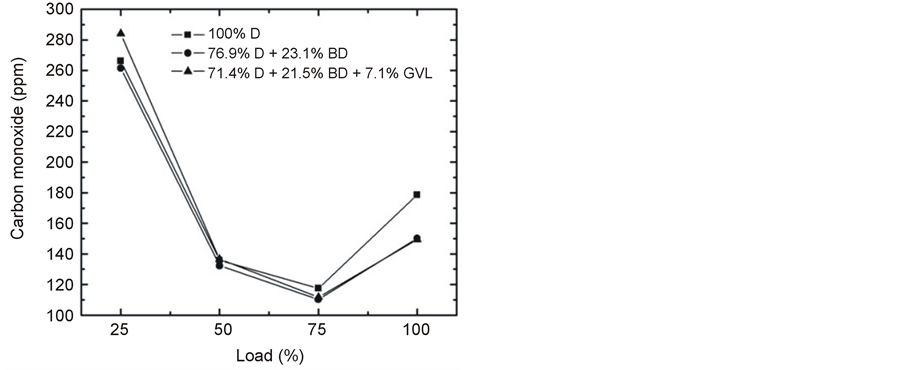
Figure 14. Variation of CO emission at 2500 rpm engine speed with increasing load.
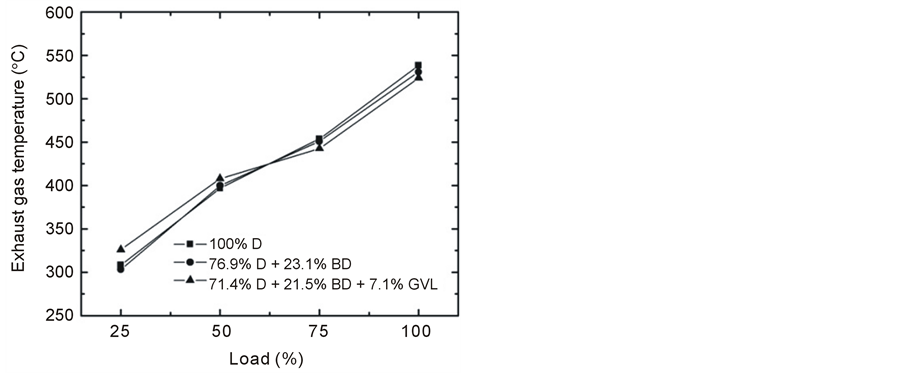
Figure 15. Variation of EGT at 2500 rpm engine speed with increasing load.
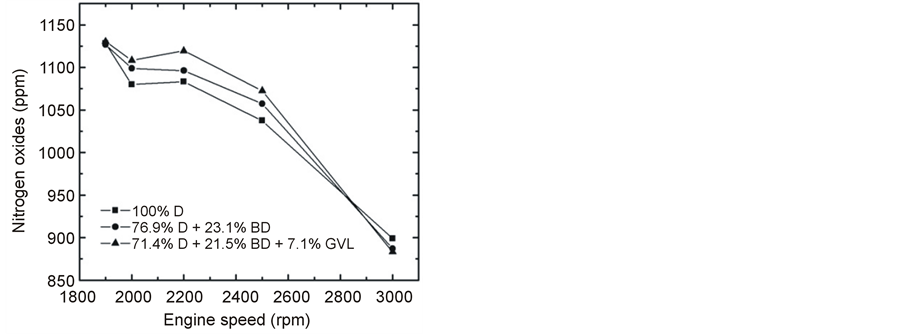
Figure 16. Emitted NOx at full load as a function of engine speed.
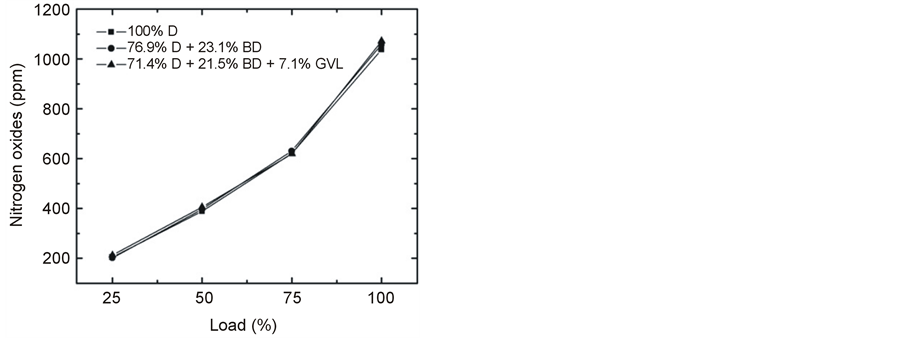
Figure 17. Variation of NOx emission at 2500 rpm engine speed with increasing load.
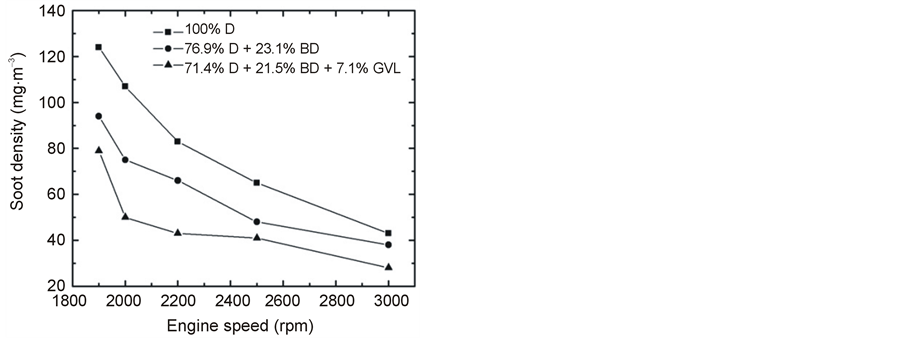
Figure 18. Emitted smoke concentration at full load as a function of engine speed.
in the regions of the combustion chamber with fuel-rich diffusion flame [19] [32] -[35] . In several works, e.g. in [36] and as presented in the thorough literature overview by Boot and co-workers [37] , a strong reduction of smoke with the increase of oxygen mass fraction of diesel blends was reported. We have experienced similarly
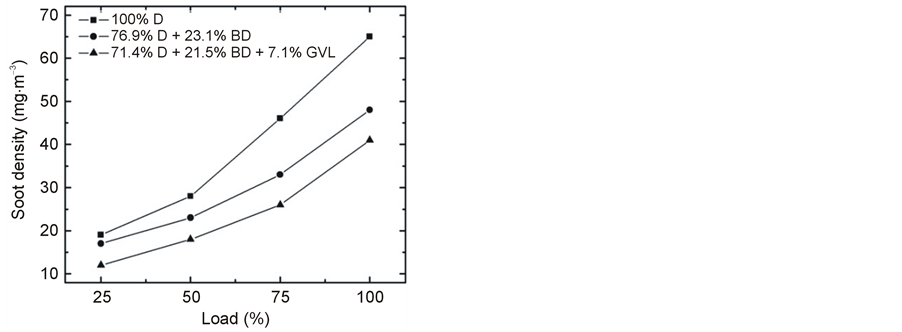
Figure 19. Variation of smoke emission at 2500 rpm engine speed with increasing load.
strong decrease by using GVL as a blending agent. GVL has high oxygen content (Table 1) and, although it was used just in 7%, it had increased the oxygen mass fraction in the three-component diesel blend substantially giving rise to a drop in the PM concentrations compared to both the D and D + BD fuel samples. Beside the oxygen mass fraction, the molecular structure of the oxygenate plays also a role in the sooting behavior [32] [37] . Boot and co-workers observed an extraordinary large smoke reduction by blending cyclohexanone to fossil diesel [37] . Cyclohexanone, similarly to GVL, is a cyclic oxygenate, it also has low cetane number (low reactivity) and relatively low heating value. The strong reduction of particulate emissions by cyclic oxygenates can be due to their enhanced trapping efficiency in converting fuel carbon into non-sooting species hindering the formation of the first ring structures of soot formation.
4. Conclusions
1) The best engine performance, concerning power and fuel consumption was observed with 100% fossil diesel (D), but it was practically the same with the 76.9% D + 23.1% biodiesel (BD) blend and was inferior only slightly when the 71.4% D + 21.5% BD + 7.1% γ-valerolactone (GVL) blend was used in the experiments.
2) The THC and CO emissions decreased substantially in the order of the fuels D > D + BD > D + BD + GVL. Favorably, and in contrast with many literature reports, we did not observe noticeable enhancement of NOx emissions by using the oxygenated blending components BD and GVL.
3) The smoke concentration of the exhaust was diminished significantly with the D + BD fuel compared to neat diesel, and it was even further reduced, on average by 47%, using the GVL-containing blend. We deem this latter result well worth for further investigations in view of the known harmful health effect of diesel soot and its very strong contribution to global warming that has been recognized very recently.
Acknowledgements
This work has been supported by the Hungarian Research Fund OTKA (contract OMFB-00992/2009) as well as the Hungarian NFÜ project KTI_AIK_12 (Grant No. KTIA_AIK_12-1-2012-0014 58E67B1D). This work is connected also to the scientific program of “Development of Quality-Oriented and Harmonized R + D + I strategy and functional model at BME" (ID: TÁMOP-4.2.1/B-09/1/KMR-2010-0002) project. The authors appreciate the technical assistance in the experiments by Drs I. Szilágyi and G.L. Zügner as well as the MSc. students Messrs Á. Baksza, Á. Illés, D. Kiss, A. Pap and D. Szép.
References
- Brody, H., Grayson, M., Scully, T. and Dadley-Moore, D. (2011) Biofuels. Nature, 474, S1-S25. http://dx.doi.org/10.1038/474S1a
- ( 2013) Virtual Special Issue on Biomass, Biodiesel and Bio-Ethanol. Fuel, Elsevier. www.journals.elsevier.com/fuel/virtual-special-issues/
- Sims R., Mabee, W., Saddler, J. and Taylor, M. (2010) An Overview of Second Generation Biofuel Technologies. Bioresource Technology, 101, 1570-1580. http://dx.doi.org/10.1016/j.biortech.2009.11.046
- Dhillon R. and von Wuehlisch, G. (2013) Mitigation of Global Warming through Renewable Biomass. Biomass & Bioenergy, 48, 75-89. http://dx.doi.org/10.1016/j.biombioe.2012.11.005
- Horváth I.T., Mehdi, H., Fábos, V., Boda, L. and Mika, L. (2008) Gamma-Valerolactone —A Sustainable Liquid for Energy and Carbon-Based Chemicals. Green Chemistry, 10, 238-242. http://dx.doi.org/10.1039/b712863k
- Mehdi H., Fábos, V., Tuba, R., Bodor, A., Mika, L. and Horváth, I.T. (2008) Integration of Homogeneous and Heterogeneous Catalytic Processes for a Multi-Step Conversion of Biomass: From Sucrose to Levulinic Acid, GammaValerolactone, 1,4-pentanediol, 2-methyltetrahydrofuran, and Alkanes. Topics in Catalysis, 48, 49-54. http://dx.doi.org/10.1007/s11244-008-9047-6
- Wright W. and Palkovits, R. (2012) Development of Heterogeneous Catalysts for the Conversion of Levulinic Acid to gamma-Valerolactone. Chemsuschem, 5, 1657-1667. http://dx.doi.org/10.1002/cssc.201200111
- Alonso D., Wettstein, S. and Dumesic, J. (2013) Gamma-Valerolactone, a Sustainable Platform Molecule Derived from Lignocellulosic Biomass. Green Chemistry, 15, 584-595. http://dx.doi.org/10.1039/c3gc37065h
- Galletti A., Antonetti, C., Ribechini, E., Colombini, M., Di Nasso, N. and Bonari, E. (2013) From Giant Reed to Levulinic Acid and Gamma-Valerolactone: A High Yield Catalytic Route to Valeric Biofuels. Applied Energy, 102, 157- 162. http://dx.doi.org/10.1016/j.apenergy.2012.05.061
- Alonso D., Gallo, J., Mellmer, M., Wettstein, S. and Dumesic, J. (2013) Direct Conversion of Cellulose to Levulinic acid and gamma-Valerolactone Using Solid Acid Catalysts. Catalysis Science & Technology, 3, 927-931. http://dx.doi.org/10.1039/c2cy20689g
- Gaffney J. and Marley, N. (2009) The Impacts of Combustion Emissions on Air Quality and Climate—From Coal to Biofuels and Beyond. Atmospheric Environment, 43, 23-36. http://dx.doi.org/10.1016/j.atmosenv.2008.09.016
- Bond T.C., Doherty, S.J., Fahey, D.W., Forster, P.M., Berntsen, T., DeAngelo, B.J., Flanner, M.G., Ghan, S., Kärcher, B., Koch, D., Kinne, S., Kondo, Y., Quinn, P.K., Sarofim, M.C., Schultz, M.G., Schulz, M., Venkataraman, V., Zhang, H., Zhang, S., Bellouin, N., Guttikunda, S.K., Hopke, P.K., Jacobson, M.Z., Kaiser, J.W., Klimont, Z., Lohmann, U., Schwar, J.P., Shindell, D., Storelvmo, T., Warren, S.G. and Zender, C.S. (2013) Bounding the Role of Black Carbon in the Climate System: A Scientific Assessment. Journal of Geophysical Research-Atmospheres, 118, 5380-5552. http://dx.doi.org/10.1002/jgrd.50171
- Lujaji F., Bereczky, Á. and Mbarawa, M. (2010) Performance Evaluation of Fuel Blends Containing Croton Oil, Butanol, and Diesel in a Compression Ignition Engine. Energy & Fuels, 24, 4490-4496. http://dx.doi.org/10.1021/ef100456a
- Lujaji F., Kristóf, L., Bereczky, Á. and Mbarawa, M. (2011) Experimental Investigation of Fuel Properties, Engine Performance, Combustion and Emissions of Blends Containing Croton Oil, Butanol, and Diesel on a CI Engine. Fuel, 90, 505-510. http://dx.doi.org/10.1016/j.fuel.2010.10.004
- Kivevele T., Kristóf, L., Bereczky, Á. and Mbarawa, M. (2011) Engine Performance, Exhaust Emissions and Combustion Characteristics of a CI Engine Fuelled with Croton Megalocarpus Methyl Ester with Antioxidant. Fuel, 90, 2782-2789. http://dx.doi.org/10.1016/j.fuel.2011.03.048
- Barabás I. and Todoru, I.A. (2011) Biodiesel Quality, Standards and Properties. In: Montero, G. and Stoytcheva, M., Eds., Biodiesel-Quality, Emissions and Bye-Products, InTech, 7-39.
- Luisa M., Pilcher, G., Yang, M., Brown, J. and Conn, A. (1990) Enthalpies of Combustion of gamma-Butyrolactone, gamma-Valerolactone, and Delta-Valerolactone. Journal of Chemical Thermodynamics, 22, 885-891. http://dx.doi.org/10.1016/0021-9614(90)90176-Q
- Vasiliu M., Guynn, K. and Dixon, D. (2011) Prediction of the Thermodynamic Properties of Key Products and Intermediates from Biomass. Journal of Physical Chemistry C, 115, 15686-15702. http://dx.doi.org/10.1021/jp204243m
- Xue J., Grift T. and Hansen A. (2011) Effect of Biodiesel on Engine Performances and Emissions. Renewable & Sustainable Energy Reviews, 15, 1098-1116. http://dx.doi.org/10.1016/j.rser.2010.11.016
- Basha S., Gopal K. and Jebaraj S. (2009) A Review on Biodiesel Production, Combustion, Emissions and Performance. Renewable & Sustainable Energy Reviews, 13, 1628-1634. http://dx.doi.org/10.1016/j.rser.2008.09.031
- Buyukkaya, E. (2010) Effects of Biodiesel on a DI Diesel Engine Performance, Emission and Combustion Characteristics. Fuel, 89, 3099-3105. http://dx.doi.org/10.1016/j.fuel.2010.05.034
- Hazar, H. (2009) Effects of Biodiesel on a Low Heat Loss Diesel Engine. Renewable Energy, 34, 1533-1537. http://dx.doi.org/10.1016/j.renene.2008.11.008
- Pal, A. Verma, A., Kachhwaha, S. and Maji, S. (2010) Biodiesel Production through Hydrodynamic Cavitation and Performance Testing. Renewable Energy, 35, 619-624. http://dx.doi.org/10.1016/j.renene.2009.08.027
- Heywood, J.B. (1988) Internal Combustion Engine Fundamentals. McGraw-Hill, New York, St. Louis, etc.
- Canakci, M. Ozsezen, A. and Turkcan, A. (2009) Combustion Analysis of Preheated Crude Sunflower Oil in an IDI Diesel Engine. Biomass & Bioenergy, 33, 760-767. http://dx.doi.org/10.1016/j.biombioe.2008.11.003
- Sahoo P. and Das, L. (2009) Combustion Analysis of Jatropha, Karanja and Polanga Based Biodiesel as Fuel in a Diesel Engine. Fuel, 88, 994-999. http://dx.doi.org/10.1016/j.fuel.2008.11.012
- Tsolakis, A. Megaritis, A., Wyszynski, M. and Theinnoi, K. (2007) Engine Performance and Emissions of a Diesel Engine Operating on Diesel-RME (Rapeseed Methyl Ester) Blends with EGR (Exhaust Gas Recirculation). Energy, 32, 2072-2080. http://dx.doi.org/10.1016/j.energy.2007.05.016
- Chen, H. Wang, J., Shuai, S. and Chen, W. (2008) Study of Oxygenated Biomass Fuel Blends on a Diesel Engine. Fuel, 87, 3462-3468. http://dx.doi.org/10.1016/j.fuel.2008.04.034
- Varatharajanand K. and Cheralathan, M. (2012) Influence of Fuel Properties and Composition on NOx Emissions from Biodiesel Powered Diesel Engines: A Review. Renewable & Sustainable Energy Reviews, 16, 3702-3710. http://dx.doi.org/10.1016/j.rser.2012.03.056
- Warnatz, J. Maas, U. and Dibble, R.W. (2001) Combustion: Physical and Chemical Fundamentals, Modelling and Simulation, Experiments, Pollutant Formation. Springer-Verlag, Heidelberg, New-York. http://dx.doi.org/10.1007/978-3-662-04508-4
- Raheman H. and Ghadge, S. (2007) Performance of Compression Ignition Engine with Mahua (Madhuca indica) Biodiesel. Fuel, 86, 2568-2573. http://dx.doi.org/10.1016/j.fuel.2007.02.019
- Westbrook, C.K. (2013) Biofuel Combustion. Annual Reviews of Physical Chemistry, 64, 201-219. http://dx.doi.org/10.1146/annurev-physchem-040412-110009
- Lapuerta, M., Armas, O. and Rodríguez-Fernández, J. (2008) Effect of Biodiesel Fuels on Diesel Engine Emissions. Progress in Energy and Combustion Science, 34, 198-223. http://dx.doi.org/10.1016/j.pecs.2007.07.001
- Lemaire, R., Bejaoui, S. and Therssen, E. (2013) Study of Soot Formation during the Combustion of Diesel, Rapeseed Methyl Ester and Their Surrogates in Turbulent Spray Flames. Fuel, 107, 147-161. http://dx.doi.org/10.1016/j.fuel.2012.12.072
- Agarwal, D. Kumar, L. and Agarwal, A. (2008) Performance Evaluation of a Vegetable Oil Fuelled Compression Ignition Engine. Renewable Energy, 33, 1147-1156. http://dx.doi.org/10.1016/j.renene.2007.06.017
- Ren, Y. Huang, Z., Miao, H., Di, Y., Jiang, D., Zeng, K., Liu, B. and Wang, X. (2008) Combustion and Emissions of a DI Diesel Engine Fuelled with Diesel-Oxygenate Blends. Fuel, 87, 2691-2697. http://dx.doi.org/10.1016/j.fuel.2008.02.017
- Boot, M. Frijters, P., Luijten, C., Somers, B., Baert, R., Donkerbroek, A., Klein-Douwel, R., and Dam, N. (2009) Cyclic Oxygenates: A New Class of Second-Generation Biofuels for Diesel Engines. Energy & Fuels, 23, 1808-1817. http://dx.doi.org/10.1021/ef8003637
NOTES
*Corresponding authors.