Open Journal of Endocrine and Metabolic Diseases
Vol.4 No.5(2014), Article ID:46439,17 pages DOI:10.4236/ojemd.2014.45012
Effect of Maternal Diabetes on Preand Post-Natal Redox Status of F1 Rat Offspring
Maher A. Kamel, Madiha H. Helmy, Mervat Y. Hanafi, Shimaa A. Mahmoud, Hanan Abo Elfetooh
Department of Biochemistry, Medical Research Institute, University of Alexandria, Alexandria, Egypt
Email: maher.kamel@alexu.edu.eg
Copyright © 2014 by authors and Scientific Research Publishing Inc.
This work is licensed under the Creative Commons Attribution International License (CC BY).
http://creativecommons.org/licenses/by/4.0/


Received 12 April 2014; revised 2 May 2014; accepted 12 May 2014
ABSTRACT
Background: The oxidative stress and disturbed redox signaling during gestation my play an important role in the fetal programming of adult diabetes. Objective: The study aimed to investigate the effects of maternal diabetes on preand post-natal pancreatic and peripheral tissues redox and oxidative status in order to clarify their role in the diabetogenic programming of F1 offspring. Methods: Two groups of female Wistar rats were used (diabetic and control); diabetes was neonatally induced by STZ injection to 5-day old rats. 10 pregnancies of each group were terminated at GD 17 to obtain placentas and fetal pancreas, liver, muscle and adipose tissues for prenatal measurements. The rest of pregnancies were completed to term and the offspring were weaned to control diet or high-caloric (HCD) diet and followed up for 30 weeks. Every 5 weeks 10 male rats were sacrificed and serum and tissues were obtained for assessment of fasting blood glucose, tissues content of 8-oxo-dG, TBARS, GSH, GSSG, antioxidant enzymes and caspase-3. Results: The results indicated that, prenatally redox status of the foetuses of diabetic mothers is shifted toward more oxidizing environment which results from elevated oxidative stress and impaired antioxidants as indicated by elevated fetal tissues content of 8-oxo-dG, TBARS and GSSG and decreased GSH and GSH/GSSG ratio. All of these induce the apoptotic pathway in fetal pancreas. Postnatally, impaired glucose tolerance in the offspring of diabetic mothers is detected at 15th week of age and no hyperglycemia was detected until age of 30 weeks in the offspring under CD while some of offspring under HCD at age 25 weeks and most of them at 30 weeks have developed hyperglycemia. The pancreas of the offspring of diabetic mothers suffers from oxidative stress from the 5th week of age as indicated by elevated levels of nuclear and mitochondrial 8-oxo-dG contents and TBARS. Also, GSH level showed depletion with age and the activity of glutathione reductase was lower in the β-cell and hepatic tissues of the offspring of diabetic mothers. The prenatal shift of redox status persists postnatal and exaggerates with age which may explain the significant induction of the apoptotic pathway in the pancreatic β-cell. Conclusion: Maternal diabetes can crucially affect the redox status in fetal tissues prenatally and these effects can persist postnatal which may play an important role in the programming of the metabolic state of the offspring. Postnatal diet play important role in accelerating development of metabolic derangements and aggravates oxidative stress in the tissues of F1 offspring.
Keywords:Fetal Origin of Disease, Diabetes, GSH, Redox, 8-Oxo-dG, Apoptosis, Oxidative Stress

1. Introduction
Diabetes during pregnancy is a recognised medical problem, as maternal metabolic disturbances have the detrimental effects on embryonic development. These effects may have direct embryopathic consequences; fetal death or malformation, or indirect long-lasting consequences; fetal programming [1] [2] . During last decade, it has become accepted that, maternal diabetes (gestational or pre-gestational) is a profound risk factor for development of diabetes in the offspring even in the absence of genetic predisposition [3] . However, the exact mechanism(s) of this programming is still unclear, maternal hyperglycemia-induced oxidative stress is one of the suggested mechanism [3] -[5] . Oxidative stress occurs when the rate of reactive oxygen species (ROS) generation exceeds the capacity of the cell’s antioxidant defense mechanisms; enzymatic (Superoxide dismutase; SOD, Glutathione peroxidase; GPx and Catalase) and non-enzymatic (Glutathione; GSH, peroxiredoxin, thioredoxin, Vitamin C and Vitamin E). Cellular macromolecules especially lipids and DNA are the primary targets of ROS. 8-oxo-deoxyguanosine (8-oxo-dG) is considered as an index of DNA oxidative damage [6] while malondialdehyde (MDA) assayed as thiobarbituric acid reactive substance (TBARS) is widely used as marker of lipid peroxidation. Many previous reports documented the elevated oxidative stress during diabetic gestation [7] -[9] .
Glutathione (GSH) is the dominant non-protein thiol in the mammalian cell and is essential for maintaining the intracellular redox balance [10] . It plays a pivotal role in the regulation of many transcription factors involved in cell differentiation, proliferation and/or apoptosis [11] . The intracellular redox shifting due to excessive or inappropriately timed GSH oxidation affect signal cascades and result in altered development. High concentrations of thiols are associated with a reducing environment and increased proliferation, while apoptosis is initiated by an oxidizing environment; thus, the redox status of the cell might determine whether it proliferates, differentiates or dies [12] -[14] . Several enzymes are involved in the metabolism of GSH mainly; GSH peroxidase (GPx), glutathione disulphide (GSSG) reductase and GSH-S-transferase. These enzymes play important role in regulating intracellular GSH level [15] .
During embryonic development a delicate balance must exist between ROS production and the antioxidant systems to permit the release of physiological low level of ROS which play a pivotal role in cellular regulation and signaling. ROS produce their effects through epigenetic regulation of the transcription. Any disturbances of this balance during this critical period are expected to result in catastrophic consequences on fetal development [16] [17] .
This study aimed to study pre-and post-natal pancreatic and peripheral tissues redox and oxidative status to clarify their role in the diabetogenic programming of F1 offspring of maternal diabetes. The impact of postnatal diet on the redox and oxidative parameters was also evaluated.
2. Animals and Method
2.1. Chemicals
Streptozotocin, DTNB, NADPH, glutathione reductase, CDNB, TBA, collagenase, Hanks’ balanced salt solution (HBSS), penicillin, and streptomycin, Ficoll, RPMI 1640 medium and dithizone was obtained from SigmaAldrich Chemie GmbH (Germany). DNase I, nuclease P1 and alkaline phosphatase were obtained from BioBasic (Canada).
2.2. Animals
The animal protocol was approved by the Institutional Animal Care and Use Committee at the Medical Research Institute—Alexandria University. Two groups of female Wistar rats were used (diabetic and control); Diabetes was induced in female rat by neonatal injection of streptozotocin (100 mg/Kg) at post-natal day 5 (PND5) [18] . The chronic hyperglycemia was confirmed in those females after 12 - 14 weeks, as fasting blood glucose levels measured by Glucometer (One Touch, Johnson and Johnson Co.) were more than 200 mg/dl. Pregnancy was induced by mating control or diabetic females with normal healthy males overnight. Pregnancy was confirmed by the presence of vaginal mucus plug next morning. 10 pregnant females of each group were sacrificed at GD 17 and fetuses with their membranes and placentas were quickly dissected out of the uterine horns. The number of resorbed (dead) fetuses for individual pregnancies was noted and exclude from the study. Each fetuses and its membrane were separated by gentle dissection and rinsed carefully in Phosphate Buffered Saline (PBS). Overall growth and differentiation of the embryos were quantified by direct measurement of crown-rump length (CRL). The weights of fetuses and placentas were recorded. Each fetus was dissected to obtain the fetal liver tissues, quadriceps muscles, white adipose tissues and pancreas. From each group of fetuses 10 samples of the fetal tissues and isolated pancreatic islets were obtained and divided into different aliquots and snap-frozen in liquid nitrogen. The rest of pregnancies were completed to term. After delivery the offspring were weaned to control diet (CD) or high-caloric (HCD) diet (Table 1) and followed up for 30 weeks. So the offspring groups were as following: F1 offspring of control mothers under control diet (CF1-CD), F1 offspring of control mothers under HCD (CF1-HCD), F1 offspring of diabetic mothers under control diet (DF1-CD) and F1 offspring of diabetic mothers under HCD (DF1-HCD).
Every 5 weeks 10 male rats were sacrificed and serum and tissues (pancreas, liver, muscle and adipose tissues) were obtained for assessment of fasting blood glucose, tissues content of 8-oxo-dG, TBARS, GSH, GSSG, antioxidant enzymes and caspase-3
2.3. Methods
2.3.1. Pancreatic β-Cell Isolation
For pancreatic islet isolation, each fetus was decapitated and the pancreas was removed aseptically and placed in a sterile ice-cold Hanks’ balanced salt solution (HBSS). After careful trimming of the pancreas from remnants of gut and spleen, it was chopped into fine pieces and washed twice with HBSS supplemented with penicillin (100 U/ml) and streptomycin (0.1 mg/ml) and 5% hepes and digested in 4 ml collagenase solution (2.5 mg/ml in 10 mM hepes, 7.5 CaCl2, 5% (v/v) glycerol, pH 7.5) for 40 minutes at 37˚C. The digestion was subsequently terminated by adding 10 ml of ice-cold HBSS. Digested tissue was filtered through stainless-steel tea strainer (0.5 mm mesh pore size) after washing with ice-cold HBSS. The sample was centrifuged for 2 min at 4˚C at 300 × g. The supernatant was discarded and pellet was re-suspended in Ficoll 25% with 10 mM Hepes, this was layered over by various concentration of Ficoll 23%, 20.5% and 11% to make a density gradient for purification of rat islets. After centrifugation at 300×g for 15 minutes, the islets were collected from interface between density 11% and 20.5%. The islets were separated by centrifugation and then washed 3 times with HBSS to remove any Ficoll. Then cells were suspended in RPMI 1640 medium. The purity of the islets was examined by staining with Dithoizon [19] .

Table 1. Composition of the different diets used in the study.
2.3.2. Nuclear DNA Isolation
The nuclear DNA was isolated from fetal pancreatic islets, liver, muscle and adipose tissues and placentas using GenJet gemonic DNA isolation kit (Fermentas, EU) according to the manufacturer instructions.
2.3.3. Mitochondrial DNA Isolation
The mitochondrial DNA was isolated from the pancreatic islets using mitochondrial DNA isolation kit (Bio-Vision, Canada) according to the manufacturer instructions
2.3.4. Assay of 8-Oxo-Deoxy Guanine Content in Nuclear and Mitochondrial DNA
Isolated DNA was washed twice with 70% ethanol, dried, and dissolved in 200 µl of 10 mM Tris/HCl, 0.1 mM EDTA and 100 mM NaCl, (pH 7.0) for its enzymatic digestion. 100 units of DNase I were added per 200 µg DNA at 37˚C for 1 h. Then 5 units of nuclease P1 and 30 µl of 10 mM ZnSO4 were added, and the mixture was incubated for 1 h. After re-adjusting the pH with 100 µl of 0.4 M Tris/HCl (pH 7.8) followed by the addition of 3 units alkaline phosphatase, the samples were incubated for 30 min. Enzymes were precipitated with acetone (5 vol), removed by centrifugation, and the supernatant evaporated to dryness. The DNA hydrolysates were assayed for quantification of 8-oxo-dG using HT 8-oxo-dG ELISA Kit II (Trevigen, USA).
2.3.5. Assay of Reduced Glutathione and Glutathione Disulphide
Glutathione (GSH) and glutathione disulphide (GSSG) were assayed using the method of Griffith [20] which depends on the oxidation of GSH by 5,5’-dithiobis-(2-nitrobenzoic acid) (DTNB) to yield GSSG and 5-thio-2- nitrobenzoic acid (TNB). Oxidised GSSG is reduced enzymaticly by the action of glutathione reductase and NADPH to regenerate GSH. The rate of TNB formation is monitored at 412 nm and is proportional to the sum of GSH and GSSG present in the sample.
2.3.6. Assay of Antioxidant and GSH Metabolizing Enzymes
The activity of glutathione reductase was assayed by method of Smith et al. [21] which based on the reduction of 5, 5’-dithiobis-(2-nitrobenzoic acid) (DTNB) by GSH produced by glutathione reductase (GR) which results in release of 5-thio-2-nitrobenzoic acid (TNB) that monitored spectrophotometrically at 412 nm. One unit of the enzyme activity is defined as the amount of the enzyme that catalyzes the formation of 1 µmol of TNB per minute.
The activity of glutathione-S-transferase (GST) was determined by the method of Habig et al. [22] . The GSTcatalyzed conjugation of GSH with 1-chloro-2,4-dinitrobenzen (CDNB) is measured spectrophotometrically at 340 nm. One unite of the enzyme activity is defined as the amount of enzyme that catalyze the formation of 1 µmol S-conjugate per minute under the assay conditions.
The total glutathione peroxidase (GPx) activities were determined by the method of Flohe and Gunzler [23] . This method is based on monitoring the generation of GSH from GSSG by the action of glutathione reductase and NADPH. Total GPx activity was measured using cumene hydroperoxide as substrate.
Superoxide dismutase (SOD) activity was determined by the pyrogallol autoxidation method of Marklund and Marklund [24] . This depends on the spontaneous autoxidation of pyrogallol at alkaline pH, resulting in the production of superoxide anion radicals (O2)−. These radicals enhance the autoxidation of pyrogallol, which manifests itself by an increase in absorbance at 420 nm. The presence of SOD in the reaction leads to the removal of superoxide anion radicals and the inhibition of pyrogallol autoxidation
2.3.7. Assay of Lipid Peroxidation
The end products of lipid peroxidation were determined as thiobarbituric acid reactive substance (TBARS) assay [25] . In this assay, the malondialdehyde is heated with thiobarbituric acid (TBA) at low pH to produce a pink chromogen with a maximum absorbance at 532 nm.
2.3.8. Assay of Caspase-3 Activity
Activity of the apoptosis marker caspase-3 was assayed using a colorimetric kit (Promega, USA). This kit depends on using the substrate (Ac-DEVD) labelled with the chromophore p-nitroaniline (pNA), which released from the substrate when cleaved by caspase-3. Free pNA produces a yellow colour that is monitored at 405 nm. The assay was done according to the manufacturer instructions and the activity of caspase-3 in the different fetal tissues was expressed as (pmolpNA/hour/µg protein).
2.3.9. Statistical Analysis
All data are presented as mean ± SEM. A one-way analysis of variance (ANOVA) was performed on each variable and the Bonferroni statistics employed to compare the mean values from the offspring of diabetic mothers and the offspring of control mothers (under control diet and HCD). t-test was used to compare the mean values of prenatal fetuses of diabetic pregnancies and those of control pregnancies. The Kolmogorov-Smirnov test was used to study the normal distribution of the studied parameters. Differences were considered significant at P < 0.05. All statistical analyses were performed using SPSS statistical software version 18 (SPSS, Chicago, IL).
3. Results
3.1. Pregnancy Outcome
Table 2 indicated that at GD17 while no gross anatomical malformations could be detected in the embryos of control pregnancies, five out of ten diabetic pregnancies (about 50%) had malformed embryos. The number of implantations per litter was smaller and fetal deaths represented by fetal resorption, were higher in diabetic pregnancies compared to control pregnancies.
Results indicated that, the maternal diabetes was associated with fetal growth retardation (as indicated by lower CRL and fetal weight) and increased placental weight (Table 2).
The results indicated that at term, diabetic pregnancies have significantly lower number of pups per litter (Table 3). The birth weight of pups showed no significant change from control pups.
3.2. Prenatal Results
Prenatally, fetuses of diabetic mothers showed significant higher level of pancreatic nuclear and mitochondrial DNA contents of 8-oxo-dG (Figure 1). Also fetal liver of diabetic gestation showed significantly increased nuclear DNA content of 8-oxo-dG (Figure 2). The fetal pancreas and liver of diabetic gestation showed significantly higher levels of TBARS compared to control fetuses (Figure 3). Also, the placentas of maternal diabetes showed higher levels of the oxidative markers; 8-oxo-dG and TBARS in comparison with control placentas (Figure 2, Figure 3).
Table 2. Morphologic outcome of the different pregnancies at gestational day 17.
*Significantly different compared to control value by t-test (p < 0.05)
Table 3. Pregnancy outcomes of different pregnancies.
Data presented as Mean ± SEM. *Significantly different compared to control value by student t-test (p < 0.05)
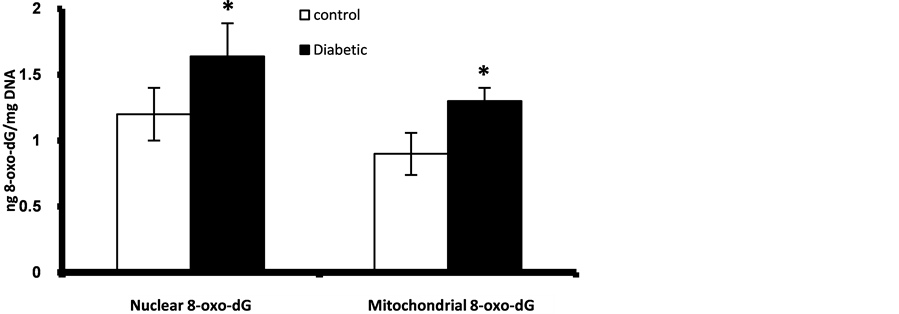
Figure 1. Fetal pancreatic β-cells nuclear and mitocondrial DNA content of 8-oxo-dG at GD 17. *Significant different compared to control group (p < 0.05).

Figure 2. Nuclear DNA content of 8-oxo-dG in placenta and fetal liver, muscle and adipose tissues at GD17. *Significant different compared to control group (p < 0.05).
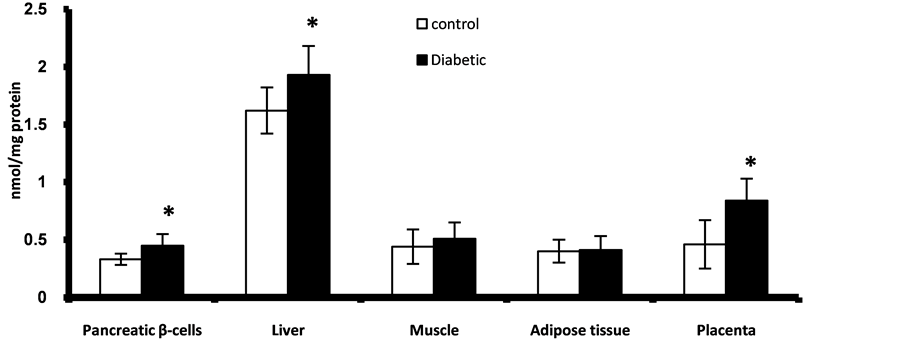
Figure 3. Placental and fetal pancreatic, liver, muscle and adipose tissues content of TBARS at GD17. *Significant different compared to control group (p < 0.05).
The redox status of the fetal organs showed great derangements during diabetic gestation especially in the fetal pancreas and liver. Fetuses of diabetic mothers have significantly lower pancreatic and hepatic content of GSH and GSH/GSSG ratio while GSSG was higher than fetuses of control mothers (Table 4). Fetal muscle and adipose tissues of diabetic gestation showed no significant changes in the level of reduced GSH while there was a significant decline in GSH/GSSG ratio and elevation of GSSG. The placentas associated with fetuses of diabetic mothers showed apparent depletion of GSH and increased GSSG coupled with decline in GSH/GSSG ratio (Table 4).
The results of GSH metabolizing enzymes and SOD indicated up regulation in the activity of GST in the fetal pancreas and GPx in fetal liver of diabetic gestation while no changes were detected in the fetal muscle and adipose tissues (Table 5). All the enzymes showed enhanced activities in the placentas associated with diabetic
Table 4. Glutathione redox parameters (GSH and GSSG; μmol/mg protein, and GSH/GSSG ratio) in different fetal tissues of control and diabetic pregnancies at GD 17.
Data presented as Mean ± SEM. *significantly different compared to control value by t-test (p < 0.05).
Table 5. Activities of GSH metabolizing enzymes (mU/mg protein) and SOD (U/mg protein) in different fetal tissues of control and diabetic pregnancies at GD17.
Data presented as Mean ± SEM. *Significantly different compared to control value by t-test (p < 0.05).
pregnancies with the exception of GR which showed lowered activities compared to the placentas of control pregnancies (Table 5).
The diabetic gestation resulted in increased activity of apoptotic marker; caspase-3 in the fetal pancreas (Figure 4). There is no significant changes were observed in the fetal liver and muscle while no detectable activities of caspase-3 were detected in the adipose tissues at GD17.
3.3. Postnatal Results
During the follow up period there was an age-dependent increase in the fasting blood glucose level in the offspring of diabetic mothers. The offspring under HCD showed the elevation earlier (15th week) than those under CD (20th week) (Figure 5). While no hyperglycemia was detected until age of 30 weeks in the offspring of diabetic mothers under CD, some of offspring under HCD at age 25 weeks and most of them at 30 weeks have developed hyperglycemia.
The results of 8-oxo-dG content in pancreatic nuclear and mitochondrial DNA showed age-dependent elevation in all offspring. However, offspring of diabetic mothers especially those under HCD showed significant higher values from 20th week of age for nuclear DNA while as early as 5th week of age for mitochondrial DNA as compared to control offspring under CD or HCD (Figure 6, Figure 7). At age 30 week the liver nuclear DNA exhibited significantly higher 8-oxo-dG content in the offspring of diabetic mothers even under CD compared to control offspring (Figure 8). At 30th week of age the other marker of oxidative stress; TBARS, showed significant elevation in the pancreas, liver and adipose tissues of the offspring of diabetic mothers especially those under HCD (Figure 9).

Figure 4. Caspase-3 activity in fetal pancreatic β-cells, liver and muscle at GD17. *Significant different compared to control group (p < 0.05).

Figure 5. Age-dependent change in fasting blood glucose level in F1 offspring under control or HCD diet. Each point represent mean of 10 results (# and + represent a significant difference of DF1-CD and DF1-HCD rats compared to CF1-CD rats respectively, p < 0.05).

Figure 6. Age-dependent change in pancreatic β-cells nuclear content of 8-oxo-dG in F1 offspring under control and HCD-diet. Each point represent mean of 10 results (# and + represent a significant difference of DF1-CD and DF1-HCD rats compared to CF1-CD, respectively, p < 0.05).

Figure 7. Pancreatic β-cells mitochondrial content of 8-oxo-dG in F1 offspring under control and HCD-diet. Each point represent mean of 10 results (# and + represent a significant difference of DF1-CD and DF1-HCD rats compared to CF1- CD rats respectively, p < 0.05).

Figure 8. Age-dependent change in liver, muscle and adipose tissues nuclear contents of 8-oxo-dG in F1 offspring at age 30 week. Each point represent mean of 10 results (*, # and + represent a significant difference of CF1-HCD, DF1-CD and DF1-HCD rats compared to CF1-CD rats respectively, p < 0.05).

Figure 9. Pancreatic, liver, muscle and adipose tissues contents of TBARS in F1 offspring at age 30 week. Each point represent mean of 10 results (# and + represent a significant difference of DF1-CD and DF1-HCD rats compared to CF1- CD rats respectively, p < 0.05).
The pancreas of the offspring of maternal diabetes showed significant depletion of GSH and GSH/GSSG ratio from the 10th week of age and thereafter and the type of diets showed no significant effect (Figure 10, Figure 11). While the liver showed significantly lower level of GSH in the offspring of diabetic mothers under HCD, the GSH/GSSG ratio was significantly lower in all offspring of diabetic mothers from 5th week of age and even in the control offspring under HCD (Figure 12, Figure 13). Muscle and adipose tissues showed no significant changes in the redox parameters during the follow up period (Figures 14-17).
At the age 30 week postnatal, the hepatic and adipose tissues activities of GSH metabolizing enzymes showed significantly enhanced activities in the offspring of control mothers maintained under HCD compared to those offspring under CD (Table 6). In contrast the offspring of diabetic mothers even under CD showed no change or even inhibited activities of GSH metabolizing enzymes and SOD especially in pancreas and hepatic tissues and feeding HCD further decreased the activities of these enzymes (Table 6).
The apoptotic marker (caspase-3) showed enhanced activity in the pancreas of the offspring of maternal diabetes only under HCD from 15th week of age compared to control offspring (Figure 18).
4. Discussion
Maternal diabetes is a recognized medical problem for both mother and her offspring. Diabetic gestation was expected to induce an increasingly stressful condition through a combination of concomitant pregnancy and diabetes. Maternal diabetes has the potential to adversely affect the development of multiple organ systems resulting in diabetogenic tendency in the offspring. There are many mechanisms have been proposed to clarify this diabetogenic effect. However, oxidative stress mechanism gains support every day. This mechanism suggested that, maternal hyperglycemia during gestation through induction of oxidative stress and redox imbalance affects, and reprograms fetal tissues for the long-lasting development of diabetes [26] -[28] .
Under normal conditions free radical and low oxidative stress play an important role during normal embryonic development. The balance between oxidizing and reducing molecules is required for normal organogenesis and fetal growth and development [29] . These effects are mediated through epigenetic mechanisms in which the gene expression is influenced by the redox signaling and the level of ROS [30] . The physiologic oxidative stress might also select between cells needed for development and those that are redundant. However, any disturbances in redox or oxidizing state during this critical period of development have detrimental consequences during pre and post-natal life.
This study explores the redox and oxidative status and apoptotic pathway in the pancreatic β-cell, liver, muscles and adipose tissues during the prenatal and postnatal life of the first generation of experimentally diabetic mothers.
In line with the present study previous reports documented elevated oxidative stress markers and disturbed redox environment during diabetic gestation in both maternal and fetal side [2] [31] . In this study, prenatal data indicated that, the fetuses of diabetes gestation showed intrauterine growth retardation. It was documented that

Figure 10. Age-dependent change in pancreatic GSH content in F1 offspring under control and HCD-diet. Each point represent mean of 10 results (# and + represent a significant difference of DF1-CD and DF1-HCD rats compared to CF1-CD rats respectively, p < 0.05).

Figure 11. Age-dependent change in pancreatic GSH/GSSG ratio in F1 offspring under control and HCD-diet. Each point represent mean of 10 results (# and + represent a significant difference of DF1-CD and DF1-HCD rats compared to CF1-CD rats respectively, p < 0.05).

Figure 12. Age-dependent change in liver GSH content in F1 offspring under control and HCD-diet. Each point represent mean of 10 results (+ represent a significant difference of DF1-HCD rats compared to CF1-CD rats, p < 0.05).

Figure 13. Age-dependent change in liver GSH/GSSG ratio in F1 offspring under control and HCD-diet. Each point represents mean of 10 results (*, # and + represent a significant difference of CF1-HCD, DF1-CD and DF1-HCD rats compared to CF1-CD rats respective, respectively, p < 0.05).

Figure 14. Age-dependent change in muscle GSH content in F1 offspring under control and HCD-diet. Each point represent mean of 10 results.

Figure 15. Age-dependent change in muscle GSH/GSSG ratio in F1 offspring under control and HCD-diet. Each point represent mean of 10 results.

Figure 16. Age-dependent change in adipose tissue GSH content in F1 offspring under control and HCD-diet. Each point represent mean of 10 results.

Figure 17. Age-dependent change in adipose tissue GSH/GSSG ratio in F1 offspring under control and HCD-diet. Each point represent mean of 10 results.

Figure 18. Age-dependent change in pancreatic caspase-3 activities in F1 offspring under control and HCD-diet. Each point represent mean of 10 results (+ represent a significant difference of DF1-HCD rats compared to CF1-CD rats, p < 0.05).
Table 6. Activities of glutathione metabolizing enzymes (mU/mg protein) and SOD (U/mg protein) in different tissues of F1 offspring of different pregnancies at 30 week age.
Data presented as Mean ± SEM. *Significantly different compared to CF1-CD value by ANOVA (p < 0.05). Group abbreviation: F1 offspring of control mothers under control diet (CF1-CD), F1 offspring of control mothers under HCD (CF1-HCD), F1 offspring of diabetic mothers under control diet (DF1-CD) and F1 offspring of diabetic mothers under HCD (DF1-HCD).
intrauterine growth retardation was associated with oxidative stress [32] . It is clear that fetal organs of diabetic gestation especially pancreatic β-cells suffer from exaggerated oxidative stress manifested as higher level of nuclear and mitochondrial DNA content of 8-oxo-dG and TBARS as index of oxidative DNA damage and lipid peroxidation, respectively. Gestational hyperglycemia is proposed to trigger the formation of ROS production. The developing fetal mitochondria being not fully mature and could produce great amount of free oxygen radicals in response to an increased load of oxidative substrates [33] . Hyperglycemia was reported to alter the metabolism of rat embryonic tissue by inhibiting oxygen uptake causing embryonic hypoxia, stimulating glucose utilization and inhibiting mitochondrial respiration which facilitates electron leakage from complex I and III of the electron transport chain, that leads to univalent reduction of oxygen and produces an increased amount of superoxide anion [17] [33] [34] . Also, glucose autoxidation was proposed as another mechanism for ROS production in embryos exposed to a diabetic environment [31] . Placentas through their role in regulating fetal nutrient and oxygen supply play important role in exaggerating oxidative stress. Diabetes-induced abnormalities in placental blood flow and oxidative and nitrative stress is documented [35] . Also, the observed decline in the GSH antioxidant system in those placentas associated with diabetic gestation further amplifies the oxidative stress. Oxidative damage to DNA causes modification of the purine and pyrimidine bases, single and doublestrand breaks, and cross-links to other molecules, however, formation of 8-oxo-guanine is the most abundant modification [6] . The overproduction of ROS induced prenatally by hyperglycemia initiates a series of oxidative reaction that leads to oxidative damage to cellular and mitochondrial macromolecules including proteins, lipids and nucleic acids.
The results indicated that pancreatic and liver tissues are the most affected organs by oxidative stress pre and post-natal these may be related to their functional dependence on the oxidative phosphorylation by mitochondria. Being the major intracellular source of ROS, mitochondria are predominant target of ROS attack because mitochondrial DNA lacks histones and have few DNA repair mechanisms [36] . Moreover, pancreatic β-cells are especially vulnerable to attack by ROS because of low antioxidant content [27] . These explain why fetal pancreatic β-cells of diabetic gestation have greatest elevation of oxidative markers (nuclear and mitochondrial DNA content of 8-oxo-dG and TBARS). This detrimental effect of oxidative stress could permanently alter pancreatic cell function leading to diabetes postnatally.
The oxidative stress prenatally is associated with disturbed redox status of the essential metabolic organs (pancreas and liver) as indicated by depleted GSH, increased GSSG contents and decreased GSH/GSSG ratio. This shift in redox state of the fetal pancreas toward more oxidizing environment together with the elevated oxidative stress may impair the expression of genes involved in the β-cell functions and development and induce cell death as indicated by enhanced caspase-3 activities in the fetal β-cells of diabetic gestation, these notions were supported with other reports [9] [37] [38] . Also, fetal liver showed high levels of oxidative stress markers and lowered GSH and GSH/GSSG ratio which persist postnatally that could render the liver susceptible for induction of insulin resistance and subsequent development of non-alcoholic fatty liver diseases. These changes of GSH in fetal liver not paralleled with activation of the activity of glutathione reductase; the enzyme responsible for the recycling of GSH from GSSG produced during removal of H2O2 and/or lipid hydroperoxides by glutathione peroxidase enzymes which showed enhanced activities and results in further exhaustion of GSH.
Pancreatic GST activity of fetuses of diabetic gestation was higher prenatally while postnatally its high activity persists until 25th week of age at which the activity became inhibited that may be due to product inhibition. The enhanced activity probably arose in response to increased oxidative stress in order to help eliminate the accumulated toxic electrophiles arising from the action of ROS on different cellular macromolecules. The excessive production of glutathione conjugates in fetuses and offspring of diabetic pregnancy, as judged by increased activity of GST and availability of suitable substrates from the oxidative and degradative actions of free radicals on macromolecules, result in accumulation of the S-conjugates with the eventual amplification of their detrimental effects on the tissues that can cause toxicity, inhibition of key detoxification enzymes such as GST and GR and some glycolytic enzymes [39] . All of these may participate in the development of peripheral resistance to insulin action. There are accumulating of evidences that the insulin secretion and action and glucose metabolism regulation are sensitive targets of oxidative stress programming pre and post-natal. Previously we documented impaired glucose sensing and mitochondrial biogenesis and altered expression of uncoupling protein 2 (UCP2) and mitochondrial transcription factor A (mTFA) in the fetal tissues of diabetic gestation at GD 17 these impairments may related to the oxidative stress and shifted redox status [40] .
In the pancreas and liver of the offspring of diabetic mothers, the activities of GSH metabolizing enzymes couldn’t increase their activities in response to HCD during postnatal life like the offspring of control mothers. This could be explained by the fact that the chronic exposure to maternal hyperglycemia may affect the gene expression pattern of these enzymes which may persist postnatal and these low activities cannot overwhelm the increased oxidative stress and ROS generation during postnatal life especially in those offspring under HCD. These disturbed oxidant and antioxidant balance with age resulted in oxidative stress in pancreas and peripheral tissues which may cause impaired glucose tolerance and diabetes. This explanation is supported by the result which indicated that, while no overt diabetes is detected in the offspring of diabetic mothers maintained under control diet, postnatal feeding with HCD produce accelerated increase in the fasting blood sugar, the development of impaired glucose tolerance and finally type 2 diabetes. This effect is accompanied by exaggerated oxidative stress and disturbed antioxidant systems especially glutathione system in the pancreas and liver. These indicated that fetal programming can be manipulated postnatal through nutrition which could mask or accelerate the programming effect.
From the results of the present study, we concluded that maternal hyperglycemia disturbs the redox status and antioxidant systems and induces oxidative stress in the fetal tissues that may affect the expression of regulatory genes involved in embryonic development and cell-cycle progression, resulting in the induction of apoptosis. These fetal effects are magnified through life time. However, the postnatal feeding accelerates the magnified effect of fetal programming. All of these translated into a health problems manifested at the metabolic level in the form of insulin resistance, impaired glucose tolerance and type 2 diabetes. The detailed roles played by shifted redox status on prenatal epigenetic regulation need further investigations.
Acknowledgements
This study is a part of project entitled “Intra-Uterine Programming of Adult Diabetes: An Experimental Study” supported by STDF (Science and Technology Development Fund)—Egypt.
References
- Fetita, L.-S., Sobngwi, E., Serradas, P., Calvo, F. and Gautier, J.-F. (2006) Consequences of Fetal Exposure to Maternal Diabetes in Offspring. Journal of Clinical Endocrinology & Metabolism, 91, 3718-3724. http://dx.doi.org/10.1210/jc.2006-0624
- El-Bassiouni, E., Helmy, M., Abou, R.N., El-Zoghby, S., Kamel, M. and Abou, R.A. (2004) Embryopathy in Experimental Diabetic Gestation: Assessment of Oxidative Stress and Antioxidant Defence.. British Journal of Biomedical Science, 62, 71-76.
- Yessoufou, A. and Moutairou, K. (2011) Maternal Diabetes in Pregnancy: Early and Long-Term Outcomes on the Offspring and the Concept of “Metabolic Memory”. Experimental Diabetes Research, 2011, 12 Pages. http://dx.doi.org/10.1155/2011/218598
- Rajdl, D., Racek, J., Steinerova, A., et al. (2005) Markers of Oxidative Stress in Diabetic Mothers and Their Infants During Delivery. Physiological Research, 54, 429-436.
- Sen, S. and Simmons, R.A. (2010) Maternal Antioxidant Supplementation Prevents Adiposity in the Offspring of Western Diet-Fed Rats. Diabetes, 59, 3058-3065. http://dx.doi.org/10.2337/db10-0301
- Cooke, M.S., Olinski, R. and Evans, M.D. (2006) Does Measurement of Oxidative Damage to DNA Have Clinical Significance? Clinica Chimica Acta, 365, 30-49. http://dx.doi.org/10.1016/j.cca.2005.09.009
- Escobar, J., Teramo, K., Stefanovic, V., et al. (2012) Amniotic Fluid Oxidative and Nitrosative Stress Biomarkers Correlate with Fetal Chronic Hypoxia in Diabetic Pregnancies. Neonatology, 103, 193-198. http://dx.doi.org/10.1159/000345194
- Cheng, X., Chapple, S.J., Patel, B., et al. (2013) Gestational Diabetes Mellitus Impairs Nrf2-Mediated Adaptive Antioxidant Defenses and Redox Signaling in Fetal Endothelial Cells in Utero. Diabetes, 62, 4088-4097. http://dx.doi.org/10.2337/db13-0169
- El-Bassiouni, E., Helmy, M., Abou, R. N., El-Zoghby, S., Kamel, M. and Abou, R.A. (2004) Embryopathy in Experimental Diabetic Gestation: Assessment of PGE2 Level, Gene Expression of Cyclooxygenases and Apoptosis. British Journal of Biomedical Science, 62, 161-165.
- Dickinson, D.A. and Forman, H.J. (2002) Cellular Glutathione and Thiols Metabolism. Biochemical Pharmacology, 64, 1019-1026. http://dx.doi.org/10.1016/S0006-2952(02)01172-3
- Pallardó, F.V., Markovic, J., Garcia, J.L. and Viña, J. (2009) Role of Nuclear Glutathione as a Key Regulator of Cell Proliferation. Molecular Aspects of Medicine, 30, 77-85. http://dx.doi.org/10.1016/j.mam.2009.01.001
- Matés, J.M., Segura, J.A., Alonso, F.J. and Márquez, J. (2008) Intracellular Redox Status and Oxidative Stress: Implications for Cell Proliferation, Apoptosis, and Carcinogenesis. Archives of Toxicology, 82, 273-299. http://dx.doi.org/10.1007/s00204-008-0304-z
- Schafer, F.Q. and Buettner, G.R. (2001) Redox Environment of the Cell as Viewed through the Redox State of the Glutathione Disulfide/Glutathione Couple. Free Radical Biology and Medicine, 30, 1191-1212. http://dx.doi.org/10.1016/S0891-5849(01)00480-4
- Jones, D.P. (2010) Redox Sensing: Orthogonal Control in Cell Cycle and Apoptosis Signalling. Journal of Internal Medicine, 268, 432-448. http://dx.doi.org/10.1111/j.1365-2796.2010.02268.x
- Lushchak, V.I. (2012) Glutathione Homeostasis and Functions: Potential Targets for Medical Interventions. Journal of Amino Acids, 2012, 26 Pages. http://dx.doi.org/10.1155/2012/736837
- Perera, F. and Herbstman, J. (2011) Prenatal Environmental Exposures, Epigenetics, and Disease. Reproductive Toxicology, 31, 363-373. http://dx.doi.org/10.1016/j.reprotox.2010.12.055
- Thompson, L.P. and Al-Hasan, Y. (2012) Impact of Oxidative Stress in Fetal Programming. Journal of Pregnancy, 2012, 8 Pages. http://dx.doi.org/10.1155/2012/582748
- Arulmozhi, D., Veeranjaneyulu, A. and Bodhankar, S. (2004) Neonatal Streptozotocin-Induced Rat Model of Type 2 Diabetes Mellitus: A Glance. Indian Journal of Pharmacology, 36, 217-221
- Amoli, M.M., Moosavizadeh, R. and Larijani, B. (2005) Optimizing Conditions for Rat Pancreatic Islets Isolation. Cytotechnology, 48, 75-78. http://dx.doi.org/10.1007/s10616-005-3586-5
- Griffith, O.W. (1980) Determination of Glutathione and Glutathione Disulfide Using Glutathione Reductase and 2- Vinylpyridine. Analytical Biochemistry, 106, 207-212. http://dx.doi.org/10.1016/0003-2697(80)90139-6
- Smith, I.K., Vierheller, T.L. and Thorne, C.A. (1988) Assay of Glutathione Reductase in Crude Tissue Homogenates Using 5, 5’-Dithiobis (2-nitrobenzoic acid). Analytical Biochemistry, 175, 408-413. http://dx.doi.org/10.1016/0003-2697(88)90564-7
- Habig, W.H., Pabst, M.J. and Jakoby, W.B. (1976) Glutathione-S-transferase AA from Rat Liver. Archives of Biochemistry and Biophysics, 175, 710-716. http://dx.doi.org/10.1016/0003-9861(76)90563-4
- Flohé, L. and Günzler, W.A. (1984) Assays of Glutathione Peroxidase.. Methods in Enzymology, 105, 114. http://dx.doi.org/10.1016/S0076-6879(84)05015-1
- Marklund, S. and Marklund, G. (1974) Involvement of the Superoxide anion Radical in the Autoxidation of Pyrogallol and a Convenient Assay for Superoxide Dismutase. European Journal of Biochemistry, 47, 469-474. http://dx.doi.org/10.1111/j.1432-1033.1974.tb03714.x
- Draper, H. and Hadley, M. (1989) Malondialdehyde Determination as Index of Lipid Peroxidation.. Methods in Enzymology, 186, 421-431. http://dx.doi.org/10.1016/0076-6879(90)86135-I
- Dennery, P.A. (2010) Oxidative Stress in Development: Nature Or Nurture? Free Radical Biology and Medicine, 49, 1147-1151. http://dx.doi.org/10.1016/j.freeradbiomed.2010.07.011
- Simmons, R.A. (2006) Developmental Origins of Diabetes: The Role of Oxidative Stress. Free Radical Biology and Medicine, 40, 917-922. http://dx.doi.org/10.1016/j.freeradbiomed.2005.12.018
- Luo, Z., Fraser, W.D., Julien, P., et al. (2006) Tracing the Origins of “Fetal Origins” of Adult Diseases: Programming by Oxidative Stress? Medical Hypotheses, 66, 38-44. http://dx.doi.org/10.1016/j.mehy.2005.08.020
- Dennery, P.A. (2004) Role of Redox in Fetal Development and Neonatal Diseases. Antioxidants and Redox Signaling, 6, 147-153. http://dx.doi.org/10.1089/152308604771978453
- Chason, R.J., Csokmay, J., Segars, J.H., DeCherney, A.H. and Armant, D.R. (2011) Environmental and Epigenetic Effects upon Preimplantation Embryo Metabolism and Development. Trends in Endocrinology & Metabolism, 22, 412- 420. http://dx.doi.org/10.1016/j.tem.2011.05.005
- Ornoy, A. (2007) Embryonic Oxidative Stress as a Mechanism of Teratogenesis with Special Emphasis on Diabetic Embryopathy. Reproductive Toxicology, 24, 31-41. http://dx.doi.org/10.1016/j.reprotox.2007.04.004
- Karowicz-Bilinska, A., Suzin, J. and Sieroszewski, P. (2002) Evaluation of Oxidative Stress Indices during Treatment in Pregnant Women with Intrauterine Growth Retardation.. Medical Science Monitor: International Medical Journal of Experimental and Clinical Research, 8, 211-216.
- Rolo, A. P. and Palmeira, C.M. (2006) Diabetes and Mitochondrial Function: Role of Hyperglycemia and Oxidative Stress. Toxicology and Applied Pharmacology, 212, 167-178. http://dx.doi.org/10.1016/j.taap.2006.01.003
- Newsholme, P., Haber, E.P., Hirabara, S.M., et al. (2007) Diabetes Associated Cell Stress and Dysfunction: Role of Mitochondrial and Non-Mitochondrial ROS Production and Activity. The Journal of physiology, 583, 9-24. http://dx.doi.org/10.1113/jphysiol.2007.135871
- Myatt, L. (2010) Review: Reactive Oxygen and Nitrogen Species and Functional Adaptation of the Placenta. Placenta, 31, S66-S69. http://dx.doi.org/10.1016/j.placenta.2009.12.021
- Lee, H.-C. and Wei, Y.-H. (2005) Mitochondrial Biogenesis and Mitochondrial DNA Maintenance of Mammalian Cells under Oxidative Stress. The International Journal of Biochemistry & Cell Biology, 37, 822-834. http://dx.doi.org/10.1016/j.biocel.2004.09.010
- Robertson, R. P., Harmon, J., Tran, P. O., Tanaka, Y. and Takahashi H. (2003) Glucose Toxicity in Beta-Cells: Type 2 Diabetes, Good Radicals Gone Bad, and the Glutathione Connection. Diabetes, 52, 581-587. http://dx.doi.org/10.2337/diabetes.52.3.581
- Robertson R. P. and Harmon J. S. (2006) Diabetes, Glucose Toxicity, and Oxidative Stress: A Case of Double Jeopardy for the Pancreatic Islet Beta-Cell. Free Radical Biology and Medicine, 41, 177-184. http://dx.doi.org/10.1016/j.freeradbiomed.2005.04.030
- Noctor G., Gomez L., Vanacker, H. and Foyer C. H. (2002) Interactions between Biosynthesis, Compartmentation and Transport in the Control of Glutathione Homeostasis and Signalling. Journal of Experimental Botany, 53, 1283-1304. http://dx.doi.org/10.1093/jexbot/53.372.1283
- Kamel, M.A. (2012) Prenatal Effects of Different Intra-Uterine Milieus on Fetal Glucose Sensing Mechanisms during Gestation in Rats. Journal of Diabetes & Metabolism, 3, Article ID: 181. http://dx.doi.org/10.4172/2155-6156.1000181