World Journal of Cardiovascular Diseases
Vol.4 No.8(2014), Article
ID:48225,5
pages
DOI:10.4236/wjcd.2014.48048
Experimental Results on a New Method for Analysis of Heart Rate Variability
Elio Conte1,2, William Giroldini1, Vincenza Laterza1, Sergio Conte1, Maria Pieralice1, Francesco Casciaro1, Gabriele De Masi De Luca1, Antonio Francesco Maria Giuliano1, Leonardo Mendolicchio1,3, Orlando Todarello2
1School of Advanced International Studies on Applied Theoretical and Non Linear Methodologies of Physics, Bari, Italy
2Department of Neuroscience and Sense Organs, University Aldo Moro, Bari, Italy
3Villa Miralago, Health Center for Eating Disorder, Varese, Italy
Email: elio.conte@fastwebnet.it, stmp@saistmp.com
Copyright © 2014 by authors and Scientific Research Publishing Inc.
This work is licensed under the Creative Commons Attribution International License (CC BY).
http://creativecommons.org/licenses/by/4.0/


Received 7 May 2014; revised 22 June 2014; accepted 6 July 2014
ABSTRACT
A new method for HRV analysis is described and experimental results are given.
Keywords:Autonomic Neuroscience, HRV Analysis, FFT in HRV Analysis

1. Introduction
It is well known that the section of autonomic neuroscience and of Heart Rate Variability analysis (HRV) is assuming every day increasing importance and interest. In addition to time domain indexes, the FFT or DFT frequency-domain analysis is the most employed technique in HRV analysis. The technique highlights the issue of the underlying rhythms of the mechanisms modulating heart rate and usually identifies three major spectral bands (HF: 0.15 - 0.4 Hz), (LF: 0.04 - 0.15 Hz) and (VLF: 0.003 - 0.04 Hz) for adult subjects. Measurements are derived from short-term (i.e. 5 to 6 minutes) ECG recordings. Finger plethysmography (FP) may be used with found satisfactory correlation between FP and ECG results [1] . Obviously, the PG gives an approximate surrogate of hemodynamic changes due to blood pressure and flow changes in the periphery. Since heart rate can be roughly estimated from such a signal, it may result in insufficient for any kind of HRV analysis. The data relating R-R time series that we collected in this study are referenced as obtained by using FP. We report it here because it is currently used in psychophysiology. However, subject by subject, we also controlled the obtained R-R time series by one of the recorded ECG. The tachogram reconstruction was provided by using the methods that we currently utilize in our laboratory, the acknowledge software of the Biopac System and the Nevrokard software currently available for HRV analysis.
2. The Basic Explanation of the New Method
Let us go to the motivations and purpose of this study.
According to previous contributions [2] -[4] , the standard FFT method in HRV is excellent for estimations of ANS modulations in the VLF, LF, HF bands. However, it also contains limitations. R-R time series is non stationary, non periodic and non linear. In principle, FFT should be applied only to linear, periodic and stationary signals. Consequently, basic information is missing or is lost or approximated when using only FFT in HRV analysis. One tries to improve the situation introducing some methodological innovation possibly based on some robust physiological foundation. The combined use of two methods could provide an advancement in the reliability of the obtained results. A concept having a robust support in physiology, as well as in ANS and HRV studies and in cardiology, is that one of variability of heart rhythm.
Variability may be formally expressed by  where
where  states for the R-R time interval value at the beat n and
  states for the R-R value at the beat (n – k). k is an integer that may assume values k = 1, 2, 3, 4, 5∙∙∙ If we consider k = 1, we are estimating the difference (Variability)
  between two adjacent beats and for each beat. The concept of variability is not new here. The Task Force in 1996 recommended using such variable. Also we currently use the Poincaré Plot that is a bidimensional representation of variability by plotting the previous R-R time value against the subsequent. In such case we have not a frequency analysis in the three VLF, LF, and HF bands.
By the present method, we suggest to estimate the previous conceptually established instantaneous variability of the  time series in the following manner [5] [6]

The new obtained time series contains the difference . It is the variability that may be estimated in absolute value or without absolute value. In the first case we have a measure of variability as value. In the second case we estimate also when
  and when
 . Consequently, we have information on the dynamics between adjacent cardiac beats resulting the first case in a deceleration and the second case in an acceleration of the cardiac rhythm. Finally, performing the FFT analysis on such new time series
  we may evaluate variability in HRV in the three usual VLF, LF, and HF bands.
3. Materials and Methods
We have performed our experimentation analysing age group normal subjects.
All the subjects gave their written informed consent.
According to Task Force indications of the ESC and North American Society of Pacing and Electrophysiology in 1996 [7] , normal subjects were limited between 18 - 75 age. Subjects were selected not having psychological and internal disorder history. Subjects with high blood pressure, diabetes and chronic geriatric diseases were excluded. Subjects who contracted heart related disease or coronary artery disease, or CAD, heart failure, irregular heartbeat, diabetes were excluded. We dismissed subjects having abnormal Q wave, WPW syndrome. Subjects with hypertrophy on the left ventricles of the heart or heart hypertrophy were dismissed. Subjects having less than 90% of normal RR interval 90% were also dismissed. Subjects using smoking or alcohol were excluded. No drinking and no food within one hour prior to the exam was prescribed. Finger plethysmography (and ECG) was performed with sampling at 128 Hz. The test was performed at 9.30 a.m. Recording was performed with comfortable subject sitting, maintaining soft and distant indoor light and appropriate indoor temperatures (20˚C - 23˚C). Preparatory period for at least three minutes was performed using GSR tone to evaluate the condition of relax at rest with spontaneous and comfortable breathing No conversation was admitted during the recording, the exam was performed keeping eyes open. The mentioned automated peak identification softwares were used for identification of peaks and time intervals. Each tachogram by PG was accepted if and only if it resulted in agreement with the results obtained by ECG.
4. Results
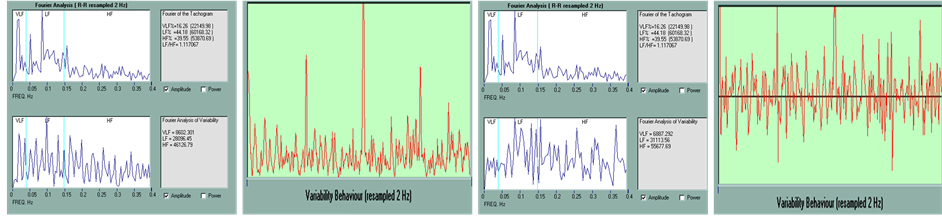
In the Figure we report the results in a young and in an old subject (Figure 1). In the upper side we report the result of the FFT analysis (Amplitude or Power) of the original series of R-R intervals and in the lower side we have the results of the FFT analysis when using the novel formula of variability,  with absolute value. Soon after we have the result of FFT analysis of the original series of R-R intervals and FFT results when using the formula of variability,
  without absolute value. The corresponding other four figures relate instead the case of an old subject. In each case we have the behaviour of the obtained FFT spectrum as well as the estimated results in the three bands VLF, LF, HF. In red we have the time behaviour of
  in the two cases of absolute value and without absolute values.
We give the values for young and old subjects (80 subjects, 50% man, 50% female). The first group covers the age intervals 18 - 45 years old, the second interval 46 - 75.
In the case of  with absolute value young subjects have a range (25972 - 82528) msec of estimated variability in LF band, a range (36467 - 85770) msec in HF band.
Old subjects have (8266 - 25344) msec in LF band, (14375 - 35136) msec in HF band. For VLF we have (8233 - 36557) msec and (2131 - 10368) msec for young and old subjects respectively. In the case of  without absolute value we have (37000 - 94562) for LF and (63158 - 157262) for HF in young subjects and (15537 - 35535) for LF and (17424 - 61540) for HF in old subjects. For VLF we have (2686 - 7773) for young subjects and (823 - 3000) for old subjects. On this basis we may reconstruct total variability, percentages and normalized unities and indexes, LF/(LF + HF), HF/(LF + HF), LF/HF, according to standard procedures. A number of studies have been conducted on HRV analysis and age in normal subjects using R-R time series [8] [9] . We calculated also statistical correlations between FFT results applied to R-R intervals and to the present method. We have similar results using formula with and without absolute value, correlation was found for VLF band with Pearson value 0.76 (P value < 0.0001), for LF band Pearson value 0.74 (P value < 0.0001), for HF band Pearson value 0.44 (P value = 0.0378).
5. Conclusions
In conclusion we may take advantage of using such two methods simultaneously. By using FFT we have the values in amplitude and power for R-R intervals and for variability,  with and without absolute value, in VLF, LF, HF bands and the total value VLF + LF + HF. In the last times different studies have appeared about the intimate connection between the brain and the heart [10] . According to our basic scheme [4] barore-
 (a)
(a)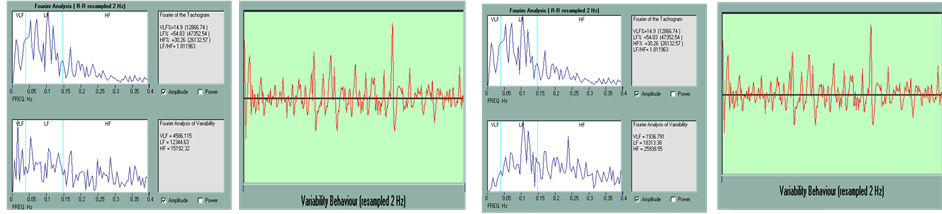 (b)
(b)
Figure 1. (a) Young subject; (b) Old subject.
captor inputs arrive in NTS (Nucleus Tractus Solitarius) and bifurcate reaching from one hand, the NA/DNM (Nucleus Ambigous/Dorsal Motor Nucleus) and from the other hand, the RVLM (Rostral Ventrolateral Medulla oblongata). In the first case a combination with activity of CNS (Central Nervous System, Hypothalamus) and activation of respiration determines parasympathetic activity. In the second case the combination with activity of CNS determines sympathetic activity. Activation of sympathetic and parasympathetic nervous innervation of pacemaker cells in the sinoatrial node determines heart rhythm and HRV. Using the combined two methods we have the possibility to estimate the ratios between LF total activity estimated as amplitude R-R values and induced variability in this band as well as in the HF band. In brief we may compare the amplitude of the parasympathetic dominant activity with respect to the actual induced variability in heart rhythm. The same estimation is obtained when using values in the HF band. We estimate the ratio between the modulating ANS action and the variability that it really induces. It is important in normal and pathological subjects. The second advantage: observing the given figure we verify existing peaks in the FFT spectrum of R-R intervals and . In order to understand in detail we have performed some simulations. We consider a R-R time series obtained from a recorded ECG; select a frequency. For example we may consider 0.1 Hz that is in the LF band. This means that the ANS is modulating with a time of every 10 sec. We corrupt the obtained experimental series, reducing its value about 10% every 10 sec. This is to say that we are introducing an ad hoc modulating component that decreases the value of R-R every ten seconds. This is a periodic corruption at 0.1 Hz. The result is that we have a peak at 0.1 Hz in the standard FFT spectrum of R-R intervals as well as in the ones of
  with and without absolute value. We perform now the same simulation but this time increase the value of the R-R time series every ten seconds. The result is similar in the sense that we have a peak in the standard FFT spectrum as well as in the ones of
  with and without absolute value. Now let us perform another simulation. Every ten seconds, one time we increase the R-R value about 10% and one time we decrease the value about 10%. The result is of interest since this time the peak at 0.1 Hz disappears in the FFT spectrum of R-R intervals but appears instead in the ones of
  with and without absolute value. Finally, let us perform the last simulation. Every ten seconds we corrupt the series by noise.
This time, again, the peak at 0.1 Hz disappears in the standard FFT spectrum of R-R intervals but appears instead in the ones of  with and without absolute value. Generally speaking, variability is generated by periodic inputs in particular in the medullary cardiovascular centers. The present simulation indicates that using the combined two methods we may have information on synchronization or desynchronization that may be induced in modulation and induced variability. It is also well known that human cardiovascular variables exhibit noisy dynamics [11] and the constructive role of noise component in particular in synchronization. We obtain that using the present method we may have information also on this modulating component. The simple arising criterion seems to be that each time we have to inspect the simultaneous presence or absence of peaks in the three obtained FFT spectra.
In conclusion, the method seems appropriate. We have experienced it also in different pathological conditions. We encourage scholars to experience the novel method. Software free download may be found in our site (www.saistmp.com).
References
- Giardino, N.D., Lehrer, P.M. and Edelberg, R. (2002) Comparison of Finger Plethysmograph to ECG in the Measurement of Heart Rate Variability. Psychophysiology, 39, 246-253. http://dx.doi.org/10.1111/1469-8986.3920246
- Conte, E., Pieralice, M., Laterza, V., Losurdo, A., Santacroce, N., Conte, S., Federici, A. and Giuliani, A. (2012) Traditional and a New Methodology for Analysis of Heart Rate Variability: A Review by Physiological and Clinical Experimental Results. International Journal of Research and Review in Applied Sciences, 13, 206-293.
- Conte, E., Federici, A. and Zbilut, J.P. (2009) A New Method Based on Fractal Variance Function for Analysis and Quantification of Sympathetic and Vagal Activity in Variability of R-R Time Series in ECG Signals. Chaos, Solitons and Fractals, 41, 1416-1426. http://dx.doi.org/10.1016/j.chaos.2008.05.025
- Conte, E. (2007) The Variability of Signals in Clinical Electrophysiology: Principles and Methods of Analysis. EDISES Edition, Naples.
- Conte, E. (2014) A New Method for Analysis of Heart Rate Variability, Asymmetry and BRS. Chaos and Complexity Letters, 8.
- Conte, E. (1985) The Degree of Time Asymmetry: On a New Parameter of Biological Matter for Estimation by Radioisotope Techniques and Use in Nuclear Medicine. Rays, 10, 91-95.
- Task Force of the European Society of Cardiology and the North American Society of Pacing and Electrophysiology (1996) Heart Rate Variability: Standards of Measurement, Physiological Interpretation and Clinical Use. Circulation, 93, 1043-1065. http://dx.doi.org/10.1161/01.CIR.93.5.1043
- Stein, P.K., Barzilay, J.I., Chaves, P.H.M., Domitrovich, P.P. and Gottdiener, J.S. (2009) Heart Rate Variability and Its Changes over 5 Years in Older Adults. Age and Ageing, 38, 212-218. http://dx.doi.org/10.1093/ageing/afn292
- Moodithaya, S. and Avadhany, S.T. (2012) Gender Differences in Age-Related Changes in Cardiac Autonomic Nervous Function. Journal of Aging Research, 2012, Article ID: 679345. http://dx.doi.org/10.1155/2012/679345
- Thayer, J.F., Ahs, F., Fredrikson, M., Sollers III, J.J. and Wager, T.D. (2012) A Meta-Analysis of Heart Rate Variability and Neuroimaging Studies: Implications for Heart Rate Variability as a Marker of Stress and Health. Neuroscience and Biobehavioral Reviews, 36, 747-756. http://dx.doi.org/10.1016/j.neubiorev.2011.11.009
- Kotani, K., Takamasu, K., Ashkenazy, Y., Stanley, H.E. and Yamamoto, Y. (2002) Model for Cardiorespiratory Synchronization in Humans. Physical Review E, 65, 1-9. http://dx.doi.org/10.1103/PhysRevE.65.051923