Open Journal of Epidemiology
Vol.05 No.04(2015), Article ID:60947,12 pages
10.4236/ojepi.2015.54026
Determination of the Optimal Waist Circumference Cut-Off Points in Benin Adults
Victoire Damienne Agueh1, Charles Sossa1,2*, Dona Marius-Edgard Ouendo1, Noel M. Paraizo1, Colette Azandjemè1,2, Alphonse Kpozehouen1, Clémence Metonnou1, Jacques Saizonou1, Laurent T. Ouédraogo1, Michel Makoutodé1, Hélène Delisle2
1Institut Régional de Santé Publique (IRSP) de Ouidah, Cotonou, Bénin
2TRANSNUT, Centre Collaborateur OMS sur la transition nutritionnelle et le développement, Département de Nutrition, Faculté of Médecine, Université de Montréal, Montréal, Canada

Copyright © 2015 by authors and Scientific Research Publishing Inc.
This work is licensed under the Creative Commons Attribution International License (CC BY).


Received 3 August 2015; accepted 6 November 2015; published 9 November 2015

ABSTRACT
Obesity is an independent risk factor for chronic diseases such as diabetes, cardiovascular diseases and certain cancers. Early detection of abdominal obesity followed by appropriate interventions will prevent associated diseases. The objective was to determine optimal waist circumference (WC) cut-off points predictive of at least one other component of metabolic syndrome in Benin adults. This longitudinal and observational study included at the baseline 541 apparently healthy subjects aged 25 - 60 years randomly selected in the largest city of Cotonou (n = 200), the smaller-size city of Ouidah (n = 171) and rural surroundings of Ouidah (n = 170) in Benin. Components of the metabolic syndrome considered along with abdominal obesity were high blood pressure, high fasting glycaemia, low HDL-cholesterol and high triglycerides as defined by the Joint Interim Statement. After the baseline survey, the subjects were followed-up for four years. Complete data at baseline and four years later were available in 416 subjects. The receiver operating characteristic (ROC) curve for waist circumference to predict at least one other component of the metabolic syndrome was plotted and the Youden index was used to define the optimal cut-offs of WC. At the baseline of the study, the optimal WC cut-off point to predict the presence of at least one other component of the metabolic syndrome was 80 cm for men (sensitivity = 0.62, specificity = 0.65); the area under the ROC curve was 0.67 (IC 95%: 0.61 - 0.74). In women, the optimal WC cut-off point was 90 cm (sensitivity = 0.54, specificity = 0.80), and the area under the ROC curve was 0.68 (IC 95%: 0.62 - 0.75). These optimal cut-offs were similar four years later. Optimum WC cut-off points for both men and women in Benin differ from those currently recommended for sub-Saharan Africans. Therefore, waist circumference cut-off points for abdominal obesity need to be reconsidered for these populations.
Keywords:
Waist Circumference, Cut-Offs, Cardiometabolic Risk, Benin

1. Introduction
Obesity is an independent risk factor for chronic diseases such as diabetes, cardiovascular diseases (CVD) and certain cancers [1] , which are the leading causes of death worldwide [2] [3] . The increasing incidence of chronic diseases associated with obesity affects mainly developing countries (DCs) [4] . Changes in lifestyle and diet that characterize the nutritional transition in progress contribute to the obesity epidemic in DCs [5] . The metabolic complications associated with obesity are more closely related to the distribution of adipose tissue than excess body weight according to recent epidemiological and metabolic studies [6] [7] . Abdominal obesity (AO) induces a cardiometabolic risk (CMR) compared with the general or gynoid obesity [8] . The correlation between the abdominal fat and diabetogenic and atherogenic alterations whose aggregation determines metabolic syndrome (MS) is increasingly established [6] . Metabolic syndrome points out numerous vascular risk factors clustering together, due to a common mechanistic substratum, visceral obesity and insulin resistance [9] . The risk factors include raised blood pressure, dyslipidemia (raised triglycerides and lowered high-density lipoprotein cholesterol), raised fasting glucose, and abdominal obesity. Any three abnormal findings out of five would qualify a person for the MS [6] . Several studies reported that people with MS have an increased risk to develop diseases such as diabetes, and CVD [10] [11]
Thus, AO better predicted CVD and type-2 diabetes than general obesity as defined by a body mass index (BMI) [8] [12] -[14] . AO is considered as an indicator of visceral adiposity and is a key factor in the initiation and progression of insulin resistance syndrome [15] -[17] . Early detection of abdominal obesity followed by appropriate interventions will prevent associated diseases.
In the absence of specific data, waist circumference cut-offs of first risk level (94 cm in men and 80 cm for women) identified from studies of predominantly European-derived populations [18] [19] are currently recommended for sub-Saharan Africans [20] . Based on these cut-offs, studies reported that despite a higher prevalence of AO, African-Americans, descendants of sub-Saharan Africans, have a lower prevalence of MS than Caucasians [21] . Paradoxically, diabetes prevalence rates and CVD are higher in African-Americans than Caucasians [21] [22] . This paradox raises the question of the validity of the current criteria used to define the MS in African-Americans. Motala et al. [23] recently determined in a rural black population of South Africa, optimal WC cut-offs to predict two other components of MS that were different from those currently recommended for sub-Saharan Africans. These authors observed that the optimal waist circumference cut-off point to predict the presence of at least two other components of the metabolic syndrome was 86 cm for men and 92 cm for women. Authors concluded that WC cut-off points differ from those currently recommended for Africans.
Recently, Charbonnel et al. [9] mentioned that the definitions of the syndrome allow identifying individuals at risk of vascular disease and diabetes but actually do not add anything to the predictive value of the individual components of the syndrome. For early detection of cardiometabolic risk, the objective of this study was to determine the optimal cut-offs predictive of at least one other component of SM in Benin adults. We hypothesize that the optimal WC cut-offs predictive of at least one component of SM in Benin are different from those currently recommended for sub-Saharan Africans.
2. Subjects and Methods
2.1. Settings
The study was conducted in the southern part of Benin in the largest urban city (Cotonou), semi-urban area (Ouidah) located 40 kilometers from Cotonou and its rural outskirts from 2006 to 2010.
2.2. Study Design
This was community-based longitudinal and observational study. After baseline survey (2006), participants were followed two years and four years later (2010). The present report analyses baseline and four years later collected data.
2.3. Study Population
The study population was adults of both sexes aged 25 - 65 years.
2.4. Sample Size
To estimate the minimum required number of subjects to use area under the ROC curve statistic test, we considered blood pressure (BP) as the main dependent variable since high blood pressure (hypertension) is the most frequent CMR factor in sub-Saharan African population [24] -[26] and is the main cause of stroke in this population [27] . By setting α and β errors to 5% and 20% respectively, the expected area under the ROC curve to 0.60, the area under the ROC curve in the null hypothesis to 0.50 and the ratio negative cases/positive cases to 1/3 [28] , the minimum required sample size is 352 using the software “MedCalc Version 13.1.2, Ostend, Belgium”. The study initially (T0) included 541 adults aged 25 - 60 years randomly selected from the largest city of Cotonou (n = 200), the small city of Ouidah (n = 171) and surrounding rural areas of Ouidah (n = 170). Among the 541 selected subjects, 416 (77%) participated in the survey conducted four years later (T4).
2.5. Selection of Participants
In the urban areas in Cotonou, ten out of the 140 neighborhoods were randomly selected. In each selected neighborhoods, 20 households were randomly identified based on the list of households. In each household, one eligible adult was selected at random, a man and a woman alternately. A total of 200 subjects were selected.
In the semi-urban areas of the small town of Ouidah, five out of the 22 neighborhoods were selected at random. Concessions in selected neighborhoods were numbered. At random, 34 concessions in each selected neighborhood were identified. In the household of concession, an eligible adult is drawn to participate in the study. A total of 171 subjects were obtained.
In rural outskirts of Ouidah, five out of 38 villages were randomly selected. A census of families of each selected villages was done. At random, 34 families from the list drawn in each selected village were selected. In families, one adult among eligible members was selected. A total of 170 subjects were recruited.
2.6. Inclusion and Exclusion Criteria in the Basic Studies
Each participant in the baseline survey should meet the following criteria:
・ Aged between 25 - 65years;
・ Be in good health (no cardiometabolic disorders diagnosed);
・ Being born of two parents and Black Benin grandparents;
・ Live in the study area permanently for at least six months.
The categories of following subjects were excluded:
・ Pregnant and lactating women;
・ Subjects seriously ill (or bedridden terminally ill cancer);
・ Subjects physically handicapped and mentally ill;
・ Persons already diagnosed for hypertension, heart disease, diabetes or other metabolic disease.
2.7. Data Collection Procedures
Anthropometric measurements were taken by trained teams. Venous blood samples were drawn after an overnight fast. Blood samples were stored on ice and centrifuged within two hours. Plasma and serum were stored at −30˚C until analyzed in the biochemistry laboratory of the Institute of Applied Biomedical Sciences in Cotonou. Subjects were organized into self-help groups by area of residence to facilitate follow-up and for active prevention support once the follow-up study would be over. Apart from contacts for formal follow-up data collection, self-help groups were encouraged to meet every three months for weight and blood pressure checks, and for standard general health advice. Anthropometric and blood pressure data that were collected during these meetings were not used in the study reported here.
2.8. Study Variables
2.8.1. Independent Variable
The independent variable was WC that was assessed using a measuring tape (Gulick measuring tape©) flexible but not extensible, with a spring for regulating the intensity applied during measurement with an accuracy of 0.1 cm. The measurement was made at midway between the last rib and the iliac crest [29] . Two measurements were taken for each subject. The arithmetic mean of the values obtained during two successive measurements was used. We used cut offs of first risk level (94 cm in men and 80 cm for women) recommended by Joint Interim Statement to define abdominal obesity in the diagnosis of MS [20] among sub-Saharan Africans in the absence of specific data. For comparison purposes, we also used optimal WC cut offs determined by Motala et al. (WC ≥ 86 cm in men and ≥92 cm in women) in black South Africans [23] .
2.8.2. Dependent Variables
Dependent variables include other component of MS (excluding abdominal obesity). Participants with one, two, three or four MS components (excluding abdominal obesity) referred to participants with at least one other component of MS.
Blood pressure
Systolic and diastolic BP were measured using a mercury manometer pulse to the left arm of each subject in a seated position [30] . Two measurements were taken at 10 minutes intervals in the subject at rest for at least five minutes. For the same individual, measures were taken by the same person. The arithmetic mean of the values obtained during two successive measurements was used. The cut offs proposed in harmonized definition of SM [17] were used to define the high BP (systolic BP ≥ 130 mm Hg or diastolic BP ≥ 85 mm Hg).
Biochemical parameters
Blood glucose was measured in plasma using glucose oxidase method in subjects fasted for at least 12 hours. Diabetes was defined using the WHO cut offs. Fasting glucose > 7 mmol/L indicates diabetes [31] . Criteria for the harmonized definition of SM [20] were used to define hyperglycemia (blood glucose > 5.6 mmol/L) [31] .
Blood lipids were measured in serum of subjects fasted for at least 12 hours by colorimetric enzymatic method using kits Elitech group (Sees, France). Proposed cut offs in harmonized definition of SM [20] were used to define the abnormally high levels of triglycerides (>1.70 mmol/L) and low HDL-C (≤1.29 mmol/L in women; ≤1.03 mmol/L in men).
Metabolic syndrome
We used harmonized definition of MS, which requires the presence of at least any three of the following five abnormalities: high BP (systolic BP ≥ 130 and/or diastolic BP ≥ 85 mmHg or antihypertensive treatment), low HDL-cholesterol (<1.0 mmol/L in men; <1.3 mmol/L for women), high triglycerides (≥1.7 mmol/L), fasting hyperglycemia (≥5.6 mmol/L or antidiabetic treatment), abdominal obesity (WC ≥ 80 cm in women and ≥94 cm in men) [20] .
2.9. Data Analysis
Data were analyzed with SPSS software, Version 20.0 (SPSS Inc., Chicago, IL). The ROC (Receiver Operator Characteristic) curve for WC to predict the presence of at least one other component of MS (anyone of the five components of MS excluding abdominal obesity), was plotted at T0 and T4. Optimal cut offs for WC was determined by plotting the true-positive rate (sensitivity) against the false-positive rate (1-specificity). Using Youden index calculated by the formula: sensitivity + specificity − 1, optimal cut offs values were determined at baseline (T0) and after four years (T4) [32] .
2.10. Ethical Considerations
The study was approved by the ethics committees of the Faculty of Medicine of the University of Montreal and the Ministry of Health of Benin. Written informed consent was obtained from each participant. All participants were informed individually of their BP and results of laboratory tests. Those who showed abnormal values were referred to a doctor for diagnosis and treatment. Initial consultations and prescriptions were paid by the research project.
3. Results
3.1. Sample Changes during Follow-Up
Among the 541 study participants at T0, 416 (77%) were present at the four years later follow up (T4). Table 1 compares baseline characteristics of the 416 subjects at T4 with drop out subjects (n = 125). The proportion of subjects missed at four years later survey in the big city was significantly higher than in other study sites. The average waist circumference was significantly lower among drop out men compared to those found at T4.
3.2. Changes in Cardiometabolic Risk Factors during Follow-Up
The evolution of CMR factors in 416 patients was described elsewhere [33] . In short, Table 2 provides informations on CMR factors and MS at T0 and at T4. Final prevalence and means of CMR factors were generally higher compared to baseline values except for blood pressure which was significantly lower at follow-up. For WC, we observed a downward trend among women, whereas the trend was positive in the nonobese women and an upward trend in men. MS was more prevalent in women. Prevalence rates of MS over four years varied from 11.1% to 18.6% in women and from 6.2% to 9.2% in men.
3.3. Optimal Waist Circumference Cut-Offs Predictive of at Least One Other Component of Metabolic Syndrome
3.3.1. At the Onset of the Study
Figure 1 and Figure 2 show the ROC curves for WC in predicting at least one component of MS at T0 in 416 subjects (women and men separately).
In women (Figure 1), the area under the ROC curve was 0.68 (95% CI: 0.62 to 0.75). The optimal WC cut off point predictive of at least one component of MS was 90 cm with a sensitivity of 0.54 and specificity of 0.80.

Table 1. Baseline characteristics of subjects present at last follow up and drop out.
*p: for t-test or χ2 test.
Table 2. Evolution of prevalence and means of cardiometabolic risk factors during the four-year follow-up period (n = 416).
Values are expressed as means ± SD or percentage. BP: blood pressure, FG: fasting glycemia, HDL-C: high density lipoprotein cholesterol, TC: total cholesterol, WC: waist circumference, TG: Triglycerides, MS: metabolic syndrome. ap: for t-test or χ2 test, b33 subjects (23 women and 10 men) under medical treatment for high blood pressure are excluded, cincludes 33 subjects (23 women and 10 men) under medical treatment for high blood pressure, d4 subjects (1 woman and 3 men) under medical treatment for diabetes are excluded, eincludes 4 subjects under treatment for diabetes.

Figure 1. ROC curves for waist circumference for predicting at least one component of metabolic syndrome at T0 in 208 women, southern Benin.
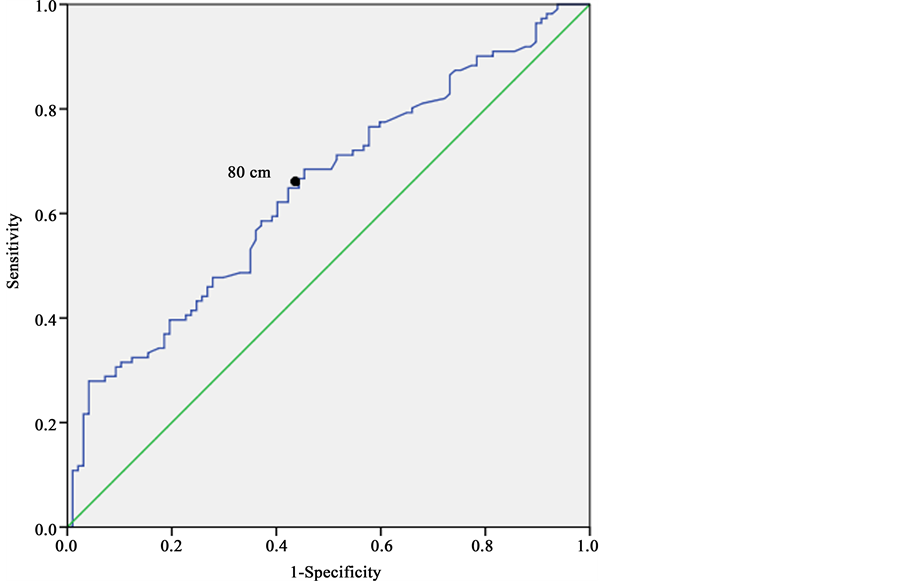
Figure 2. ROC curves for waist circumference for predicting at least one component of metabolic syndrome at T0 in 208 men, southern Benin.
In men (Figure 2), the area under the ROC curve was 0.67 (95% CI: 0.61 to 0.74). The optimal WC cut off point predictive of at least one other component of MS was 80 cm with a sensitivity of 0.62 and specificity of 0.65.
3.3.2. At Four Years Follow-Up
Figure 3 and Figure 4 show the ROC curves of WC for predicting at least one component of MS T4 in 416 subjects (women and men separately). The determined optimal WC cut offs were similar to those found at T0 in both men and women. This reflects a relative stability in cut offs values over time (four years in the present study).
In women (Figure 3), the area under the ROC curve was 0.60 (95% CI: 0.52 to 0.68). The optimal WC cut off point predictive of at least one component of MS was 90 cm with a sensitivity of 0.50 and specificity of 0.71.
In men (Figure 4), the area under the ROC curve was 0.68 (95% CI: 0.60 to 0.75). The optimal WC cut off point predictive of at least one other component of MS was 81 cm with a sensitivity of 0.62 and specificity of 0.67.
4. Discussion
This study is, to our knowledge, one of the first community based studies in West Africa to explore the optimal WC cut offs to predict other abnormalities of MS. Optimum WC cut-off points determined in the study for both men and women in Benin differ from those currently recommended for sub-Saharan Africans.
We noted that the WC optimal cut-off points in Benin adults men and women were different from those currently recommended for sub-Saharan Africa. Fezeu et al. [34] , in a comparative study between Cameroonian and French, had reported that cut offs derived Caucasians were not appropriate for sub-Saharan Africans. Several cross-sectional studies conducted in South Africa [23] [35] [36] have suggested different WC cut offs of those currently use in Africans. For example, Motala et al. [23] in a community-based cross-sectional study of 947 adults (758 women) Black South Africa, proposed WC cut off points of 86 cm for men and 92 cm for women to predict at least any two components of MS. Prinslo et al. [36] , in the study of 80 men and 93 women in South

Figure 3. ROC curves for waist circumference for predicting at least one component of metabolic syndrome at T4 in 208 women, southern Benin 2014.

Figure 4. ROC curves for waist circumference for predicting at least one component of metabolic syndrome at T4 in 208 men, southern Benin.
African adults, proposed WC cut offs of 90 cm in men and 98 cm for women, for the prediction of high BP. Cut-offs reported by these South African studies were consistent with our findings as regards the fact that women WC cut-offs were higher than in men. However the WC cut offs were not exactly the same because, certainly, differences in the prediction targets. Indeed, Motala et al. [23] identified optimal WC cut offs to predict two other components of MS and Prinslo et al. [36] to predict hypertension only. In our study, for early detection of cardiometabolic risk we determined WC cut offs to predict at least one other component of the MS as study mentioned that cluster of risk factors do not add anything to the predictive value of the individual components of the syndrome
The low WC cut offs in men compared to women observed in our study is consistent with studies of Lemieux et al. [37] who reported that men are on average twice as much visceral abdominal fat than premenopausal women. In convergence, Fontbone et al. observed in Senegal, a more favorable RCM profile in women compared to men, which showed a high prevalence of low HDL cholesterol levels [38] , while high levels of HDL- cholesterol are considered as a specific protection factor sex for women [39] . However, during menopause, lipid profile of women becomes more atherogenic and is associated with weight gain [40] . In our study, 34.6% were aged 45 - 65 years and menopause occurs in sub-Saharan African women around the age of 48.1 ± 3.6 [41] .
A possible explanation for the reduction of mean WC an blood pressure we observed during the study is that individuals became more aware of their blood pressure as it was checked in the self-help groups, making them more receptive to the general health advice given to them and adoptive of preventive diet and lifestyle, which cannot be verified.
Other studies have shown that African descent have proportionately less total fat [42] , abdominal [43] and visceral [44] than Caucasians. Despres et al. [43] compared the associations between body fatness, visceral adipose tissue accumulation, and metabolic risk variables in a sample of 247 white men and 240 white women versus a sample of 93 black men and 143 black women. Although no difference in mean total body fatness was found between the 2 race groups, white men had higher levels of visceral AT than did black men (p < 0.001). These authors observed that despite the fact that black women had a greater body fat content than did white women, black women had levels of visceral adipose tissue that were similar to those of white women, suggesting a lower susceptibility to visceral obesity in black women. In contrast, African American women have more subcutaneous abdominal adipose tissue than Caucasian women with identical fat [45] . However, sub-Saharan Africans, like their American Afro descendants have higher RCM, as noted Diaz et al. [46] who reported that the prevalence of diabetes in Caucasian Americans of normal weight (BMI < 25 kg/m2) was lower than in African Americans. These authors suggested that studies be conducted to determine the specific ethno-optimal cut-offs for the different anthropometric measurements in order to improve the prediction of diabetes risk. Evans et al. [47] , in their survey of 241 blacks and 188 Caucasians, had observed that optimal WC cut offs varied in both races. The WC cut offs values determined in the present study are the reflection of the specificity of sub- Saharan Africans regarding the CMR.
Some limitation can be addressed in this study. The study was performed only in the southern part of Benin. The sample attrition occurred during follow-up did not have substantial impact on the statistical power. The relatively short duration of follow up did not allow collecting data on the incidence of diabetes and cardiovascular disease (or cancer) to assess the risk of diseases associated with WC cut off points determined.
5. Conclusion
The study determined four-year stable optimal WC cut-offs predictive of at least one other component of MS among Beninese adults. The optimal WC cut-off points to predict the presence of at least one other component of the metabolic syndrome was 80 cm for men and 90 cm in women. Determined WC cut-offs are different from those currently in use for sub-Saharan Africans. Studies in larger cohorts of sub-Saharan Africans living in different settings are required to confirm the present findings.
Conflicts of Interest
The authors declare no conflict of interest.
Author Contributions
H. Delisle, V. Agueh and C. Sossa developed the protocol and C. Sossa collected the data under the supervision of M. Makoutodé and V. Agueh. C. Sossa analyzed the data and wrote the first draft of the manuscript. All co-authors have contributed to the revision and finalization of the document.
Acknowledgments
The authors express their gratitude to field investigators and study participants. The study was funded by the Canadian International Development Agency (CIDA).
Cite this paper
Victoire DamienneAgueh,CharlesSossa,Dona Marius-EdgardOuendo,Noel M.Paraizo,ColetteAzandjemè,AlphonseKpozehouen,ClémenceMetonnou,JacquesSaizonou,Laurent T.Ouédraogo,MichelMakoutodé,HélèneDelisle, (2015) Determination of the Optimal Waist Circumference Cut-Off Points in Benin Adults. Open Journal of Epidemiology,05,217-228. doi: 10.4236/ojepi.2015.54026
References
- 1. Calle, E.E. (2007) Obesity and Cancer. BMJ, 335, 1107-1108.
http://dx.doi.org/10.1136/bmj.39384.472072.80 - 2. Dyer, A.R., Stamler, J., Garside, D.B. and Greenland, P. (2004) Long-Term Consequences of Body Mass Index for Cardiovascular Mortality: The Chicago Heart Association Detection Project in Industry Study. Annals of Epidemiology, 14, 101-108.
http://dx.doi.org/10.1016/S1047-2797(03)00121-2 - 3. Narayan, K.M., Boyle, J.P., Thompson, T.J., Gregg, E.W. and Williamson, D.F. (2007) Effect of BMI on Lifetime Risk for Diabetes in the U.S. Diabetes Care, 30, 1562-1566.
http://dx.doi.org/10.2337/dc06-2544 - 4. Girman, C.J., Rhodes, T., Mercuri, M., Pyorala, K., Kjekshus, J., Pedersen, T.R., et al. (2004) The Metabolic Syndrome and Risk of Major Coronary Events in the Scandinavian Simvastatin Survival Study (4S) and the Air Force/ Texas Coronary Atherosclerosis Prevention Study (AFCAPS/TexCAPS). American Journal of Cardiology, 93, 136- 141.
http://dx.doi.org/10.1016/j.amjcard.2003.09.028 - 5. Popkin, B.M. (2002) An Overview on the Nutrition Transition and Its Health Implications: The Bellagio Meeting. Public Health Nutrition, 5, 93-103.
- 6. Després, J.P., Lemieux, I., Bergeron, J., Pibarot, P., Mathieu, P., Larose, E., et al. (2008) Abdominal Obesity and the Metabolic Syndrome: Contribution to Global Cardiometabolic Risk. Arteriosclerosis, Thrombosis, and Vascular Biology, 28, 1039-1049.
http://dx.doi.org/10.1161/ATVBAHA.107.159228 - 7. Zhu, S., Heymsfield, S.B., Toyoshima, H., Wang, Z., Pietrobelli, A. and Heshka, S. (2005) Race-Ethnicity-Specific Waist Circumference Cutoffs for Identifying Cardiovascular Disease Risk Factors. American Journal of Clinical Nutrition, 81, 409-415.
- 8. Després, J.P., Arsenault, B.J., Cote, M., Cartier, A. and Lemieux, I. (2008) Abdominal Obesity: The Cholesterol of the 21st Century? Canadian Journal of Cardiology, 24, 7D-12D.
http://dx.doi.org/10.1016/S0828-282X(08)71043-2 - 9. Charbonnel, B. (2005) Metabolic Syndrome and Cardiovascular Risk. Review of Practitioner, 55, 1765-1771.
- 10. McNeill, A.M., Katz, R., Girman, C.J., Rosamond, W.D., Wagenknecht, L.E., Barzilay, J.I., et al. (2006) Metabolic Syndrome and Cardiovascular Disease in Older People: The Cardiovascular Health Study. Journal of the American Geriatrics Society, 54, 1317-1324.
http://dx.doi.org/10.1111/j.1532-5415.2006.00862.x - 11. Ogbera, A.O. (2010) Prevalence and Gender Distribution of the Metabolic Syndrome. Diabetology & Metabolic Syndrome, 2, 1.
http://dx.doi.org/10.1186/1758-5996-2-1 - 12. Despres, J.P. (2001) Health Consequences of Visceral Obesity. Annals of Medicine, 33, 534-541.
http://dx.doi.org/10.3109/07853890108995963 - 13. Stevens, J., Couper, D., Pankow, J., Folsom, A.R., Duncan, B.B., Nieto, F.J., et al. (2001) Sensitivity and Specificity of Anthropometrics for the Prediction of Diabetes in a Biracial Cohort. Obesity Research, 9, 696-705.
http://dx.doi.org/10.1038/oby.2001.94 - 14. Yusuf, S., Hawken, S., Ounpuu, S., Bautista, L., Franzosi, M.G., Commerford, P., et al. (2005) Obesity and the Risk of Myocardial Infarction in 27,000 Participants from 52 Countries: A Case-Control Study. Lancet, 366, 1640-1649.
http://dx.doi.org/10.1016/S0140-6736(05)67663-5 - 15. Despres, J.P. and Lemieux, I. (2006) Abdominal Obesity and Metabolic Syndrome. Nature, 444, 881-887.
http://dx.doi.org/10.1038/nature05488 - 16. Govindarajan, G., Whaley-Connell, A., Mugo, M., Stump, C. and Sowers, J.R. (2005) The Cardiometabolic Syndrome as a Cardiovascular Risk Factor. American Journal of the Medical Sciences, 330, 311-318.
http://dx.doi.org/10.1097/00000441-200512000-00009 - 17. Klein, S., Allison, D.B., Heymsfield, S.B., Kelley, D.E., Leibel, R.L., Nonas, C., et al. (2007) Waist Circumference and Cardiometabolic Risk: A Consensus Statement from Shaping America’s Health: Association for Weight Management and Obesity Prevention; NAASO, the Obesity Society; the American Society for Nutrition; and the American Diabetes Association. Diabetes Care, 30, 1647-1652.
http://dx.doi.org/10.2337/dc07-9921 - 18. Lean, M.E., Han, T.S. and Morrison, C.E. (1995) Waist Circumference as a Measure for Indicating Need for Weight Management. BMJ, 311, 158-161.
http://dx.doi.org/10.1136/bmj.311.6998.158 - 19. Lean, M.E., Han, T.S. and Seidell, J.C. (1998) Impairment of Health and Quality of Life in People with Large Waist Circumference. Lancet, 351, 853-836.
http://dx.doi.org/10.1016/S0140-6736(97)10004-6 - 20. Alberti, K.G., Eckel, R.H., Grundy, S.M., Zimmet, P.Z., Cleeman, J.I., Donato, K.A., et al. (2009) Harmonizing the Metabolic Syndrome: A Joint Interim Statement of the International Diabetes Federation Task Force on Epidemiology and Prevention; National Heart, Lung, and Blood Institute; American Heart Association; World Heart Federation; International Atherosclerosis Society; and International Association for the Study of Obesity. Circulation, 120, 1640-1645.
http://dx.doi.org/10.1161/CIRCULATIONAHA.109.192644 - 21. Gaillard, T., Schuster, D. and Osei, K. (2009) Metabolic Syndrome in Black People of the African Diaspora: The Paradox of Current Classification, Definition and Criteria. Ethnicity & Disease, 19, 1-7.
- 22. Ervin, R.B. (2009) Prevalence of Metabolic Syndrome among Adults 20 Years of Age and Over, by Sex, Age, Race and Ethnicity, and Body Mass Index: United States, 2003-2006. National Health Statistics Reports, No. 13, 1-7.
- 23. Motala, A.A., Esterhuizen, T., Pirie, F.J. and Omar, M.A. (2011) The Prevalence of Metabolic Syndrome and Determination of the Optimal Waist Circumference Cutoff Points in a Rural South African Community. Diabetes Care, 34, 1032-1037.
http://dx.doi.org/10.2337/dc10-1921 - 24. Delisle, H., Ntandou-Bouzitou, G., Agueh, V., Sodjinou, R. and Fayomi, B. (2011) Urbanisation, Nutrition Transition and Cardiometabolic Risk: The Benin Study. British Journal of Nutrition, 107, 1534-1544.
http://dx.doi.org/10.1017/S0007114511004661 - 25. Hendriks, M.E., Wit, F.W., Roos, M.T., Brewster, L.M., Akande, T.M., de Beer, I.H., et al. (2012) Hypertension in Sub-Saharan Africa: Cross-Sectional Surveys in Four Rural and Urban Communities. PLoS ONE, 7, e32638.
http://dx.doi.org/10.1371/journal.pone.0032638 - 26. World Health Organisation (2008) Final Report of the STEPS Survey in Benin, Cotonou.
- 27. World Health Organisation (2009) Global Health Risks: Mortality and Burden of Disease Attributable to Selected Major Risks. World Health Organization, Geneva.
- 28. Sodjinou, R., Agueh, V., Fayomi, B. and Delisle, H. (2008) Obesity and Cardio-Metabolic Risk Factors in Urban Adults of Benin: Relationship with Socio-Economic Status, Urbanisation, and Lifestyle Patterns. BMC Public Health, 8, 84-97.
http://dx.doi.org/10.1186/1471-2458-8-84 - 29. Lohman, T., Roche, A. and Martorel, R., Eds. (1988) Anthropometric Standardization Reference Manual. Human Kinetics Publishers, Champaign.
- 30. McAlister, F.A., Zarnke, K.B., Campbell, N.R., Feldman, R.D., Levine, M., Mahon, J., et al. (2002) The 2001 Canadian Recommendations for the Management of Hypertension: Part Two—Therapy. Canadian Journal of Cardiology, 18, 625-641.
- 31. World Health Organization (1999) The Metabolic Syndrome. In: Definition, Diagnosis and Classification of Diabetes Mellitus and Its Complications. Part 1: Diagnosis and Classification of Diabetes Mellitus. Experts Report, World Health Organization, Geneva.
- 32. Youden, W.J. (1950) Index for Rating Diagnostic Tests. Cancer, 3, 32-35.
http://dx.doi.org/10.1002/1097-0142(1950)3:1<32::AID-CNCR2820030106>3.0.CO;2-3 - 33. Sossa, C., Delisle, H., Agueh, V., Sodjinou, R., Ntandou, G. and Makoutode, M. (2013) Lifestyle and Dietary Factors Associated with the Evolution of Cardiometabolic Risk Over Four Years in West-African Adults: The Benin Study. Journal of Obesity, 2013, Article ID: 298024.
http://dx.doi.org/10.1155/2013/298024 - 34. Fezeu, L., Balkau, B., Sobngwi, E., Kengne, A.P., Vol, S., Ducimetiere, P., et al. (2010) Waist Circumference and Obesity-Related Abnormalities in French and Cameroonian Adults: The Role of Urbanization and Ethnicity. International Journal of Obesity, 34, 446-453.
http://dx.doi.org/10.1038/ijo.2009.256 - 35. Kalk, W.J., Joffe, B.I. and Sumner, A.E. (2011) The Waist Circumference of Risk in Black South African Men Is Lower than in Men of European Ancestry. Metabolic Syndrome and Related Disorders, 9, 491-495.
http://dx.doi.org/10.1089/met.2011.0063 - 36. Prinsloo, J., Malan, L., de Ridder, J.H., Potgieter, J.C. and Steyn, H.S. (2011) Determining the Waist Circumference Cut Off Which Best Predicts the Metabolic Syndrome Components in Urban Africans: The SABPA Study. Experimental and Clinical Endocrinology and Diabetes, 119, 599-603.
http://dx.doi.org/10.1055/s-0031-1280801 - 37. Lemieux, S., Prud’homme, D., Bouchard, C., Tremblay, A. and Despres, J.P. (1993) Sex Differences in the Relation of Visceral Adipose Tissue Accumulation to Total Body Fatness. American Journal of Clinical Nutrition, 58, 463-467.
- 38. Fontbonne, A., Cournil, A., Cames, C., Mercier, S., Ndiaye Coly, A., Lacroux, A., et al. (2011) Anthropometric Characteristics and Cardiometabolic Risk Factors in a Sample of Urban-Dwelling Adults in Senegal. Diabetes & Metabolism, 37, 52-58.
http://dx.doi.org/10.1016/j.diabet.2010.07.008 - 39. Evangelista, O. and McLaughlin, M.A. (2009) Review of Cardiovascular Risk Factors in Women. Gender Medicine, 6, 17-36.
http://dx.doi.org/10.1016/j.genm.2009.02.004 - 40. Polk, D.M. and Naqvi, T.Z. (2005) Cardiovascular Disease in Women: Sex Differences in Presentation, Risk Factors, and Evaluation. Current Cardiology Reports, 7, 166-172.
http://dx.doi.org/10.1007/s11886-005-0072-9 - 41. Kwawukume, E.Y., Ghosh, T.S. and Wilson, J.B. (1993) Menopausal Age of Ghanaian Women. International Journal of Gynecology & Obstetrics, 40, 151-155.
http://dx.doi.org/10.1016/0020-7292(93)90376-8 - 42. Deurenberg, P., Yap, M. and van Staveren, W.A. (1998) Body Mass Index and Percent Body Fat: A Meta-Analysis among Different Ethnic Groups. International Journal of Obesity, 22, 1164-1171.
http://dx.doi.org/10.1038/sj.ijo.0800741 - 43. Despres, J.P., Couillard, C., Gagnon, J., Bergeron, J., Leon, A.S., Rao, D.C., et al. (2000) Race, Visceral Adipose Tissue, Plasma Lipids, and Lipoprotein Lipase Activity in Men and Women: The Health, Risk Factors, Exercise Training, and Genetics (HERITAGE) Family Study. Arteriosclerosis, Thrombosis, and Vascular Biology, 20, 1932-1938.
http://dx.doi.org/10.1161/01.ATV.20.8.1932 - 44. Desilets, M.C., Garrel, D., Couillard, C., Tremblay, A., Despres, J.P., Bouchard, C., et al. (2006) Ethnic Differences in Body Composition and Other Markers of Cardiovascular Disease Risk: Study in Matched Haitian and White Subjects from Quebec. Obesity, 14, 1019-1027.
http://dx.doi.org/10.1038/oby.2006.117 - 45. Lovejoy, J.C., Smith, S.R. and Rood, J.C. (2001) Comparison of Regional Fat Distribution and Health Risk Factors in Middle-Aged White and African American Women: The Healthy Transitions Study. Obesity Research, 9, 10-16.
http://dx.doi.org/10.1038/oby.2001.2 - 46. Diaz, V.A., Mainous 3rd, A.G., Baker, R., Carnemolla, M. and Majeed, A. (2007) How Does Ethnicity Affect the Association between Obesity and Diabetes? Diabetic Medicine, 24, 1199-1204.
http://dx.doi.org/10.1111/j.1464-5491.2007.02244.x - 47. Evans, J., Micklesfield, L., Jennings, C., Levitt, N.S., Lambert, E.V., Olsson, T., et al. (2011) Diagnostic Ability of Obesity Measures to Identify Metabolic Risk Factors in South African Women. Metabolic Syndrome and Related Disorders, 9, 353-360.
http://dx.doi.org/10.1089/met.2011.0034
NOTES

*Corresponding author.