Open Journal of Civil Engineering
Vol.08 No.03(2018), Article ID:86103,21 pages
10.4236/ojce.2018.83021
Wind-Induced Failure Analysis and Retrofit of an Existing Steel Structure
Chrysanthos Maraveas1,2, Zacharias Fasoulakis1
1C. Maraveas and Associates P.C., Athens, Greece
2Fire Safety Unit, ArGenCo Deptment, University of Liege, Liege, Belgium

Copyright © 2018 by authors and Scientific Research Publishing Inc.
This work is licensed under the Creative Commons Attribution International License (CC BY 4.0).
http://creativecommons.org/licenses/by/4.0/


Received: June 22, 2018; Accepted: July 20, 2018; Published: July 23, 2018
ABSTRACT
The “Dimitrios Vikelas” athletic center in Ermoupolis of Syros, Greece, consists of two buildings. Building B has a steel superstructure that was constructed approximately 35 years ago. It was initially used as a boat shelter and no design calculations were made. It contains steel columns with varying cross section heights. The spans are bridged via trusses and I-beams. Significant geometrical inconsistencies are noted among the existing steel connections and failures have been recorded as a result of buckling in several beams and bracings during the service life of the athletic center. The current study presents an investigation performed in order to diagnose building structural problems and propose strengthening and intervention measures. The goal of this study was to improve the load-carrying capacity of the structure in order to comply with the current design codes. Moreover, enhancement of the dynamic properties of the strengthened structure was demonstrated using modal analyses. The structural behavior was determined in a more precise manner via non-linear wind time-history and incremental static analyses. The analytical results explain the development of failures in the existing structure.
Keywords:
Structural Assessment, Steel Structures, Wind, Buckling Phenomena, Strengthening

1. Introduction
The importance of accurate and timely structural estimation is widely accepted by the civil engineering community. Safety concerns make achieving this challenging when dealing with damaged structures of high importance that are currently in use. Two of the main goals of structural assessment of an existing structure are to predict adequate structural behavior (and therefore a satisfying reliability throughout its service life) and to optimize cost [1] .
Prior to the proposal of strengthening measures, the design Engineer should have cautiously investigated the influence of various inaccuracies of the structure on the total response. Learning from structural failures study offers a great insight on structural problems, combining both the theoretical and the construction point of view. Several examples of steel structural failures arising from wind load are referenced by Iwicki [2] , for instance out-of-plane buckling of roof trusses under upward wind loads. Generally, light steel structures (like roof trusses from angle sections) are more susceptible to wind loads compared to heavy weighted structures [3] .
To the best of the authors’ knowledge, most researchers thus far have addressed wind engineering theoretically [4] - [11] without coupling their analyses with case-study failure investigations. Some studies have used database-assisted or testing-assisted design methodologies [4] [5] [6] [7] , while wind loading simulations performed via probabilistic processes [8] [9] [10] , or reliability-based design approaches [10] [11] have drawn significant interest over the past few decades.
The field of forensic structural engineering has recently become attractive for many engineers. R.T. Ratay published an interesting overview [12] , in which the main aspects, difficulties, and future dynamics of the field were presented. For instance, structural failure is typically defined as non-conformance with design expectations that provide minimum performance requirements. However, it can also consist of a high risk of potential failure. There are typically no signs of deterioration in the latter case. Conclusions can be determined via structural analyses or/and field investigation and testing. Finally, the author highlights individual skills and judgement and even the temperament of the specialist-engineer, as being of major importance. On the other hand, in recent years risk assessment gain more attention when it comes to insurance matters. A study that discusses the property losses of buildings after strong wind events is demonstrated in [13] .
The present work addresses a case-study of a steel structure with damage significant enough to threaten its safety. Strengthening measures are thought to be necessary in order to protect human life. The paper also focuses on the precise response of the structure under realistic simulations of environmental actions, specifically wind.
Building B of the “Dimitrios Vikelas” athletic center (Figure 1) is located in Ermoupolis in Syros, Greece. It was constructed in the 1970s and is located 30 m from the open sea, where it was initially used as a boat shelter. Today, it is used as an indoor volleyball facility. Since various structural damage has been observed, Maraveas C. & Associates P.C. was hired to perform a structural assessment of the building and propose strengthening measures.
The overall plan area of the metal building is 1228 m2. It has a rectangular layout with dimensions of 33.0 m by 36.0 m between the column axes and a roof
 (a)
(a)
 (b)
(b)
Figure 1. Views of the (a) west and (b) east sides of the building.
height that varies from +8.24 m to +12.12 m from ground level. The structure consists of 7 parallel frames spaced at equal distances of 6.0 m. Each frame consists of two parts: the southernmost part includes 560/170 × 170 mm (H type) steel columns of varying web heights and an IPE270 frame rafter with a 7.21 m clear opening, while the northernmost part includes 690/190 × 190 mm (H type) steel columns of varying web heights. The 24.8 m opening in the latter part is bridged via trusses from double angle sections for the chords and single angle sections for the web (all connected through welded connections), as presented in
Figure 2. In the middle, the two parts are supported on IPE360 steel columns.
Vertical and horizontal bracings from the double angle sections are located at the end openings of the longest direction of the structure. Furthermore, insignificant secondary H-type beams are located between the columns of the frames while the trusses are connected in the longitudinal direction through I-type purlins and L sections at the top and bottom chords respectively. Finally, gable columns with sections ranging from IPE200 to IPE330 are used to support the large areas at the east and west sides of the building. S235 structural steel is used for all the existing steel members.
 (a)
(a)
 (b)
(b)
Figure 2. (a) Overall view and (b) structural details of the steel lattice roof.
Prior to the structural assessment of the bearing capacity of the building, a field-survey was performed in order to record existing structural damage (phase A of the Study). This is described in detail in Section 2.1.
2. Research on the Existing Structure
2.1. Survey and Theoretical Study
During the field-survey of the existing structure, a detailed record of superstructure damage was created after investigating the foundation. The most significant damage observed during the visual inspection and an overall view of the structural condition are presented below:
1) Extended buckling deformation of the Λ-type vertical bracings to the south (Figure 3(a)), as well as of the connecting beams between the IPE360 columns at +8.70 m (Figure 4).
2) Column-baseplate connections with major corrosion effects and insufficient stiffener thicknesses (Figure 5(a)).
3) Significant cracking effects at various locations along the perimeter of the brick wall. In particular, shear cracking expands to the concrete foundation wall on the north-east corner (Figure 5(b)).

 (a) (b)
Figure 3. Vertical Λ-type bracing on the southern section of the building: (a) the corroded portion with major second-order deformation and (b) the undamaged portion.
 (a)
(a) (b)
(b)
Figure 4. Steel elements with major second-order deformations.
 (a)
(a)
 (b)
(b)
Figure 5. (a) Column base with significant corrosion and (b) brick wall with a large crack.
4) Relaxed bolted connections at elements of major importance (i.e. vertical bracings), as well as relaxed anti-sag bars at the roof (Figure 6).
5) Major torsional deformation of vertical primary elements with insignificant torsional stiffness (Figure 7).
With regard to the imposed loads, the peak velocity wind pressure according to the Eurocode (EN 1991-1-4) was found to be, qp = 2.1 kN/m2 for a height of +12.0 m. Based on this, the total force along the longitudinal direction (west-east) is approximately 700 kN.
The commercial software Staad Pro [19] was used to perform the structural analysis and design of the existing structure. More details are given in the follow sub-section.
The results indicate the importance of this study: 610 out of 1324 beam elements do not satisfy the Eurocode requirements [14] [15] [16] [17] [18] . Of these, only 39 critical inadequacies occur due to seismic action, while the most unfavorable structural performance occurs as a result of wind. The resistance ratios are significantly exceeded in the bracings and the main chords of the lattice roof.
In addition to the main structure, Building B contains an independent steel structure used for seating that was constructed more recently than the main building. No failures were observed in this structure during either the survey or the theoretical study.
In summary, the study indicates that construction defects and accumulated damage from past events and further deterioration combine to produce the present structural condition. It is likely that the failures of different structural elements (brick walls, bracings, etc.) resulted from different events that took place in unknown sequence. Regardless, it is vitally important to examine the
 (a)
(a) (b)
(b)
Figure 6. Relaxed bolted connection.
 (a)
(a)
 (b)
(b)
Figure 7. Insufficient beam-column connection.
most likely sequences that could lead to failure before designing strengthening measures. Since the most severe main steel structure failures are caused by wind, more detailed numerical simulations are illustrated in Section 2.3.
2.2. Materials and Computational Methods
Fortunately, no large variety of the materials is obtained for our case-study. For the steel superstructure, as previously mentioned, S235 structural steel has been used whereas the concrete foundation and bottom slab meet the minimum concrete properties. The materials used in the existing structure, were properly defined through the numerical calculations.
For the needs of the current study several numerical procedures were implemented, each one depending on the purpose of the investigation. Thus, more or less, five different simulations were used, namely 1) linear static analysis, 2) linear dynamic (modal) analysis, 3) non-linear dynamic (time-history) analysis, 4) non-linear incremental static (pushover) analysis and 5) non-linear buckling analysis. For the aforementioned simulations three different commercial software were used, i.e. Staad Pro [19] (for cases 1 - 2), Sofistik [20] (for cases 3 - 4) and Abaqus [21] (for case 5). Each software was used for specific reasons, depending on the target design needs, which are described in detail below.
The first two (linear) methods are applied via Staad Pro, for the needs of the design per the Eurocodes. The structure was simulated as a 3D model with beam elements for the beams/columns and truss elements for bracings and trusses, while proper moment releases were introduced where necessary. Furthermore, the materials have linear (elastic) properties (elastic modulus equal to 210 GPa). The wind and snow loads are transferred to the main structure through the purlins and side rails, towards an exact simulation of the geometry.
To perform the transient time-history analysis, random wind histories were generated based on the Karman wind spectrum [22] using the “sofiload” module of the commercial software Sofistik [20] . The spatial coherence of fluctuating wind fields were taken into account. The non-linear material properties of S235 structural steel were simulated for critical members such as the vertical bracings along the Y direction. In particular, the stiffness and resistance in compression or tension are estimated separately for each member, whereas the stiffness in shear and bending are negligible compared to the axial one.
An incremental non-linear static analysis (pushover) was performed in order to clarify the total bearing capacity of the structure. The material properties defined for the time-history analysis were applied alongside the displacement shape vector from the first step of the time-history analysis instead of using a fundamental eigenmode of the structure. The target lateral forces were defined according to the EN 1991-1-4 wind load pattern.
After the response of the damaged vertical bracing to the 10 min wind time-history analysis was captured, the buckling capacity was estimated in a more precise manner via a detailed finite element simulation. For this reason, a double L79 × 79 × 7 cross-section was simulated in Abaqus [21] using the proper material model (fy/fu = 235/360 MPa and 0.20 ultimate strain) and connected back-to-back through packing plates, as was noted in-situ. The effects of non-linear geometry were also taken into account during the displacement-based incremental analysis (via the Static General module).
2.3. Specialized Numerical Simulations
Wind loads are characterized by randomness in both time and space. A close examination allows one to observe that wind records consist of a mean-value plus random wind speed fluctuations. Furthermore, a short wind gust may trigger a considerable dynamic response, for which a deterministic view of the design code cannot provide an accurate prediction. For these reasons, structural engineers should address wind carefully, for instance by implementing dynamic analyses when necessary. In the current work, the existing second-order deformations from the case-study are thoroughly investigated via the wind time-history and non-linear buckling analyses presented in the next sub-sections.
Wind Time-History Analysis
The wind profile corresponds to that of a coastal area with a mean wind velocity of approximately 33 m/s operating for 10 min (similar to the wind profile defined in EN 1991-1-4). The time-histories for structural elements at heights of 5 m along the long and transverse directions of the structure are depicted in Figure 8. These artificial random records―which are created through Sofistik [20] ―facilitate the design process against wind loading to a great extent, since transient dynamic analyses allow the determination of the structural response including any material or geometrical non-linear effect.
In this analysis, the wind load in the longitudinal direction is simulated only for the Y axis, since major building damage has been observed in this direction. The vertical component of the wind load is not considered in the present study. In Figure 9, one can observe a 3D view of the existing simulated structure, as well as the element numbering for 4 selected bracings.
3. Results and Discussion on the Investigation of the Existing Structure
An interesting clue appears to significantly affect the structural response with regard to excessive second-order deformation of the south-west lower bracing (beam No. 10114 presented in Figure 3(a)). To this end, the stiffness and capacity reserves of the damaged member are obtained via finite element buckling analyses using Abaqus [21] . The results are presented in the next sub-section.
The results of the time-history dynamic analyses are shown for the selected beam elements in terms of axial force in Figure 10(a) and Figure 10(b). The two figures respectively address conditions that exclude and include geometrical imperfection from the buckled L-section. The latter case can be referred as the “imperfect” one. A thickness reduction of 1.0 mm due to corrosion is also included in this case. One can clearly observe relief of the damaged and tensile (member No. 10113) members. In contrast, the east pair of bracings displays additional axial force, which reveals a more unfavorable design status (member
 (a)
(a) (b)
(b)
Figure 8. Velocity time-history samples for the a) longitudinal and b) transversal wind directions.
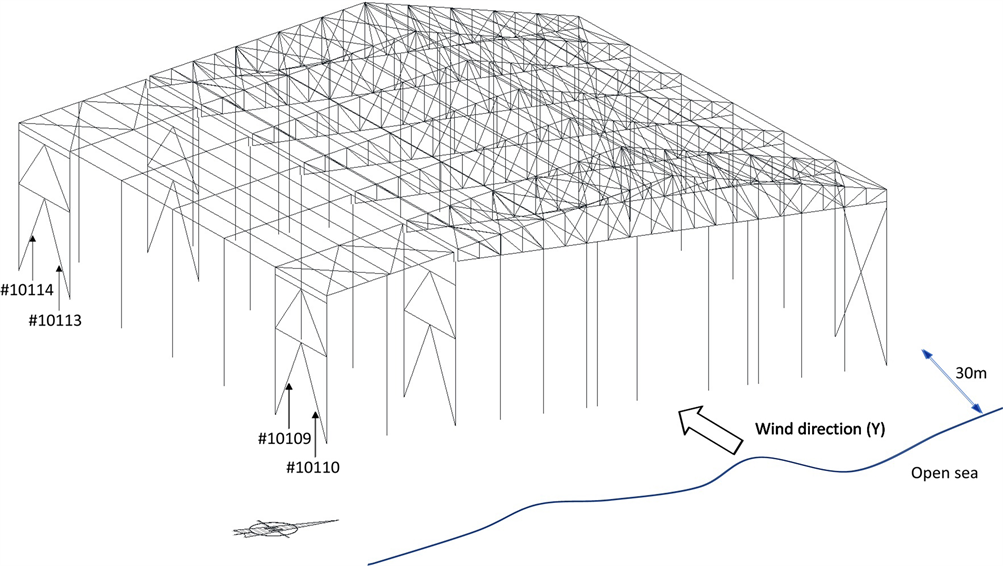
Figure 9. Overall configuration of the existing structure.
Nos. 10109, 10110). The axial forces are differentiated by approximately ± 45%.
The axial force and dynamic histories, as well as the axial displacement history determined via the dynamic analysis, are shown in Figure 11. The maximum recorded load is 71.0 kN, which corresponds to an axial shortening of 31.6 mm. The shortening itself ranges from 4.0 to 36.7 mm. Considering only the axial load produces a surprising outcome since the maximum developed compressive force does not exceed the buckling capacity of the corroded bracing. However, a design Engineer should cautiously consider the most critical qualities, which are the motive for a displacement-based analysis.
3.1. Vertical Bracing Buckling Capacity
The buckling response―shown in Figure 12―was identified after importing the exact function of the axial displacement from the wind history analysis into Abaqus as boundary condition amplitude. The maximum buckling capacity attained is greater than 81 kN, which is larger than 71 kN. Nevertheless, buckling phenomena have occurred due to significant shortening of the beam. In addition, the axial stiffness of the buckled beam is confirmed using the post-buckling curves. In particular, the stiffness (which is detected at the onset of a new compression region) is nearly equal for all the subsequent loading paths after the first buckling occurrence (axial displacement of 3 mm).
3.2. Capacity Curves
The capacity curves shown in Figure 13(a) capture the total response of the structure, while the dashed line defines the minimum requirement that the structure should have met. After considering imperfections, i.e. excessive deformation of the damaged bracing, the bearing capacity is only 58% of that of a perfect sample. Nevertheless, the latter capacity does not satisfy the Eurocode requirement in terms of total base shear force. Furthermore, the axial load-displacement curves of the major vertical bracings are compared in Figure 13(b), while the selected

Figure 10. Axial load histories for Λ-type vertical bracings with (a) perfect and (b) imperfect structures.

Figure 11. Axial load and displacement response of element No. 10114.

Figure 12. Response of the corroded buckled bracing, as determined using Abaqus.

Figure 13. Comparison of the (a) capacity curves and (b) axial load-displacement paths of vertical bracings within perfect and imperfect structures.
imperfection is neglected during the pushover analysis. The double equal angle cross-sections L90 × 8, L80 × 8, and L90 × 9 correspond to the existing bracings of the north, south, and Section 1.1 views, respectively.
4. Retrofit Proposal
The most important structural interventions proposed as a result of the study are outlined below. Points a through c refer to members from angle cross-sections.
1) Addition of horizontal X-bracings near the roof ridge (roof plan view in Figure 15).
2) Addition of vertical bracings between the roof trusses for reasons of lateral restraint, as well as between the south 560/170 × 170 and IPE360 columns (for east and west side-views) for serviceability limit reasons.
3) Replacement of insufficient vertical bracings using the same or different configurations (examples from the south and north sides of the building as well as Section 1.1 can be observed in Figure 15).
4) Replacement of distorted members such as H-type connecting beams in Section 1.1 of Figure 15.
5) Replacement of vertical elements at the end of the IPE360 column (Figure 7), which is predicted to provide a stiffer beam-column connection.
6) Strengthening the cross-sections of the main chords of the lattice roof using thin-walled hollow sections; strengthening of specific truss members by adding second angle sections (Sections 2.2 and 3.3 in Figure 15 and details in Figure 16(b)).
7) Replacement of purlins and a denser arrangement or replacement of side rails.
Figure 14 shows the type and extent of interventions recommended for the main steel structure. Replacement and strengthening of the truss roof are illustrated in blue, while red is used to indicate member additions. The same conventional symbolism has been adopted for Figure 15. Unfortunately, some serviceability constraints (equipment, etc.) prevent the use of a more orthodox X-bracing configuration in the east and west views (outer red vertical bracings in Figure 14).

Figure 14. Three-dimensional view of the structural modifications (blue for replacement or strengthening, red for member addition).

Figure 15. Schematic view of the strengthened structure (green for existing bracings, red for proposed modifications, and blue for strengthening).
Further minor but important restoration techniques should be implemented. They include tightening of bolts and anti-sag bars, surface treatment for corroded members that are not to be replaced (e.g. surfaces of columns near the base). Special treatment for foundation inadequacies is required as well. In particular, portions of the foundation beneath the gable columns (at both the east and west parts of the building) should be strengthened so that they can receive bending moments. The latter recommendation is illustrated in Figure 16(a), where H-type steel beams are used as provisional column supports for an adequate length in both directions.
A detailed schedule of strengthening of the truss chords (point “f” of the strengthening proposals) is attached in Figure 16(b). The new hollow sections will be properly welded under the existing angle members since the purlins and the web members used for the upper and lower chords of the truss, respectively, preclude any other recommendation. Finally, it is important to maintain a light-weight design in order to optimize the bearing capacity of the lattice structure.
5. Structural Performance of the Strengthened Structure
The analytical results and the structural response of the strengthened structure

Figure 16. Schematic view of strengthening details for (a) the foundation and (b) the truss chords.
suggest that all design requirements are satisfied for cases of ultimate and serviceability states. In particular, the maximum vertical displacement of the roof is limited to 37 mm (compared to 69 mm in the existing structure) for serviceability limit state combinations caused by wind. With regard to horizontal displacements, the maximum drift of the structure under seismic excitation is limited to 30 mm, rather than the 75 mm experienced before strengthening.
Modal analyses have been performed to compare the existing and strengthened structures. The results shown in Figure 17 demonstrate clear improvements to the dynamic characteristics of the structure. In particular, the mass participation is increased to 62% and 84% in the long and transverse directions (along the Z- and X-axes, respectively), compared to 31% in the unstiffened structure. The corresponding periods decrease from 1.07 s to 0.82 s and from 0.74 s to 0.43 s along the Z and X directions, respectively, after the proposed retrofit. The aforementioned mode shapes for the long and transverse directions are compared in Figure 18(a) & Figure 18(b) and Figure 18(c) & Figure 18(d), respectively. Additionally, Figure 18(a) & Figure 18(c) and Figure 18(b) & Figure 18(d) correspond to the existing and strengthened structure respectively.

Figure 17. Comparison of the dynamic characteristics of the existing (black) and strengthened (red) structure (solid and dashed lines for the X- and Z-directions respectively).
For the sake of completeness, the capacity curve of the proposed modified structure was established and compared to that of the existing structure. The procedure presented in Section 2.3.1, is repeated in Sofistik using the enhanced properties of the new and strengthened members. Figure 19 shows the new curve that indicates a total base shear force enlargement from 571 kN to 1571 kN. For the case of the strengthened structure (black colored line) it’s easy to notice an inflection point which is experienced at the first (predefined) incremental step of the chosen load pattern, beyond which the stiffness is further enhanced.

Figure 18. Schematic view of some characteristic mode shapes of the existing (upper) and strengthened (lower) structures.

Figure 19. Comparison of the capacity curves of the existing and strengthened structures.
Cost Estimation of the Strengthening Proposal
Finally, it must be noted that 14.9 tn of S275 structural steel is required for strengthening of the main structure, while 22.8 tn of the same material is required for the purlins and side-rails. The indicative cost for the structural steel (excluding purlins and side-rails) is around 41,000 € (31.5 € /m2 of the plan view) while the total repair cost, which includes fees, taxes and unpredictable quantities, approaches 290,000 € (223.0 € /m2 of the plan view). The difference between these values indicates that the major structural interventions are a relatively small part of the overall proposal.
6. Conclusions
This study of the “Dimitrios Vikelas” athletic center located in Ermoupoulis of Syros, Greece highlights a structural assessment and strengthening proposal for an existing steel structure with major damage. During the project, detailed records and simulations were conducted in order to explain the structural deficiencies (such as excessive deformation, cracking, overstressing, etc.) that hinder safety of the building. The results revealed crucial inadequacies as well as the need to strengthen (with a more accurate way) both the steel superstructure and the concrete foundation. Development of existing damage can be attributed to environmental factors such as corrosion and wind. No sufficient understanding of the sequence of failure events is available, since changes made many years ago were not accompanied by further information.
Thus, specialized non-linear analyses were carried out in order to achieve more accurate structural behavior. Non-linear time-history analyses―conducted using artificial wind histories―and non-linear incremental static analyses with consideration of second-order effects illuminated the route from pathology and assessment to final treatment. A strengthening proposal was developed to make the new structure comply with the Eurocode regulations. A comparison of the existing and improved structures that highlights the dynamic response enhancement is attached. The increased bearing capacity is clearly illustrated via capacity curves obtained from the non-linear static (pushover) analyses, which highlight the margins of safety that can be expected throughout the remaining life of the strengthened structure.
In order to extend the investigation, a risk assessment may be proposed as a future work, by implementing a large number of stochastic events. The latter procedure enables the realistic reproduction of failure evolution throughout the lifetime of the structure. Towards that direction, any significant record of wind activity will be valuable. The results can clearly quantify for instance the annual probability of exceeding loss levels in a given year [13] .
Cite this paper
Maraveas, C. and Fasoulakis, Z. (2018) Wind-Induced Failure Analysis and Retrofit of an Existing Steel Structure. Open Journal of Civil Engineering, 8, 271-291. https://doi.org/10.4236/ojce.2018.83021
References
- 1. SAMCO (2006) Guideline for the Assessment of Existing Structures. Final Report.
- 2. Iwicki, P. (2010) Selected Problems of Stability of Steel Structures. Monografie 105, Wydawnictwo Politechniki Gdańskiej, Gdańsk.
- 3. Yang, N. and Bai, F. (2017) Damage Analysis and Evaluation of Light Steel Structures Exposed to Wind Hazards. Applied Sciences, 239, 1-10.
- 4. Duthinh, D., Main, J.A., Wright, A.P. and Simiu, E. (2008) Low-Rise Steel Structures under Directional Winds: Mean Recurrence Interval of Failure. Journal of Structural Engineering, 134, 1383-1388. https://doi.org/10.1061/(ASCE)0733-9445(2008)134:8(1383)
- 5. St. Pierre, L.M., Kopp, G.A., Surry, D. and Ho, T.C.E. (2005) The UWO Contribution to the NIST Aerodynamic Database for Wind Loads on Low Buildings: Part 2. Comparison of Data with Wind Load Provisions. Journal of Wind Engineering and Industrial Aerodynamics, 93, 31-59. https://doi.org/10.1016/j.jweia.2004.07.007
- 6. Kopp, G.A., Morrison, M.J., Kordi, B. and Miller, C. (2011) A Method to Assess Peak Storm Wind Speeds Using Detailed Damage Surveys. Engineering Structures, 33, 90-98. https://doi.org/10.1016/j.engstruct.2010.09.021
- 7. Sadek, F. and Simiu, E. (2002) Peak Non-Gaussian Wind Effects for Database-Assisted Low-Rise Building Design. Journal of Engineering Mechanics, 128, 530-539. https://doi.org/10.1061/(ASCE)0733-9399(2002)128:5(530)
- 8. Kumar, D.K. and Stathopoulos, T. (2000) Wind Loads on Low Building Roofs: A Stochastic Perspective. Journal of Structural Engineering, 126, 994-956. https://doi.org/10.1061/(ASCE)0733-9445(2000)126:8(944)
- 9. Retief, J.V., Barnardo-Viljoen, C. and Holicky, M. (2013) Probabilistic Models for Design of Structures against Wind Loads. Proceedings of the 5th SEMC International Conference, Cape Town, 2-4 September 2013.
- 10. Ham, H.J., Lee, S. and Kim, H.-S. (2009) Development of Typhoon Fragility for Industrial Buildings. Proceedings of the 7th APCWE, Taipei, 8-12 November 2009.
- 11. Simiu, E., et al. (2003) Achieving Safer and More Economical Buildings through Database-Assisted, Reliability-Based Design for Wind. Journal of Wind Engineering and Industrial Aerodynamics, 91, 1587-1611. https://doi.org/10.1016/j.jweia.2003.09.017
- 12. Ratay, R.T. (2017) An Overview of Forensic Structural Engineering. Structural Engineering International, 27, 338-343. https://doi.org/10.2749/101686617X14881932437176
- 13. Khanduri, A.C. and Morrow, G.C. (2003) Vulnerability of Buildings to Windstorms and Insurance Loss Estimation. Journal of Wind Engineering and Industrial Aerodynamics, 91, 455-467. https://doi.org/10.1016/S0167-6105(02)00408-7
- 14. EN 1990 (2002) Eurocode—Basis of Structural Design. CEN, Brussels.
- 15. EN 1991 (2002) Eurocode 1—Actions on Structures. CEN, Brussels.
- 16. EN 1993-1-1 (2005) Eurocode 3—Design of Steel Structures—Part 1-1: General Rules and Rules for Buildings. CEN, Brus-sels.
- 17. EN 1998-1-1 (2003) Eurocode 8—Design of Structures for Earthquake Resistance—Part 1: General Rules, Seismic Actions and Rules for Buildings. CEN, Brussels.
- 18. BS 5950-1 (1990) Structural Use of Steelwork in Building. Part 1. Code of Practice for Design in Simple and Continuous Construction: Hot Rolled Sections, BSI.
- 19. STAAD.Pro V8i (2012) Technical Reference Manual, Bentley Sustaining Infrastructure.
- 20. SOFiSTiK (2016) Software Manuals. SOFiSTiK AG. http://www.sofistik.com
- 21. Abaqus (2015) V. 6.14, Analysis User’s Manual. DS Simulia Corp., Online Documentation.
- 22. von Karman, T. (1948) Progress in the Statistical Theory of Turbulence. Proceedings of the National Academy of Sciences of the USA, 34, 530-539. https://doi.org/10.1073/pnas.34.11.530