Open Journal of Civil Engineering
Vol.05 No.03(2015), Article ID:58133,11 pages
10.4236/ojce.2015.53027
Easy-to-Use Look-Up Hydrologic Design Charts of a Soak-Away Rain Garden in Singapore
Sivarajah Mylevaganam*, Ting Fong May Chui, Jiangyong Hu
Department of Civil and Environmental Engineering, National University of Singapore, Singapore
Email: *sivaloga@hushmail.com
Copyright © 2015 by authors and Scientific Research Publishing Inc.
This work is licensed under the Creative Commons Attribution International License (CC BY).
http://creativecommons.org/licenses/by/4.0/


Received 10 April 2015; accepted 18 July 2015; published 21 July 2015
ABSTRACT
As catchments become urbanized due to population growth the impervious surfaces created by buildings and pavements in the expense of permeable soil, depressions, and vegetation cause rainwater to flow rapidly over the landscape. To mitigate the adverse impact of urbanization such as increased flooding and depleted groundwater recharge, around the world, several best management practices, in other words, green infrastructures have been practised, and soak-away rain garden is one of them. However, to have a rapid assessment of soak-away rain gardens on a range of potential hydrologic conditions (e.g., size of the soak-away rain garden, saturated hydraulic conductivity of the in-situ soil, and saturated hydraulic conductivity of the filter media), hydrologic design guidelines or design charts of soak-away rain gardens that are specific for local conditions are not currently available for many regions including Singapore. Thus, in this paper, with a design hyetograph of 3-month average rainfall intensities of Singapore, hydrologic design charts, especially, design charts on overflow volume (as a % of total runoff volume) of soak-away rain gardens are established for a range of potential hydrologic conditions by developing a mathematical model based on Richard’s equation using COMSOL Multiphysics, a finite element analysis and solver software package for various physics and engineering applications. These easy-to-use look- up hydrologic design charts will be of great utility for local managers in the design of soak-away rain gardens.
Keywords:
COMSOL Multiphysics, Soak-Away Rain Garden, Hydrologic Design Charts, Overflow Volume

1. Introduction
Around the world, as populations multiply catchments become urbanized with the changes in land use. However, the way water flows in a catchment is extensively altered by the process of urbanization. In urban catchments, the impervious surfaces created by buildings and pavements in the expense of permeable soil, depressions, and vegetation cause rainwater to flow rapidly over the landscape, rather than naturally infiltrating into the soil. This has arguably caused many issues such as reduction in groundwater recharge, long-term lowering of groundwater tables, and most importantly increased flooding that endangers existing infrastructures [1] [2] . To maintain or replicate predevelopment hydrologic regime, around the world, several nature-based best management practices, in other words, green infrastructures have been used in a way that protect the natural hydrology of the catchment and are more beneficial to the environment [1] -[5] . Soak-away rain garden is one of those best management practices or green infrastructures.
Soak-away rain gardens, shallow, landscaped depressions commonly located in parking lots or within small pockets in residential areas, receive stormwater runoff, attenuate surface water and enable it to percolate into the surrounding ground. Though soak-away rain gardens are becoming important stormwater best management practices, the fundamental understandings of these structures are still at an undeveloped stage mainly due to the fact that these structures are exposed to highly dynamic hydrological conditions [1] [2] . Consequently, detailed hydrologic performance information and related hydrologic design guidelines of soak-away rain gardens are not currently available for many regions including Singapore. Hydrologic design guidelines of soak-away rain gardens are often represented as hydrologic relationships or design charts. One of the most important hydrologic relationships or design charts is the relationship between overflow volume as a % of total runoff volume and hydrologic conditions, such as size of the soak-away rain garden, saturated hydraulic conductivity of the in-situ soil, and saturated hydraulic conductivity of the filter media, which can assist local managers to mitigate the flooding that endangers existing infrastructures and the downstream users. Moreover, by the use of such design charts, rapid assessment to test multiple designs under different scenarios is possible for a range of potential hydrologic conditions (e.g., size of the soak-away rain garden, saturated hydraulic conductivity of the in-situ soil, and saturated hydraulic conductivity of the filter media). There is, therefore, a great utility in providing easy-to- use look-up design charts. However, to assist local water managers, these design charts that are specific for local conditions need to be established. To establish such design charts, a comprehensive mathematical modeling work independent of field data is required as in practice it is not feasible to measure a desired hydrological variable for every possible hydrological condition. Therefore, it is the objective of this study to establish such hydrologic design charts (i.e., design charts on overflow volume as a % of total runoff volume) by developing a mathematical model based on Richard’s equation [6] -[8] using COMSOL Multiphysics [7] [8] .
2. COMSOL Multiphysics
COMSOL Multiphysics is a powerful interactive environment for modeling and solving partial differential equations in scientific and engineering problems. The software provides a powerful integrated desktop environment with a Model Builder where the users get full overview of the model and access to all functionality. With COMSOL Multiphysics the users can easily extend models for one type of physics into multiphysics models that solve coupled physics phenomena. COMSOL Multiphysics also allows the users to perform various types of studies such as stationary and time-dependent studies. When solving the models, COMSOL Multiphysics uses the proven finite element method. The software runs the finite element analysis together with adaptive meshing and error control using a variety of numerical solvers. A more detailed description of the mathematical and numerical foundation is in the COMSOL Multiphysics Reference Guide [8] .
3. Methodology and Discussion of Results
This section of the paper is divided into three sub-sections. The sub-Section 3.1 describes the 3D model development in COMSOL Multiphysics, the sub-Section 3.2 briefly summarizes the hyetograph to represent the 3- month average rainfall intensities (ARIs), which was used to simulate the developed model, and the sub-Section 3.3 discusses the results.
3.1. Model Development in COMSOL Multiphysics
Modeling of a soak-away rain garden involves flow in variably saturated porous media. Flow in variably saturated porous media is modeled using the Earth Sciences Module (Subsurface Flow Module) of COMSOL Multiphysics. A review of COMSOL’s Earth Sciences Module for simulating flow in variably saturated porous media can be found in [9] . Using the Earth Sciences Module of COMSOL, to develop a model in variably saturated porous media, among other things, it is required to define the model geometry, the mathematical representation of the physical processes of interest, the initial/boundary conditions, and the water balance of the soak-away rain garden.
3.1.1. Model Geometry Using COMSOL Multiphysics
Figure 1 shows the 3D geometry of a soak-away rain garden that allows stormwater runoff to ex-filtrate into the surrounding soil. For demonstration purpose, a soak-away rain garden with a width of 5 m and a height of 1.0 m is chosen. The length of the soak-away rain garden is 5 m. The shape of the soak-away rain garden is assumed to be of rectangular/square shape. The height of the filter media, the primary soil layer, is 0.6 m. The height of the ponding space, which is defined above the filter media, is limited to 0.2 m. The width and length of the area of the influence is 15 m.
Using COMSOL Multiphysics, the 3D geometry of the soak-away rain garden of the above mentioned dimensions was formed by first creating a block feature, whose block name is “blk1”, to represent the outer dimensions. The width and the length of this block were set to “15” and the height was set to “5”. Similar to block feature, “blk1”, another block feature, whose block name is “blk2”, was created. The width and the length of this block were set to “5” and the height was set to “1”, but the block position was set to (5, 5, 4) in (X, Y, Z) direction. To represent the in-situ soil, the block feature, “blk2”, was subtracted from the block feature, “blk1”, by creating a Difference feature (“dif1”), a Boolean operation with the “input” properties set to “blk1” and “blk2”. To represent the filter media, similar to block features “blk1” and “blk2”, another block feature, whose block name is “blk3”, was created. The width and the length of this block were set to “5” and the height was set to “0.6”, but the block position was set to (5, 5, 4) in (X, Y, Z) direction. To represent the soak-away rain garden, the block feature “blk3” was unioned with the Difference feature (“dif1”), by creating a Union feature (“uni1”), a Boolean operation with the “input” properties set to “blk3” and “diff1”.
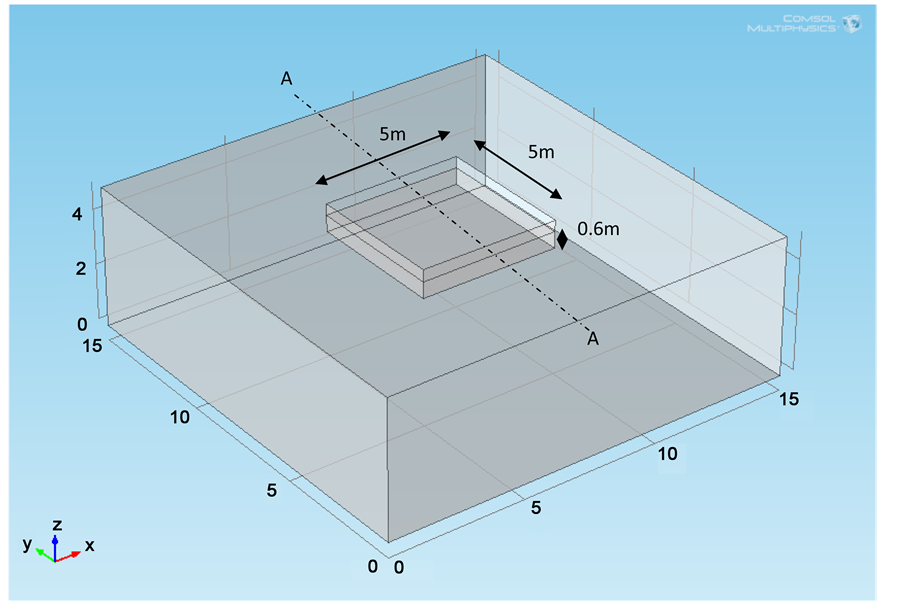
Figure 1. Graphical representation of a soak-away rain garden in COMSOL Multiphysics.
3.1.2. Representation of the Physical Processes Using COMSOL Multiphysics
Richards’ equation models flow in variably saturated porous media. Many efforts to simplify and improve the modeling of flow in variably saturated media have produced a number of variants of Richards’ equation. In this paper, the form of the Richards’ equation adopted in COMSOL Multiphysics is used [7] [8] . The Richards’ equation was applied for both the in-situ soil and the filter media of the soak-away rain garden. The adopted equation is presented in Equation (1).
 (1)
(1)
where the pressure, p, is the dependent variable. In this equation, Cm represents the specific moisture capacity, Se denotes the effective saturation, S is the storage coefficient, κs gives the hydraulic permeability, μ is the fluid dynamic viscosity, kr denotes the relative permeability, ρ is the fluid density, g is acceleration of gravity, D represents the elevation, and Qm is the fluid source (positive) or sink (negative). The fluid velocity across the faces of an infinitesimally small surface is given by Equation (2).
 (2)
(2)
where u is the flux vector. The porous medium consists of pore space, fluids, and solids, but only the liquids move. The Equation (2) describes the flux as distributed across a representative surface. To characterize the fluid velocity in the pores, COMSOL Multiphysics also divides u by the volume liquid fraction, θs. This interstitial, pore or average linear velocity is ua = u/θs [7] [8] .
3.1.3. Initial/Boundary Conditions Using COMSOL Multiphysics
To solve flow in variably saturated porous media, it is necessary that appropriate boundary conditions are specified. From a mathematical standpoint, the application of boundary conditions ensures that the solutions to the problems are self-consistent. In this study, the following boundary conditions are identified as appropriate. As shown in Figure 2, which represents the frontal view of cut-plane (YZ Plane) A-A of Figure 1, the top surface of the rain garden is a rainfall-runoff boundary, a non-steady-state flow condition typical of urban stormwater runoff. The external side boundaries do not allow water to flow in or out of the area of influence, implying that the chosen area is large enough that it does not affect the flow performance around the rain garden. The bottom boundary of the area of influence is specified by a hydraulic head corresponding to an assumed groundwater table level. When water starts to pond, the boundary condition at the top surface of the rain garden becomes a hydraulic boundary. Therefore, there is a need to be able to switch the top surface of the rain garden from flow to hydraulic head. The switching was done using COMSOL Java API, a Java-based interface [7] [8] . The initial condition was set to hydrostatic condition. In other words, above groundwater table, the suction is equal to the distance above groundwater table.
3.1.4. Water Balance of the Soak-Away Rain Garden Using COMSOL Multiphysics
Water Balance of the soak-away rain garden was carried out using a continuity equation whose components are

Figure 2. Boundary conditions of a soak-away rain garden in COMSOL Multiphysics.
stormwater runoff, overflow (which is the excess of the ponding space), change of soil moisture within the filter media, change of water storage within the ponding space, vertical ex-filtration, and horizontal ex-filtration. At a given time, horizontal ex-filtration and vertical ex-filtration were computed by integrating the model computed velocity along the four side walls and the bottom surface of the soak-away rain garden, respectively.
3.2. Development of Design Hyetograph
The design of soak-away rain gardens involves water quality. Thus, the establishment of a design hyetograph for the design of soak-away rain gardens, specifically, requires data on intensity-duration-frequency (IDF) values for relatively frequent storms such as 3-Month ARIs that carry up to 90% of the total load on annual basis. As underscored in the literature, to date, there are few methods available for the establishment of design hyetographs using IDF data [10] . In this paper, the alternating block method [10] , which represents an event of a selected return period both for the selected duration of the event and for any period within this selected duration, is used in developing a design hyetograph from an IDF relationship of Singapore. A storm duration of 720 min was considered. Considering an event of 720 min of the 3-Month ARIs, a design hyetograph for 3-Month ARIs built-up using this method represents a 3-Month ARI event both for the 720 min total duration and for any period (i.e., 5 min, 10 min, 15 min, 30 min, 60 min,…, 360 min) within this duration centered on the maximum block [10] . The design hyetograph produced by this method specifies the rainfall depth occurring in n successive time intervals of duration Δt over a total duration of 720 min = nΔt. Duration Δt is often determined by the finest resolution of the hydrological model that is used to generate the design hydrograph, the time distribution of discharge. The hyetograph to represent a 3-Month ARI event of 720 min duration is shown in Figure 3 for a duration (Δt) of 6 min which is the finest resolution of MUSIC (Model for urban stormwater improvement conceptualization) model which was used to generate the hydrographs for different urbanized (impervious percentage of 90% was assumed) catchment sizes varied from 100 to 250 m2.

Figure 3. Design hyetograph for 3-month ARIs.
3.3. Discussion of Results
In this study, the simulation was carried out for different values of saturated hydraulic conductivity of the in-situ soil, surface area of the soak-away rain garden (as a % of catchment area), saturated hydraulic conductivity of the filter media, and depth to groundwater table measured from bottom of the filter media. The saturated hydraulic conductivity of the in-situ soil was varied from 10 mm/hr to 50 mm/hr, typical range in Singapore. The surface area of the soak-away rain garden (as a % of catchment area) was varied from 6% to 15%. The width and the length of the soak-away rain garden were assumed to be of the same size. The saturated hydraulic conductivity of the filter media was varied from 100 mm/hr to 200 mm/hr, typical range in Singapore. The depth to groundwater table was varied from 0.5 m to 1.5 m. Having simulated the model for a range of potential hydrologic conditions (e.g., size of the soak-away rain garden, saturated hydraulic conductivity of the in-situ soil, and saturated hydraulic conductivity of the filter media), hydrologic relationships or design charts between overflow volume (as a % of total runoff volume) and the potential hydrologic conditions were established. In the following sections, the impacts of potential hydrologic conditions on design charts of overflow volume (as a % of total runoff volume) are discussed.
3.3.1. Impact of Surface Area of the Soak-Away Rain Garden
Figure 4 shows the graph of overflow volume versus the surface area of the soak-away rain garden (as a % of catchment area). The overflow volume is the total volume of water for the simulation period = 720 min that is in excess of ponding space and expressed as a % total runoff volume. For this graph, the saturated hydraulic conductivity of the filter media and the depth to groundwater table were set to 100 mm/hr and 0.5 m, respectively. The graph also shows the variation with saturated hydraulic conductivities of the in-situ soil. The saturated
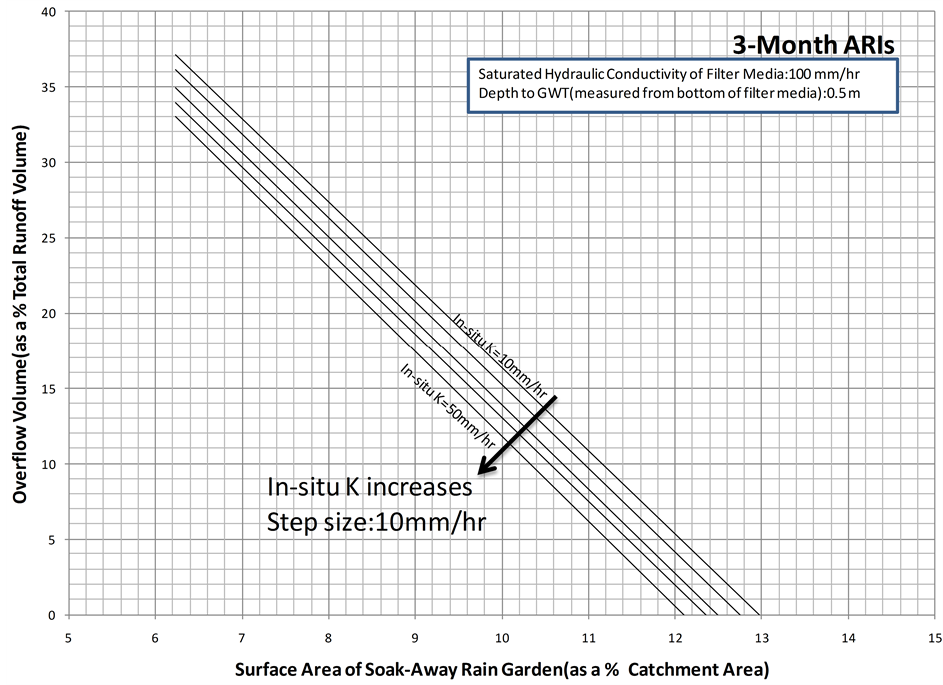
Figure 4. Overflow volume (as a % total runoff volume) for a depth to groundwater table of 0.5 m and a saturated hydraulic conductivity of the filter media of 100 mm/hr.
hydraulic conductivity of the in-situ soil varies from 10 mm/hr to 50 mm/hr. As can be observed from the graph, for a given saturated hydraulic conductivity of the filter media, depth to groundwater table, and saturated hydraulic conductivity of the in-situ soil, the overflow volume (as a % of total runoff volume) decreases as the surface area of the soak-away rain garden (as a % of catchment area) increases. This is owing to the fact that the ex-filtrated water, which is drained through bottom and side walls of the soak-away rain garden, is proportional to surface area of the soak-away rain garden. Thus, as the surface area of the soak-away rain garden increases it is expected to have more ex-filtrated water and thus less overflow volume (as a % of total runoff volume).
3.3.2. Impact of Saturated Hydraulic Conductivity of the In-situ Soil
As can be observed from Figure 4, for a given saturated hydraulic conductivity of the filter media, depth to groundwater table, and surface area of the soak-away rain garden (as a % of catchment area), the overflow volume (as a % of total runoff volume) decreases as the saturated hydraulic conductivity of the in-situ soil increases. The possible reason for this observation is that the ex-filtrated water, which is drained through bottom and side walls of the soak-away rain garden, increases as the saturated hydraulic conductivity of the in-situ soil increases. This is owing to the fact that the ability of the soil fluid to flow through the soil matrix system increases as the saturated hydraulic conductivity of the in-situ increases. Thus, as the saturated hydraulic conductivity of the in-situ soil increases it is expected to have more ex-filtrated water and thus less overflow volume (as a % of total runoff volume).
3.3.3. Impact of Depth to Groundwater Table
To understand the impact of depth to groundwater table on overflow volume (as a % of total runoff volume), as shown in Figure 5 and Figure 6, graphs of overflow volume (as a % of total runoff volume) versus the surface area of the soak-away rain garden (as a % of catchment area) were plotted. The depth to groundwater table was
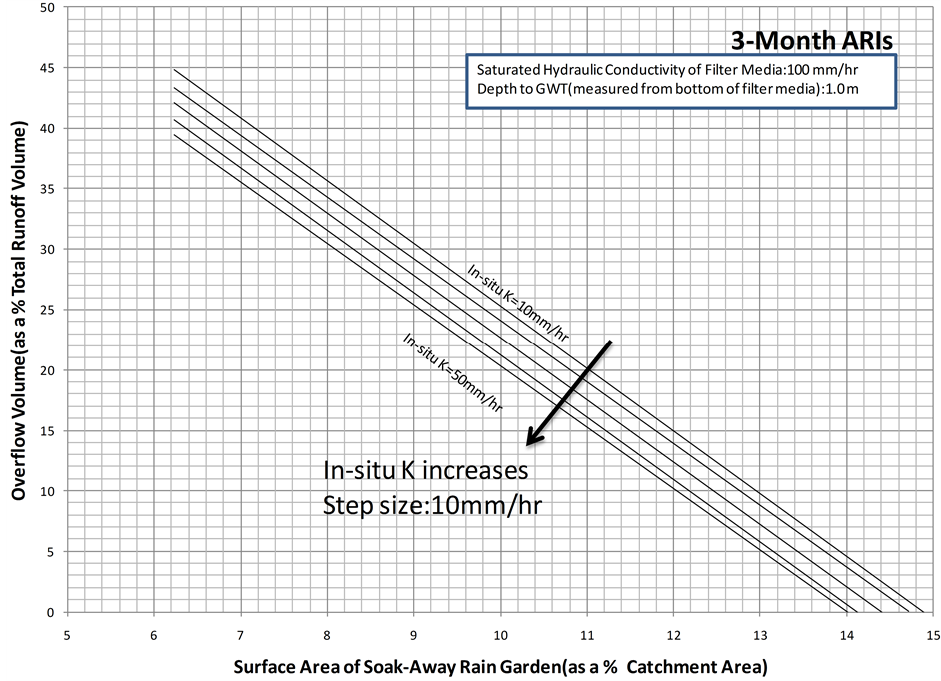
Figure 5. Overflow volume (as a % total runoff volume) for a depth to groundwater table of 1.0 m and a saturated hydraulic conductivity of the filter media of 100 mm/hr.
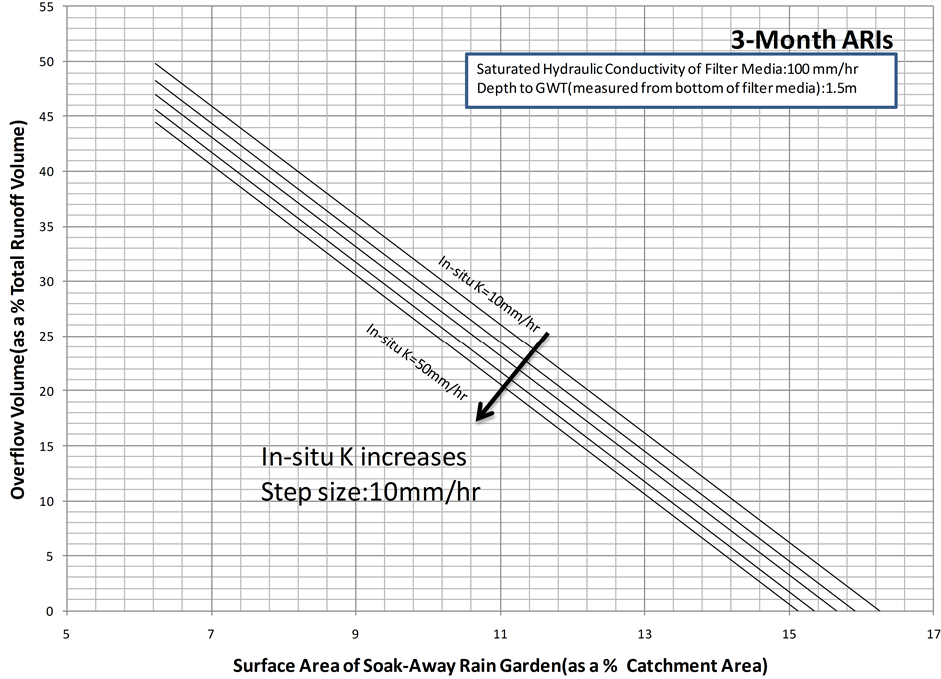
Figure 6. Overflow volume (as a % total runoff volume) for a depth to groundwater table of 1.5 m and a saturated hydraulic conductivity of the filter media of 100 mm/hr.
measured from bottom of the filter media. For these graphs, as previously, the saturated hydraulic conductivity of the filter media was set to 100 mm/hr, but the depth to groundwater table was varied from 1.0 m to 1.5 m. The graphs also show the variation with the saturated hydraulic conductivities of the in-situ soil. As can be observed from these graphs, for a given saturated hydraulic conductivity of the filter media, saturated hydraulic conductivity of the in-situ soil, and surface area of the soak-away rain garden (as a % of catchment area), the overflow volume (as a % of total runoff volume) increases as depth to groundwater table increases. The possible reason for this observation is that as depth to groundwater table increases flow length increases. However, ex-filtrated flow is inversely proportional to the flow length. Thus, as depth to groundwater table increases it is expected to have less ex-filtrated water and thus more overflow volume (as a % of total runoff volume).
3.3.4. Impact of Saturated Hydraulic Conductivity of the Filter Media
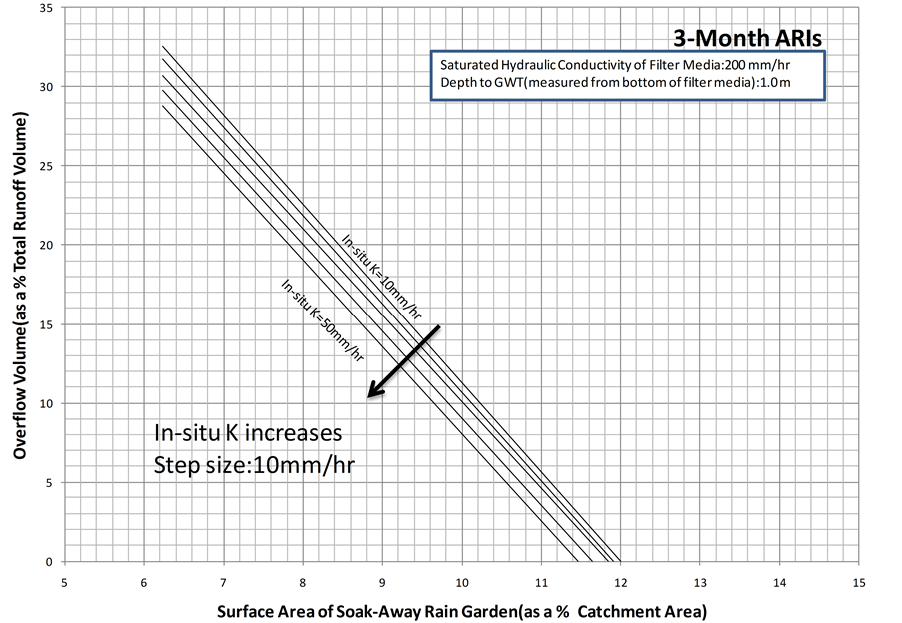
To understand the impact of saturated hydraulic conductivity of the filter media on overflow volume (as a % of total runoff volume), as shown in Figure 7 and Figure 8, graphs of overflow volume (as a % of total runoff volume) versus the surface area of the soak-away rain garden (as a % of catchment area) were plotted. In Figure 7 and Figure 8, the saturated hydraulic conductivity of the filter media was set to 150 mm/hr and 200 mm/hr, respectively. For these graphs the depth to groundwater table was set to 0.5 m. The graphs also show the variation with the saturated hydraulic conductivities of the in-situ soil. Figure 9 shows the graphs for the considered saturated hydraulic conductivities of the filter media, but depths to groundwater table of 1.0 m and 1.5 m.
As can be observed from these graphs, for a given saturated hydraulic conductivity of the in-situ soil, depth to groundwater table, and surface area of the soak-away rain garden (as a % of catchment area), the overflow volume (as a % of total runoff volume) decreases as the saturated hydraulic conductivity of the filter media increases. The possible reason for this observation is that the ex-filtrated water, which is drained through bottom and side walls of the soak-away rain garden, increases as the saturated hydraulic conductivity of the filter media
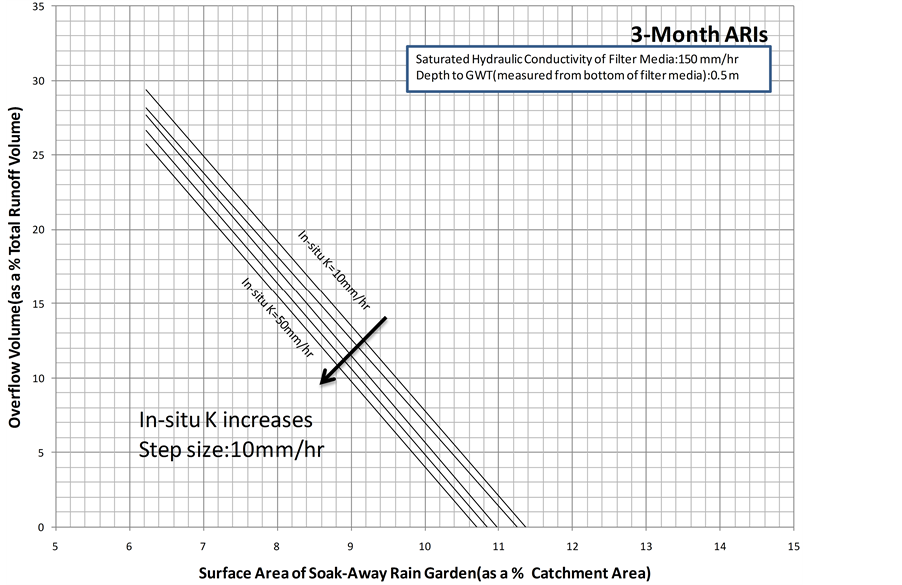
Figure 7. Overflow volume (as a % total runoff volume) for a depth to groundwater table of 0.5 m and a saturated hydraulic conductivity of the filter media of 150 mm/hr.
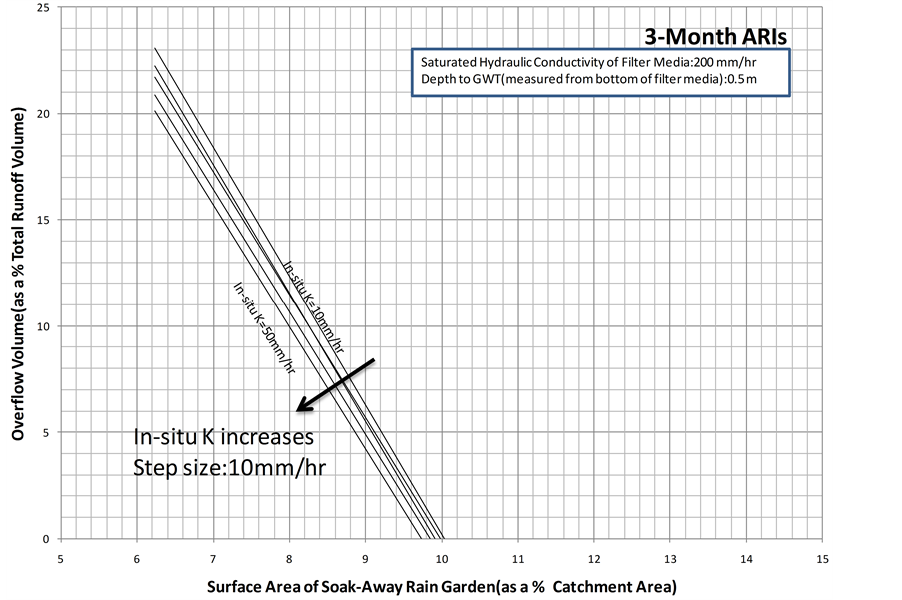
Figure 8. Overflow volume (as a % total runoff volume) for a depth to groundwater table of 0.5 m and a saturated hydraulic conductivity of the filter media of 200 mm/hr.
 (a)
(a)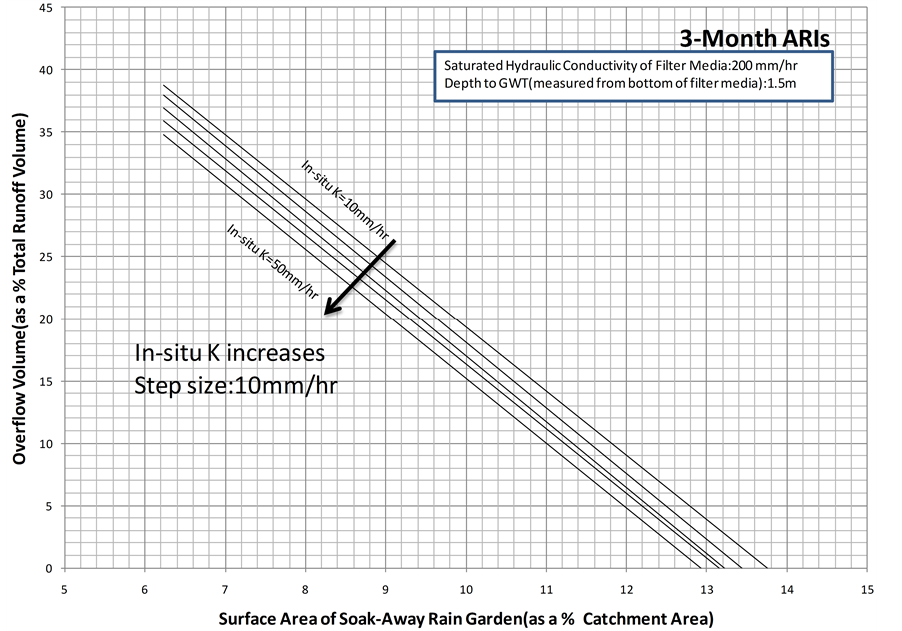 (b)
(b)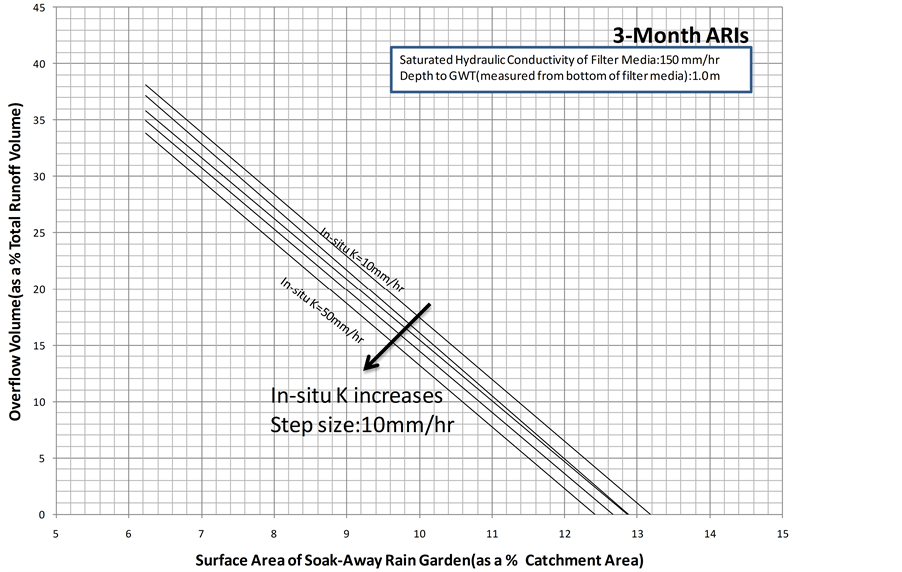 (c)
(c)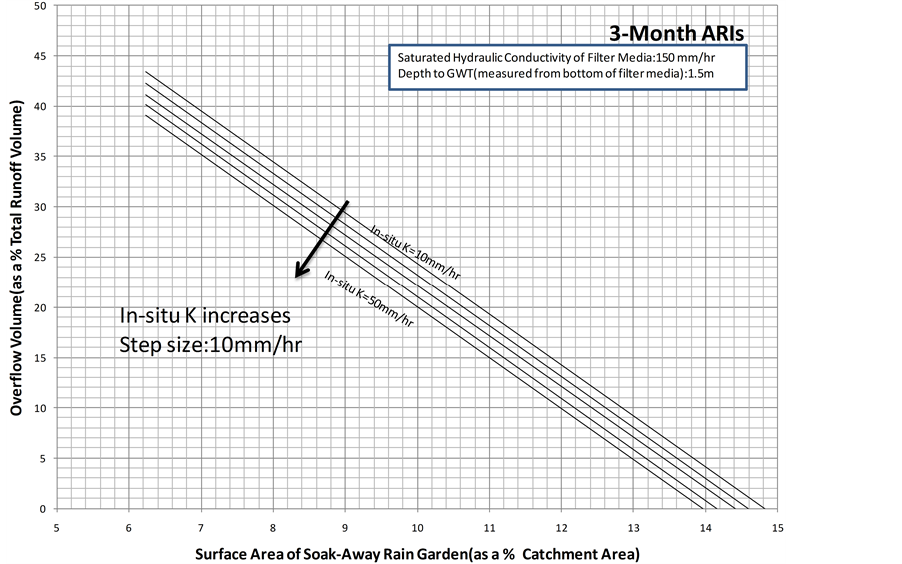 (d)
(d)
Figure 9. Overflow volume (as a % total runoff volume) for a (a) depth to groundwater table of 1.0 m and a saturated hydraulic conductivity of the filter media of 200 mm/hr (b) depth to groundwater table of 1.5 m and a saturated hydraulic conductivity of the filter media of 200 mm/hr (c) depth to groundwater table of 1.0 m and a saturated Hydraulic conductivity of the filter media of 150 mm/hr (d) depth to groundwater table of 1.5 m and a saturated hydraulic conductivity of the filter media of 150 mm/hr.
increases. This is owing to the fact that the ability of the soil fluid to flow through the soil matrix system increases as the saturated hydraulic conductivity of the filter media increases. Thus, as the saturated hydraulic conductivity of the filter media increases it is expected to have more ex-filtrated water and thus less overflow volume (as a % of total runoff volume).
4. Conclusion
To have a rapid assessment of soak-away rain gardens on a range of potential hydrologic conditions (e.g., size of the soak-away rain garden, saturated hydraulic conductivity of the in-situ soil, and saturated hydraulic conductivity of the filter media), with a design hyetograph of 3-month average rainfall intensities of Singapore, this study establishes easy-to-use look-up hydrologic design charts, especially, design charts on overflow volume (as a % of total runoff volume) of soak-away rain gardens that are specific for local conditions by developing a mathematical model based on Richard’s equation using COMSOL Multiphysics. These easy-to-use look-up hydrologic design charts will be of great utility for local managers in the design of soak-away rain gardens to control the flooding that endangers existing infrastructures and the downstream users.
Acknowledgements
The authors would like to thank PUB, Singapore’s national water agency, for providing the financial support to conduct this research.
Cite this paper
SivarajahMylevaganam,Ting Fong MayChui,JiangyongHu, (2015) Easy-to-Use Look-Up Hydrologic Design Charts of a Soak-Away Rain Garden in Singapore. Open Journal of Civil Engineering,05,269-280. doi: 10.4236/ojce.2015.53027
References
- 1. Allan, P.D., Robert, G.T. and William, F.H. (2010) Improving Urban Stormwater Quality: Applying Fundamental Principles. Journal of Contemporary Water Research and Education, 146, 3-10.
http://dx.doi.org/10.1111/j.1936-704X.2010.00387.x - 2. Jia, L., David, J.S., Cameron, B. and Yuntao, G. (2014) Review and Research Needs of Bioretention Used for the Treatment of Urban Stormwater. Journal of Water, 6, 1069-1099.
http://dx.doi.org/10.3390/w6041069 - 3. Hunt, W.F., Jarrett, A.R., Smith, J.T. and Sharkey, L.J. (2006) Evaluating Bioretention Hydrology and Nutrient Removal at Three Field Sites in North Carolina. Journal of Irrigation and Drainage Engineering, 132, 600-608.
http://dx.doi.org/10.1061/(ASCE)0733-9437(2006)132:6(600) - 4. Jones, M.P. and Hunt, W.F. (2009) Bioretention Impact on Runoff Temperature in Trout Sensitive Waters. Journal of Environmental Engineering, 135, 577-585.
http://dx.doi.org/10.1061/(ASCE)EE.1943-7870.0000022 - 5. Li, H., Sharkey, L.J., Hunt, W.F. and Davis, A.P. (2009) Mitigation of Impervious Surface Hydrology Using Bioretention in North Carolina and Maryland. Journal of Hydrologic Engineering, 14, 407-415.
http://dx.doi.org/10.1061/(ASCE)1084-0699(2009)14:4(407) - 6. Richards, L.A. (1931) Capillary Conduction of Liquids through Porous Mediums. Journal of Applied Physics, 1, 318-333.
http://dx.doi.org/10.1063/1.1745010 - 7. COMSOL AB (2012) COMSOL Multiphysics User’s Guide (Version 4.3). Stockholm.
- 8. COMSOL AB (2012) COMSOL Multiphysics Reference Guide (Version 4.3). Stockholm.
- 9. Li, Q., Ito, K., Wu, Z., Lowry, C.S. and Loheide II, S.P. (2009) COMSOL Multiphysics: A Novel Approach to Ground Water Modeling. Groundwater, 47, 480-487.
http://dx.doi.org/10.1111/j.1745-6584.2009.00584.x - 10. Chow, V.T., Maidment, D.R. and Mays, L.W. (1988) Applied Hydrology. McGraw Hill, New York.
NOTES

*Corresponding author.