Modern Instrumentation
Vol.3 No.1(2014), Article ID:41924,7 pages DOI:10.4236/mi.2014.31001
Smart Thermometer Technology for Detection and Monitoring of More than 100 Diseases at Home
JSC “CEM-Technology”, Nyzhny Novgorod, Russia
Email: cem.consultant@gmail.com
Copyright © 2014 Y. A. Tkachenko et al. This is an open access article distributed under the Creative Commons Attribution License, which permits unrestricted use, distribution, and reproduction in any medium, provided the original work is properly cited. In accordance of the Creative Commons Attribution License all Copyrights © 2014 are reserved for SCIRP and the owner of the intellectual property Y. A. Tkachenko et al. All Copyright © 2014 are guarded by law and by SCIRP as a guardian.
Received September 6, 2013; revised October 7, 2013; accepted October 14, 2013
Keywords:Infrared Sensor; Thermogram; Automatic Conclusion; Monitoring of Diseases; Monitoring at Home; Dynamics of Pathological Process
ABSTRACT
Smart Thermometer Technology is intended for early detection and objective monitoring of more than 100 diseases (inflammatory, vascular and tumor) by measuring the temperature of the area of interest on human skin surface. The technology includes fast-operating infrared sensors that can be connected by wireless communication to mobile devices, available to a user (smart phones, tabs, etc.) with built-in specialized thermography software. It measures the temperature of any areas of human skin surface via infrared sensor point by point, generates thermogram and automatically gives comprehensive to an average person report about the state of the examined area and dynamics of the pathological process after each monitoring session. Self-examination of one anatomical area takes no more than 1 minute. Smart Thermometer Technology allows us to increase the accuracy of monitoring of a disease, and in most cases without participation of a doctor, simplify and cheapen obtaining of information on the course of a pathologic process and obtaining of the conclusion on the effectiveness of treatment.
1. Introduction
In medicine, the term monitoring usually refers to the process of systematic and continuous gathering of information on the functioning of various organs and systems of the human body for controlling of the course of the disease, early detection of exacerbations and determination of the effectiveness of the administered treatment.
Currently, because of the large number of highly specific devices and methods for diagnostics, there is no problem with establishing the exact diagnosis in the majority of clinical cases. However, there are no precise, safe, and accessible to common user devices for objective monitoring of the course of the disease or therapy efficiency at home for the majority of the most widespread diseases, which are the main cause of death (vascular, inflammatory, oncology, etc.). In fact, before the appearance of Smart Thermometer Technology, possibilities of objective home monitoring of chronic diseases were restricted by monitoring of hypertension (with tonometer) and diabetes mellitus (with glucometer).
This need can be successfully satisfied with unification of the process of self-examination and automated issuing of digital and/or text indicators.
It is known that many human diseases are accompanied by characteristic changes in the surface temperature of the skin in certain areas of the body (i.e., local thermosigns of diseases). Therefore, information on the distribution of temperature values gives an indication of the presence of a pathology in the body [1]. Moreover, thermo signs of diseases usually appear before other clinical manifestations of the disease and vary considerably during the course of treatment.
Identification, analysis and interpretation of thermo signs are studied by a special section of functional diagnostics: medical thermography. Medical thermography is approved by FDA as method for diagnosis and monitoring of some diseases.
Thermograph is the most perfect device for observing distribution of temperature of the examined surface with the help of matrix of infrared sensitive elements, registering thermal radiation from an object. The temperature distribution is shown on the display of the thermograph as the color field (thermogram), where the specific color corresponds to certain temperature value. Typical resolution of modern thermographs is from 0.01˚C to 0.1˚C. In some models of thermographs, the information can be read from the interface of computer connection and processed by specialized programs. In medicine, thermographs were introduced more than a half century ago [2] and they were used in diagnostics of a number of inflammatory, vascular, and oncology diseases.
However, thermographs have the following disadvantages that prevent their wide application:
- Thermographs fail to provide accurate repeatability of measurements, align the same distance and angle between the imager and the examined object in repeated examinations, and consequently, it is impossible to automatically compare thermograms for monitoring purposes. Also, air currents between a thermograph and a patient are different for each session, which negatively affects repeatability of results.
- In thermography examination of a human body, measurement errors take place, because of complex relief of the surface, which leads to different mutual reflection at different angles of orientation of the thermograph, particularly in the areas of natural hollows (navel, inter-finger spaces, etc.) and adjoining parts of the body. Information on the temperature of the object is carried only by self-radiation, which extends according to normal (perpendicular) from each point of the object’s surface.
- Inability of measuring the areas covered by hair, as hair shield thermal radiation.
- Due to the complexity, ergonomics, and the fact that thermographs are not designed for self-examination, as well as their high cost, thermographs can not be used at home.
Thermography diagnostics has high sensitivity and low specificity. For example, infrared thermography has sensitivity of 97% and specificity of only 44% in the examination for the purpose of detection of breast cancer [3]. Because of this as well as the absolute safety, infrared thermography is ideal for monitoring of a wide range of diseases (inflammatory, neoplastic, vascular) after establishing diagnosis.
Thus, there is a need for the development of easy-touse, precise and cheap devices that can perform individual monitoring at home based on temperature measurements of the human skin surface and generated thermograms, i.e. automatically give conclusions on the dynamics of pathological processes and assess the effectiveness of treatment.
2. Smart Thermometer Technology
Basing on the accumulated experience of thermography studies, we have developed Smart Thermometer Technology. The technology is intended for monitoring of inflammatory, vascular, and oncology diseases of the organs that are situated close to skin, as well as skin diseases. This technology is recommended for monitoring of already diagnosed diseases, for controlling the dynamics of pathologic process and effectiveness of treatment at home. Below is the list of diseases for monitoring or which Smart Thermometer Technology is recommended (by International Statistical Classification of Diseases and Related Health Problems 10th Revision):
• Chapter II Neoplasms Melanoma and other malignant neoplasms of skin (C43-C44)
Malignant neoplasm of breast (C50)
Benign neoplasms (D10-D36)
• Chapter VIII Diseases of the ear and mastoid process Diseases of middle ear and mastoid (H65-H75)
• Chapter IX Diseases of the circulatory system Diseases of arteries, arterioles and capillaries (I70- I79)
• Chapter X Diseases of the respiratory system Acute upper respiratory infections (J00-J06)
• Chapter XII Diseases of the skin and subcutaneous tissue Infections of the skin and subcutaneous tissue (L00- L08)
• Chapter XIII Diseases of the musculoskeletal system and connective tissue Infectious arthropathies (M00-M03)
Inflammatory polyarthropathies (M05-M14)
Arthrosis (M15-M19)
Disorders of synovium and tendon (M65-M68)
Other soft tissue disorders (M70-M79)
• Chapter XIV Diseases of the genitourinary system Disorders of breast (N60-N64)
• Chapter XIX Injury, Poisoning & Certain Other Consequences of External Causes Injuries to the elbow and forearm (S50-S59)
Injuries to the wrist, hand, and fingers (S60-S69)
Injuries to the knee and lower leg (S80-S89)
Smart Thermometer Technology for monitoring of diseases is carried out in the following way, the basic sequence of actions of the average person or medical staff is described below.
In the first session of self-examination (examination), the image of the examined area of human skin surface is obtained from the camera and displayed on the screen in the form of a photographic image. Alternatively, at the request of the user, 2D or 3D models of an area of human skin surface retrieved from the memory unit to the screen can be used as an image of the examined area. Graphical indications of points for temperature measurement are indicated on the image of the examined area, for example, by imposing the ready-made set of graphical indications of points, available in the program (from the memory unit), or that template can be formed sequentially by hand (for telemedical consultations). Images of the examined area with indicated graphical indications of points for temperature measurement are entered into the memory unit once to form a template that is stored in the memory unit for further use during the monitoring period. The saved template is retrieved from the memory unit in the repeated monitoring sessions.
Then, the temperature in each point of the examination area of human skin surface is measured by the quickoperating infrared sensor (Figure 1(a)).
More than 95% of average persons, users of the device, easily located the points for temperature measurement on skin surface by looking at own photographic image of skin surface with pre-measurement points on a screen. Measurement of temperature on the examination area in visual correlation with graphical indications of points on the template is done repeatedly during the time interval chosen by the user. Measuring temperature of the zones that a user cannot reach (for example, the back) can be done by any assistant without medical training, for example, relative or friend. Measurement of temperature at the points is carried out with maximum unification of the distance and the angle (with minimal deviation from perpendicular) between the surface of examination area of skin and the sensor, by using the tool for unification of temperature measurements, made in a form of a projection from a biologically neutral material around the hole, in which an infrared sensor is installed. A thermal conductivity of the material of the tool must be low in any conventional conditions and does not influence skin surface temperature. The measurement results are saved in the memory unit and processed with the issuance of numeric indexes, graphical, and text messages. Besides, based on the results of the measurements, thermogram is received on the image of the examined area and saved in the memory unit by predetermined method.
Smart Thermometer (Figure 1(a)) includes infrared sensor (1) with the tool for providing the constant distance and the angle between the examined area of the human body and infrared sensor, control button (2), power supply, and wireless connection unit (GPRS, IEEE 802.11, 802.15) for connecting to user’s device for receiving, processing, and saving of information (Figure 1(b)), for example, to personal computer with web camera, tablet computer, smartphone. The program for Smart Thermometer Technology implementation is downloaded to the user’s device before the beginning of Smart Thermometer operation.
The user can repeat the examination session at any time and unlimited number of times. On the request of the user, the comparison of the results of measurements (temperature values in the same points of the template, obtained at different monitoring sessions) is done starting from the second examination session in automatic mode, also, analysis is conducted in accordance with pre-saved algorithms with the subsequent issuing of conclusions on the course of the pathologic process and/or the effectiveness of treatment, as well as with issuing of the user indexes, text messages, thermograms that are necessary for clear understanding of the results of examination. In cases, when the user can not interpret the results, he or she can send the results of measurements through communication channels to a doctor, for example, through telemedical consultation.
3. Operation Procedure of Smart Thermometer
The image of the examined area is received and displayed on the screen in the form of a photo at the first self-examination session. The ready set of pre-measurement points for temperature measurement contained in the program is fixed on the image of the on the area of human skin surface.
Images of the examined area with the pre-measurement points for temperature measurement on the area of human skin surface are entered into the memory once for receiving the template that is saved in the memory for further use in the monitoring process (Figure 2, operation procedure of Smart Thermometer is explained in the example of knee joint arthritis). The saved template is extracted from the device’s memory for repeated monitoring sessions.
Then, the temperature of the examined area in each point is measured with fast-operating infrared sensor and information on the temperature data in each point is received (Figure 3). Self-examination of one anatomical area takes no more than 1 minute.
According to the results of the first session of examination, the necessary for interpretation numeric indexes are determined automatically (for example, maximal difference of points’ temperatures, the area of hypoand hyper-thermia in the examined area, and others); text conclusions that reflect the results of analysis are issued automatically. However, independent significance of the data from the first examination session is insignificant because of the known low specificity of thermography method. This data has the added value only for the specialist, not the average person, and only in conjunction with other clinical data necessary to establish the diagnosis.
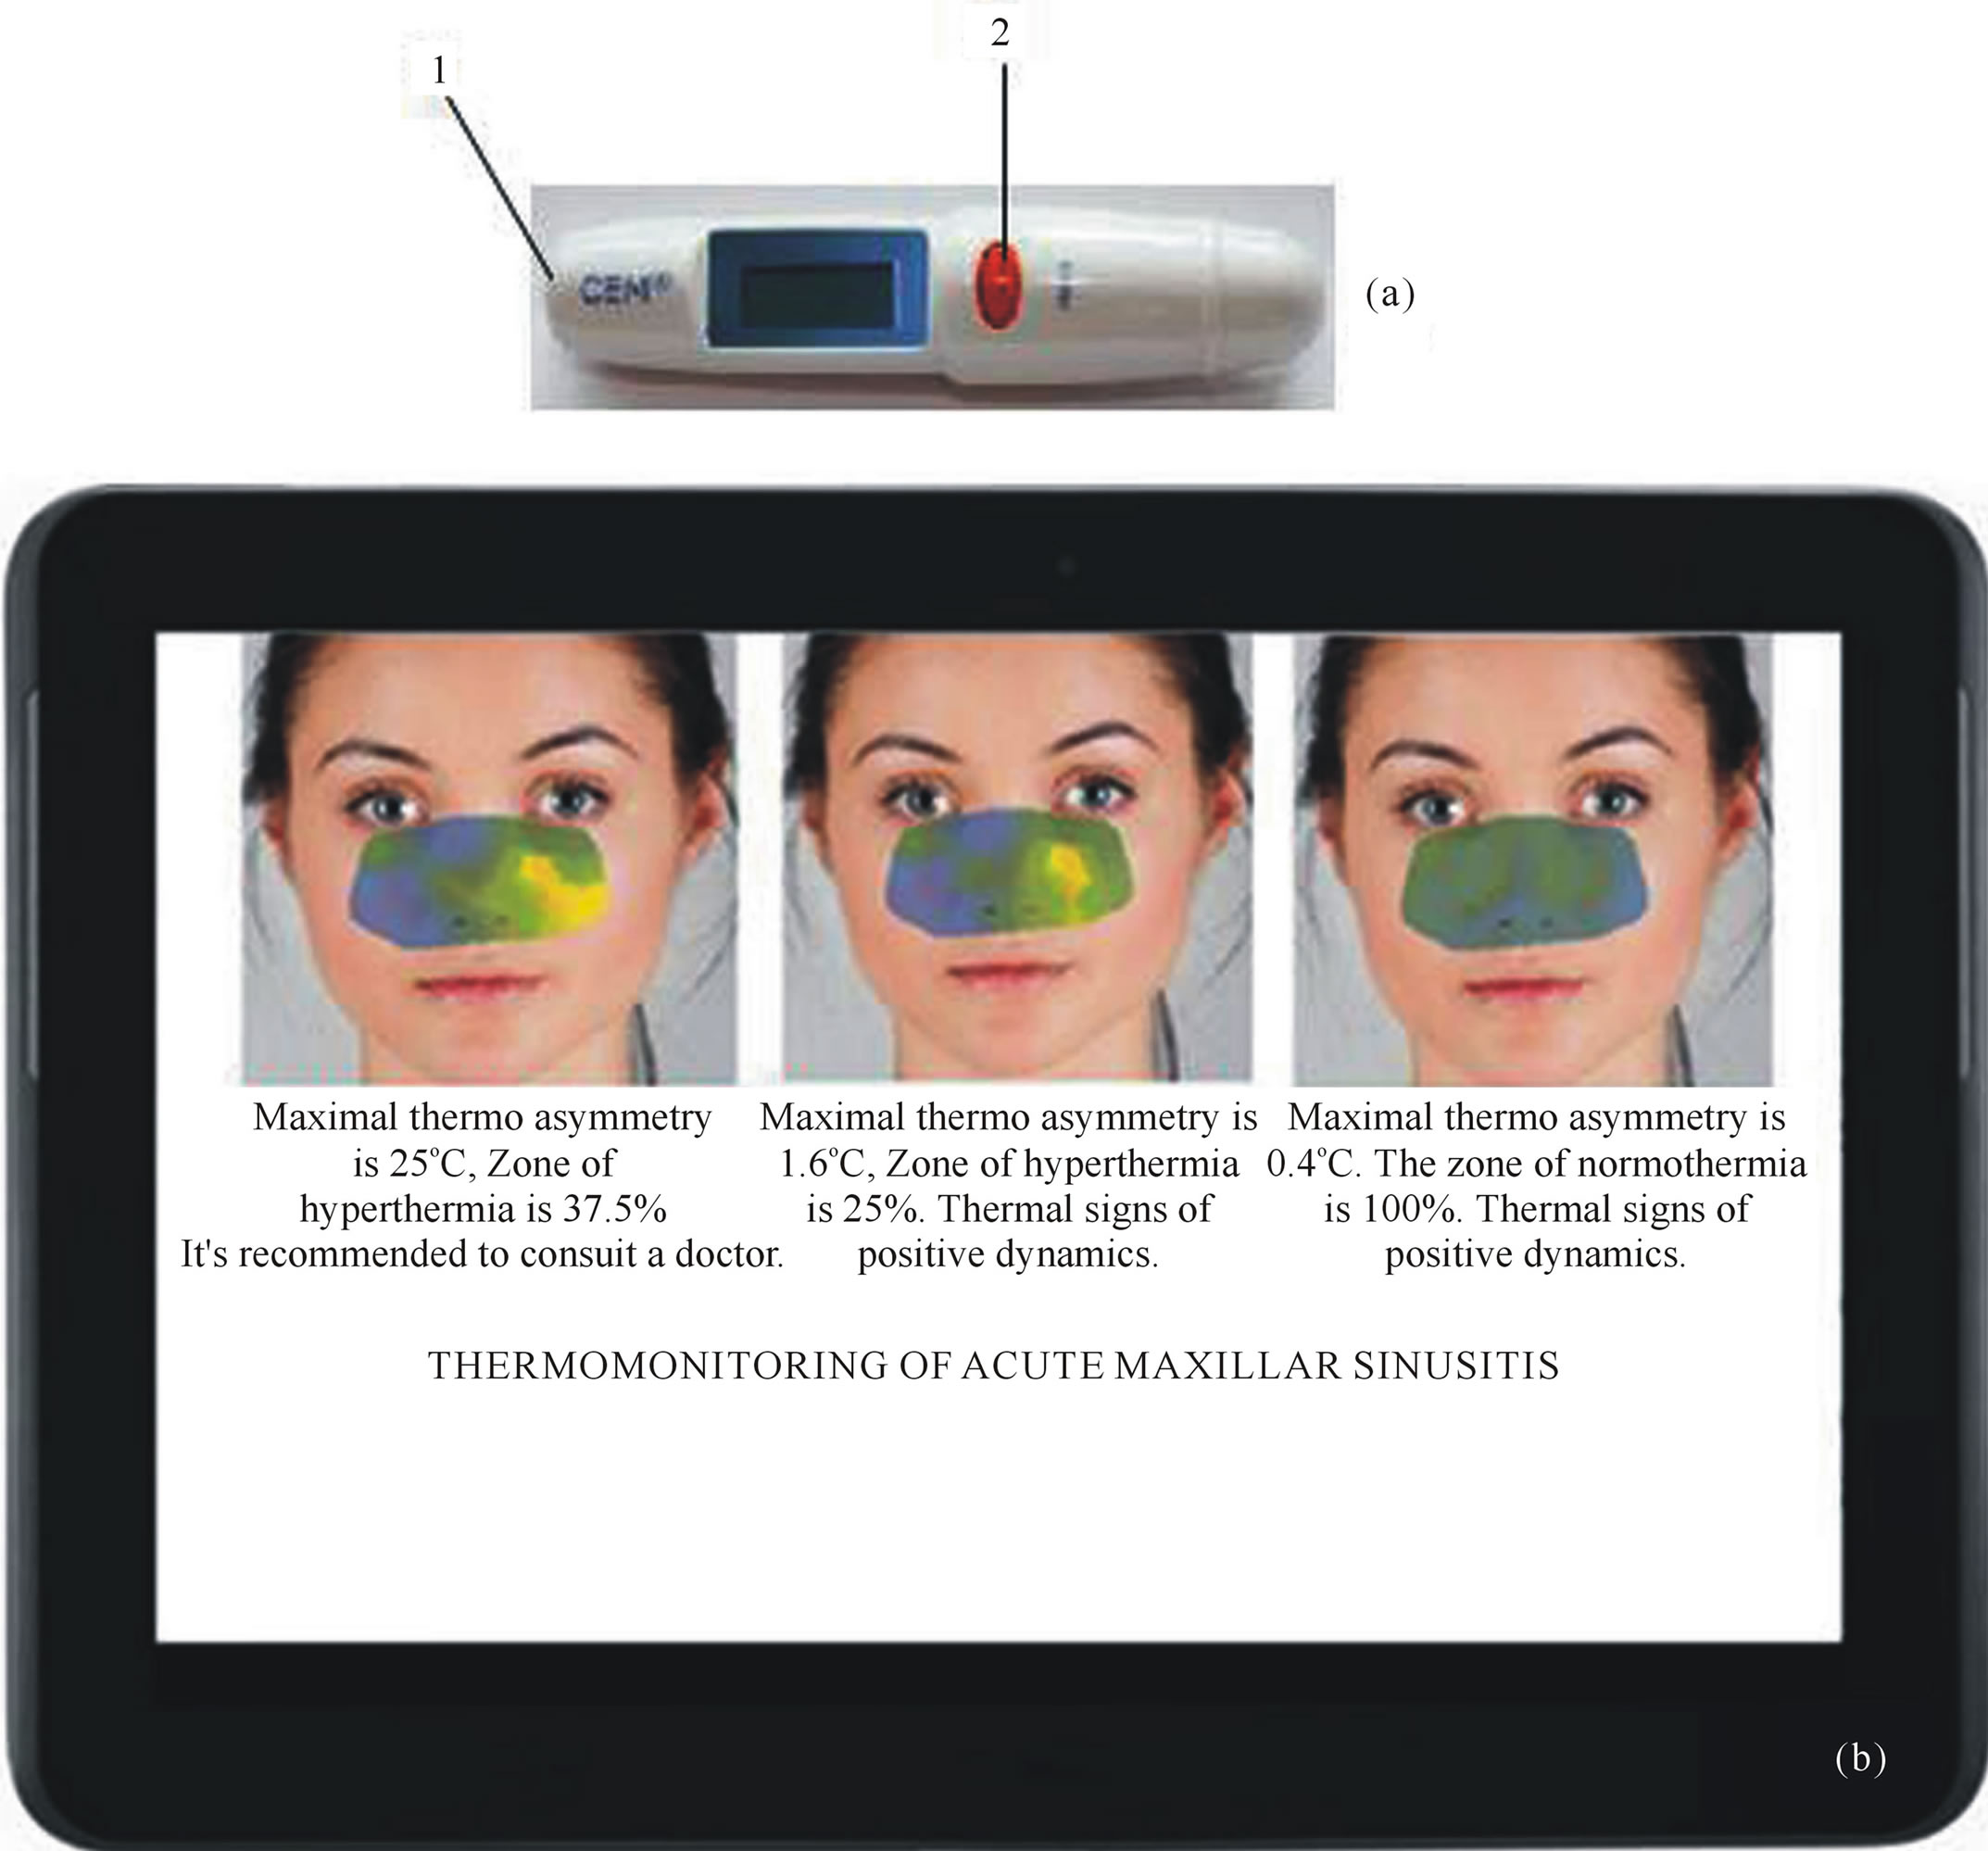
Figure 1. (а) Smart thermometer; (b Mobile device with thermographic software.
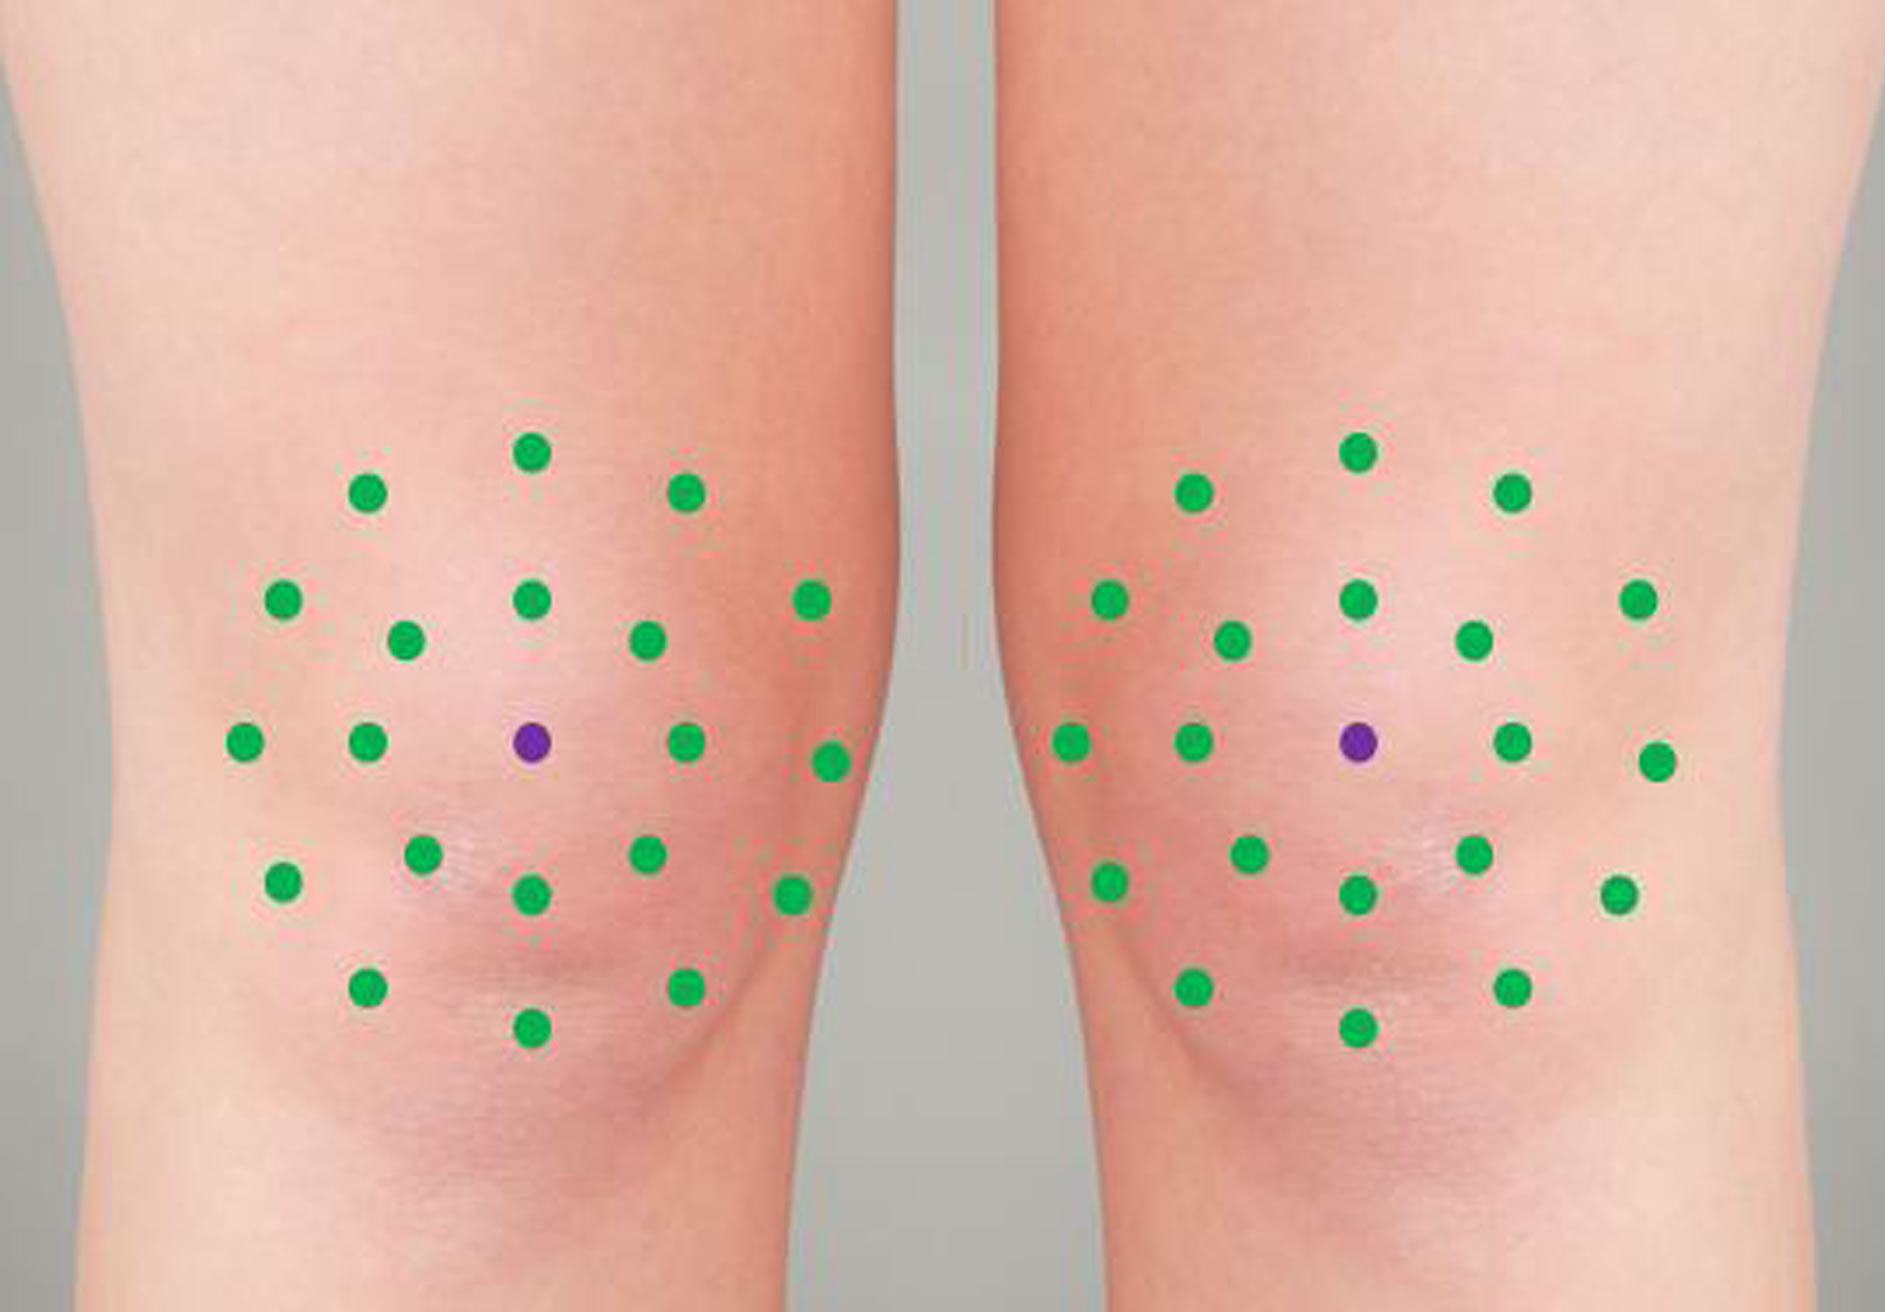
Figure 2. Individual template for monitoring of the condition of knee joints.
Measurement of temperature in the points by the template on the area under examination can be performed repeatedly during the time interval selected by the user. Numerical indexes, text messages, thermograms, graphs of temperature change can be issued to the user (Figure 4). In most of the cases, an average person can under- stand automatic conclusion on the results of monitoring.
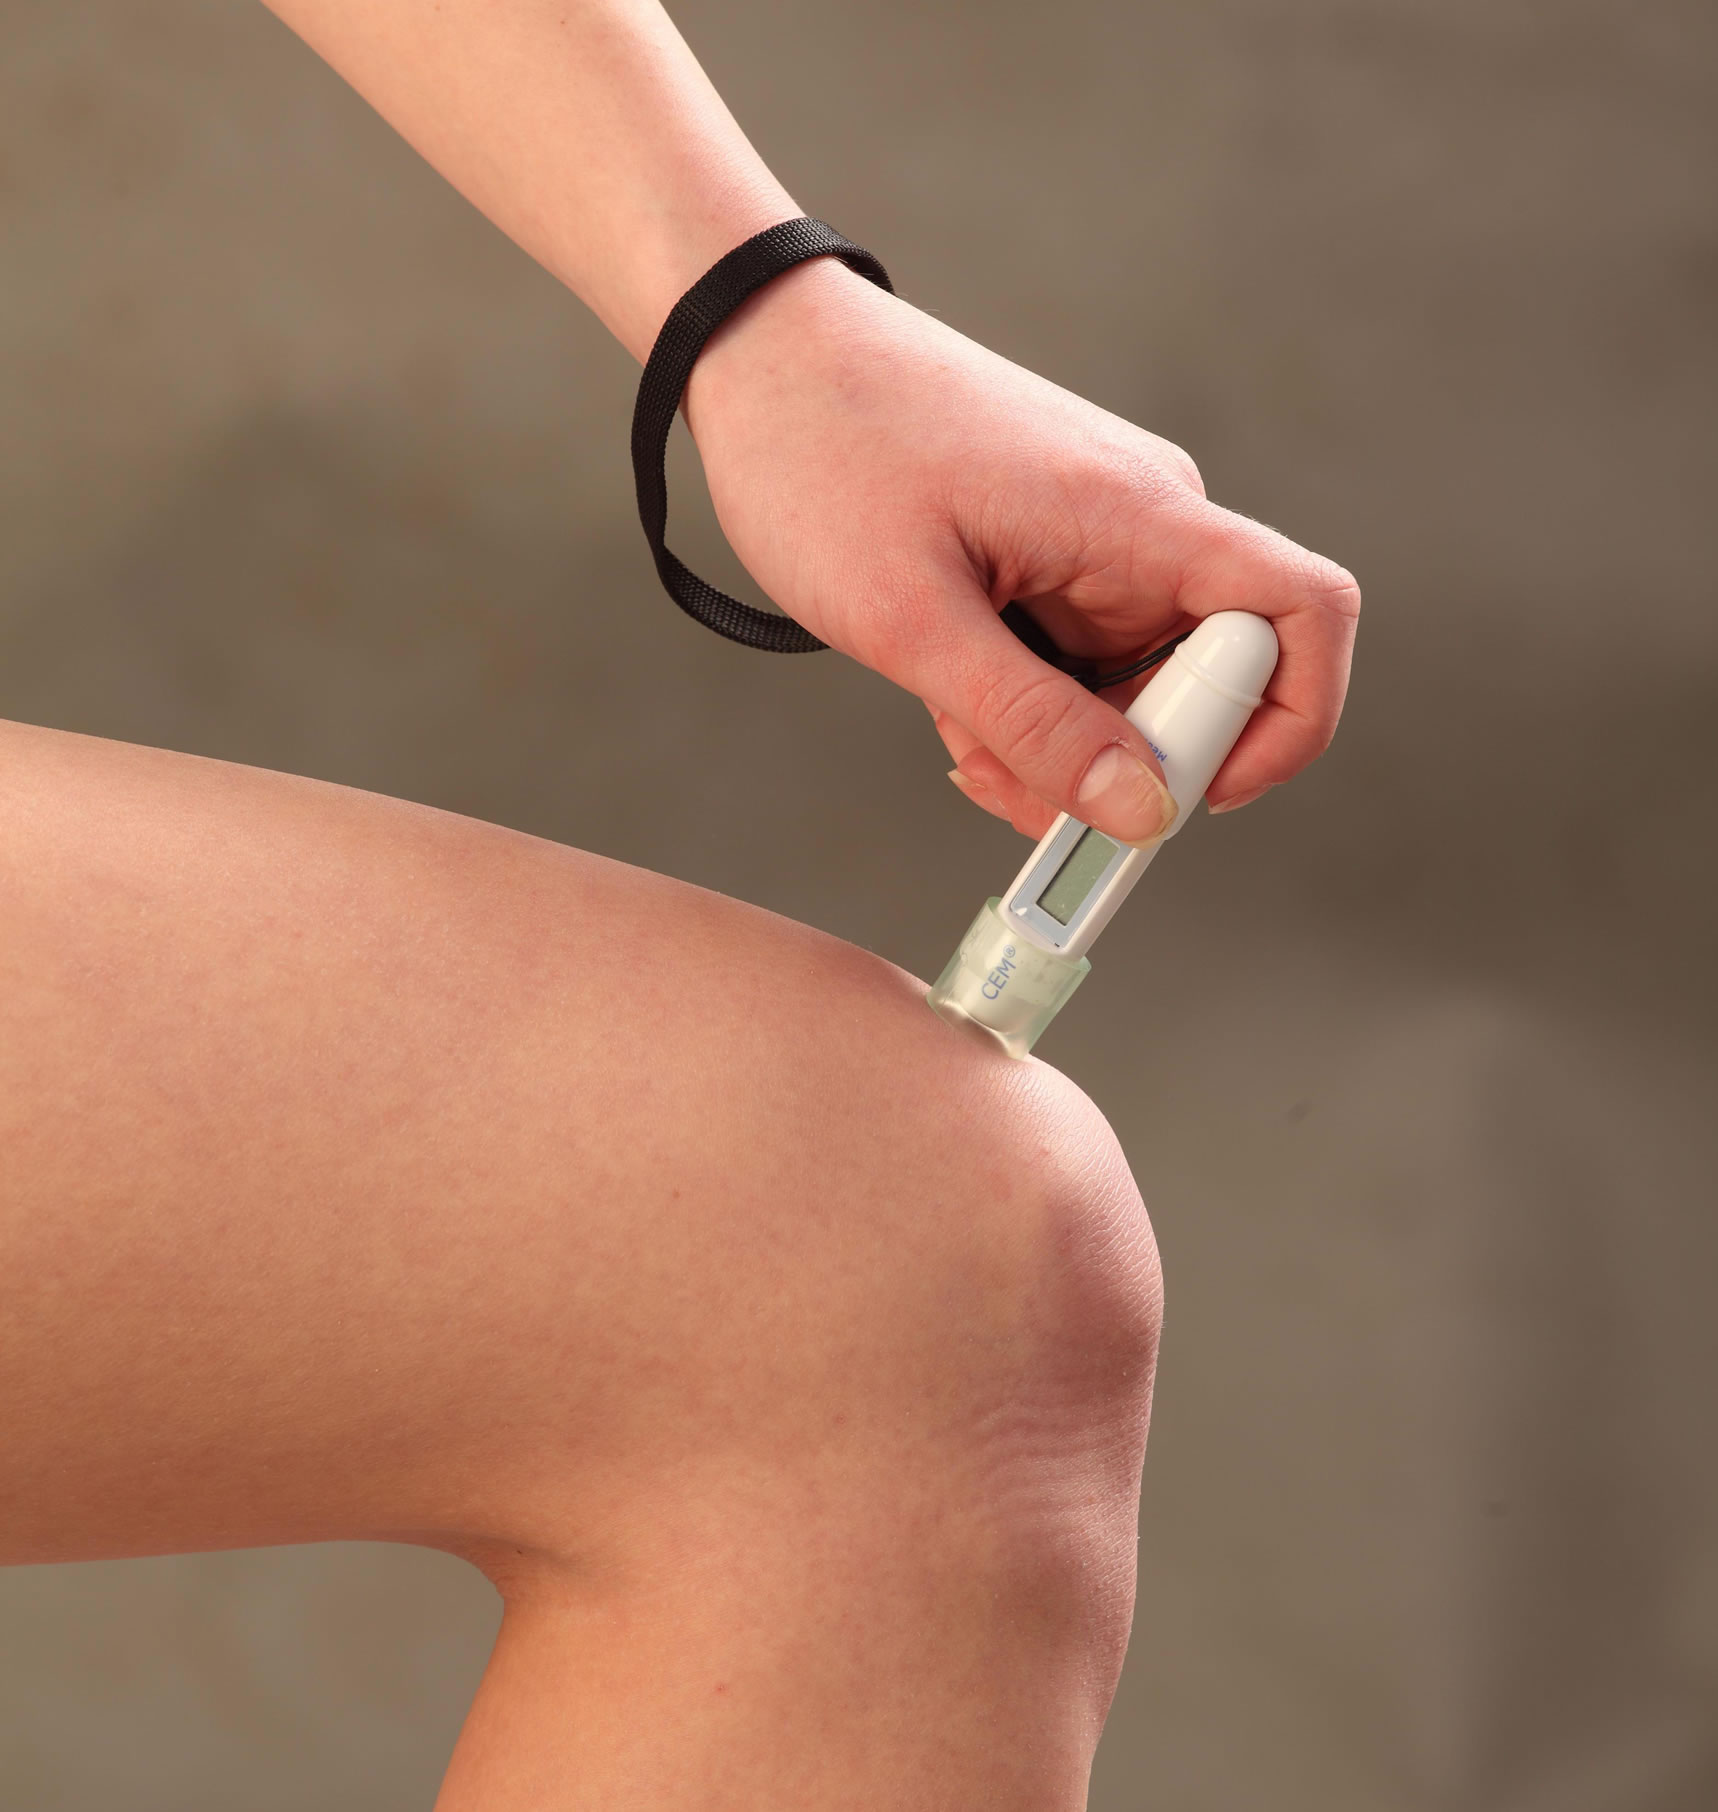
Figure 3. The process of temperature measurement in the area of knee joint.
Basing on the objective data obtained from Smart Thermometer Technology, the user can correct therapy by
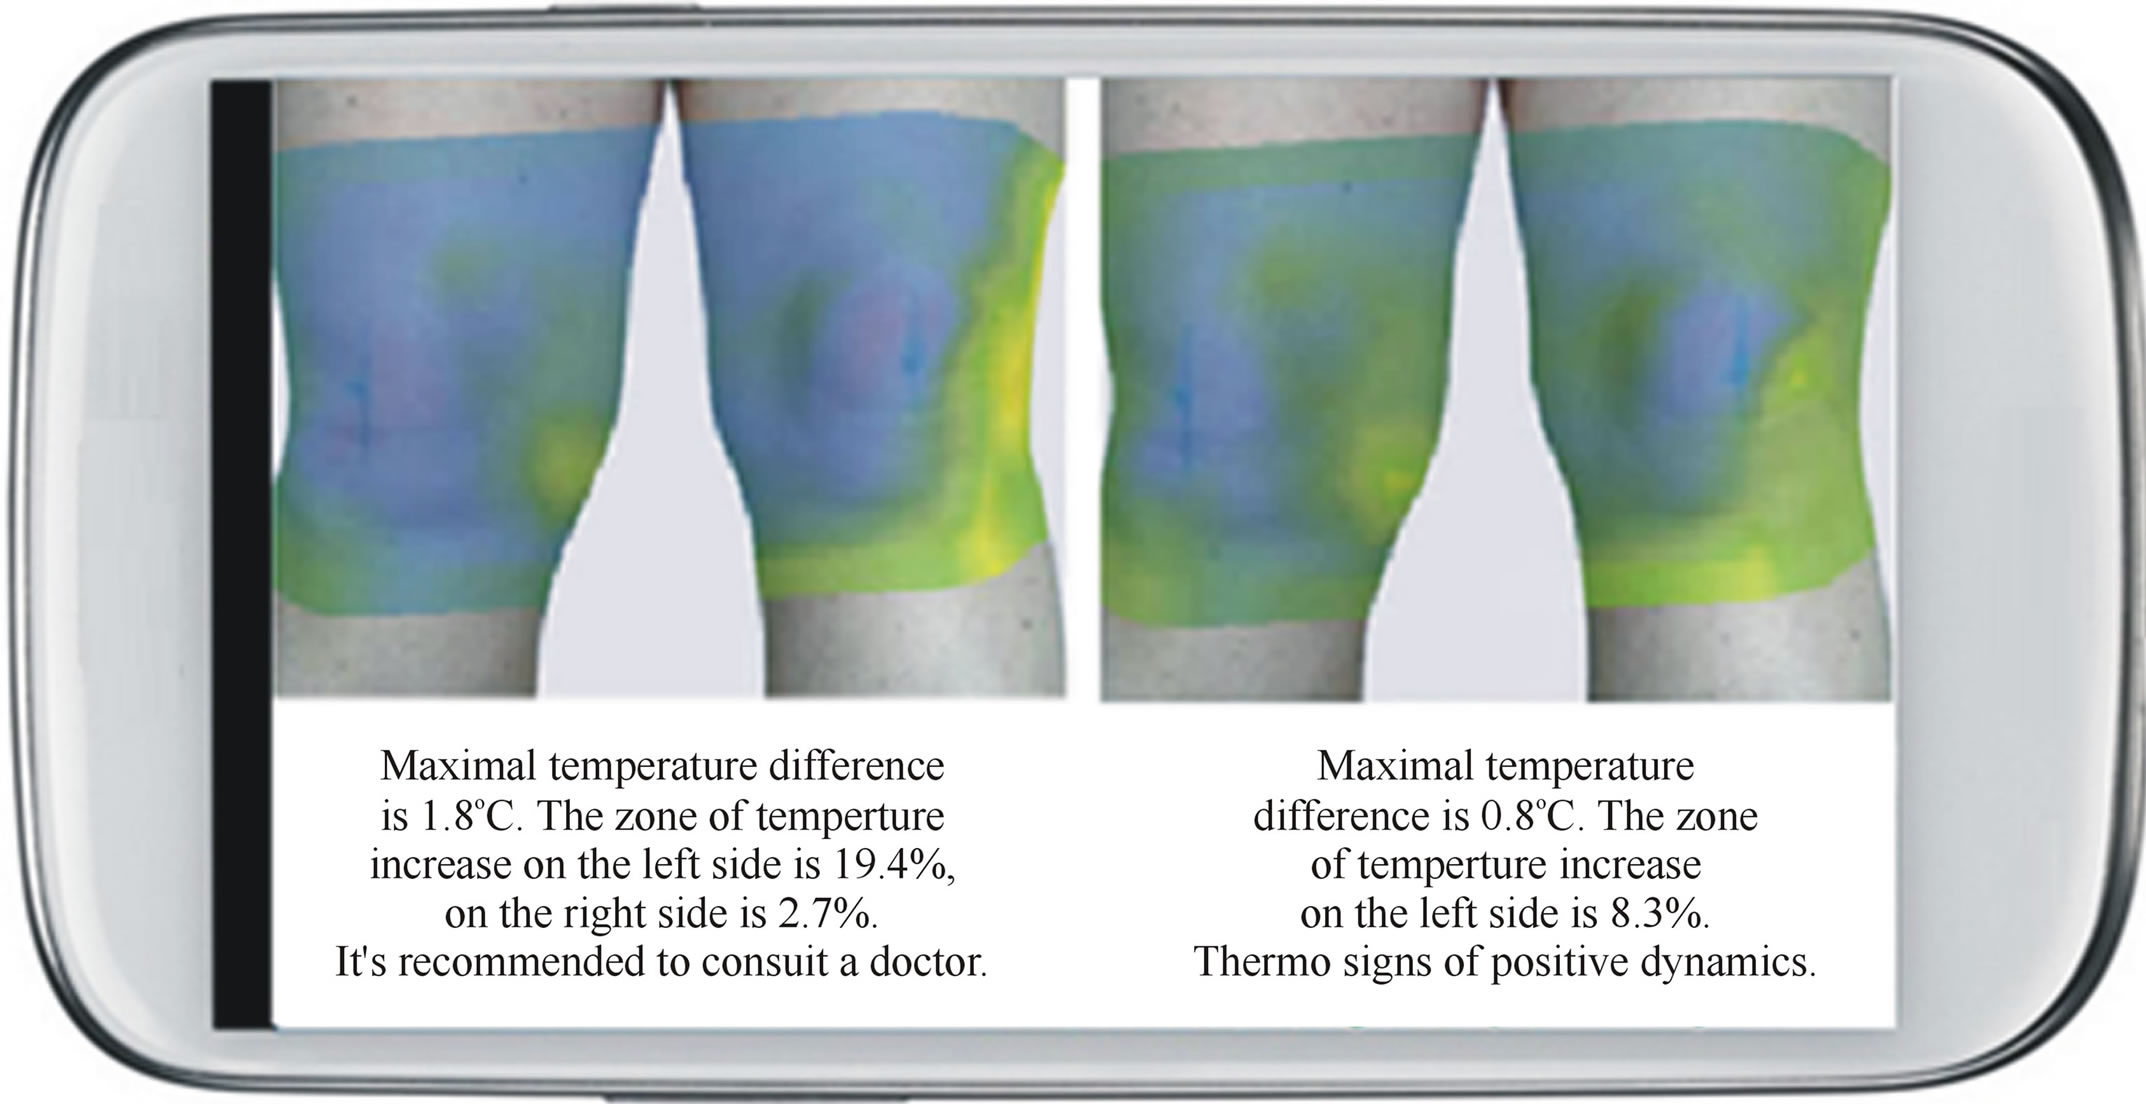
Figure 4. Thermograms of knee joints and automatic conclusion received during the process of monitoring of exacerbation chronic osteoarthritris.
himor herself if necessary. Such correction of therapy is done in a similar manner as application of tonometer by users with hypertension or as application of glucometer by users with diabetes mellitus. At that, automatic conclusion is provided in correct verbal terms that conform to FDA rules for such medical technologies.
For the purpose of increasing the visibility, numerical values and text messages displayed in different colors, for example, in the case of positive dynamics: in the green, in the case of mixed dynamics or its absence: in yellow, in the case of negative dynamics: in red. Thermograms superimposed on an photo image or picture of the examined area show objective localization of the pathological focus, which does not always coincide with the localization of pain and other subjective experiences, which allows the user to make local therapeutic incluences more targeted and therefore, more effective.
Also, thermograms show relative position and shape of the areas of hyperand hypothermia on the area under examination, which is important information for telemedicine consultations.
Figure 5 shows an example of monitoring of nevus condition. According to the results of monitoring, significant increase of temperature of a nevus in comparison to the surrounding skin’s temperature is revealed, which can indicate its malignization [4]. Therefore, conclusion for the second thermogram is generated in red color and includes recommendation to consult with a doctor. In that way, timely notification of a user about the possible problem is realized.
Figure 6 shows an example of monitoring of the condition of mammary glands, mastopathy is diagnosed earlier. 3D model of a body was used in order to protect personal information immunity. According to the results of monitoring, significant thermo-asymmetry between the mammary glands is revealed, which can indicate malignant growth [5]. Therefore, conclusion for the second thermogram is generated in red color and includes recommendation to consult with a doctor. In that way, timely notification of a user about the possible problem is realized.
With the help of Smart Thermometer, not only the course of the disease can be monitored, but also the effectiveness of procedures used in medical cosmetology. Figure 7 shows an example of thermal monitoring of the effectiveness of application of anti-cellulites program. More detailed clinical applications of Smart Thermometer Technology are available on the www.smart-thermometer.com.
4. Conclusions
Smart Thermometer has advantages of pyrometers and thermographs, but at the same time does not have their shortcomings:
● It allows accurate positioning on the measurement points in each series of measurements.
● It has fixed view spot, prevents the influence of air flows on the results of temperature measurements, prevents direct contact of the infrared sensor with the skin surface, and thus provides a low measuring error due to maximum unification of the distance and angle between the infrared sensor and the examined surface.
● It combines high accuracy of temperature measurement with high speed of measurement due to the use of infrared sensor, which allows, during one session, to measure the temperature of points sufficient for detection and monitoring of any pathology, possible in the examination area, connected to the change of local temperature of the organs located close to skin surface, including in hard-to-assess areas, for exam-
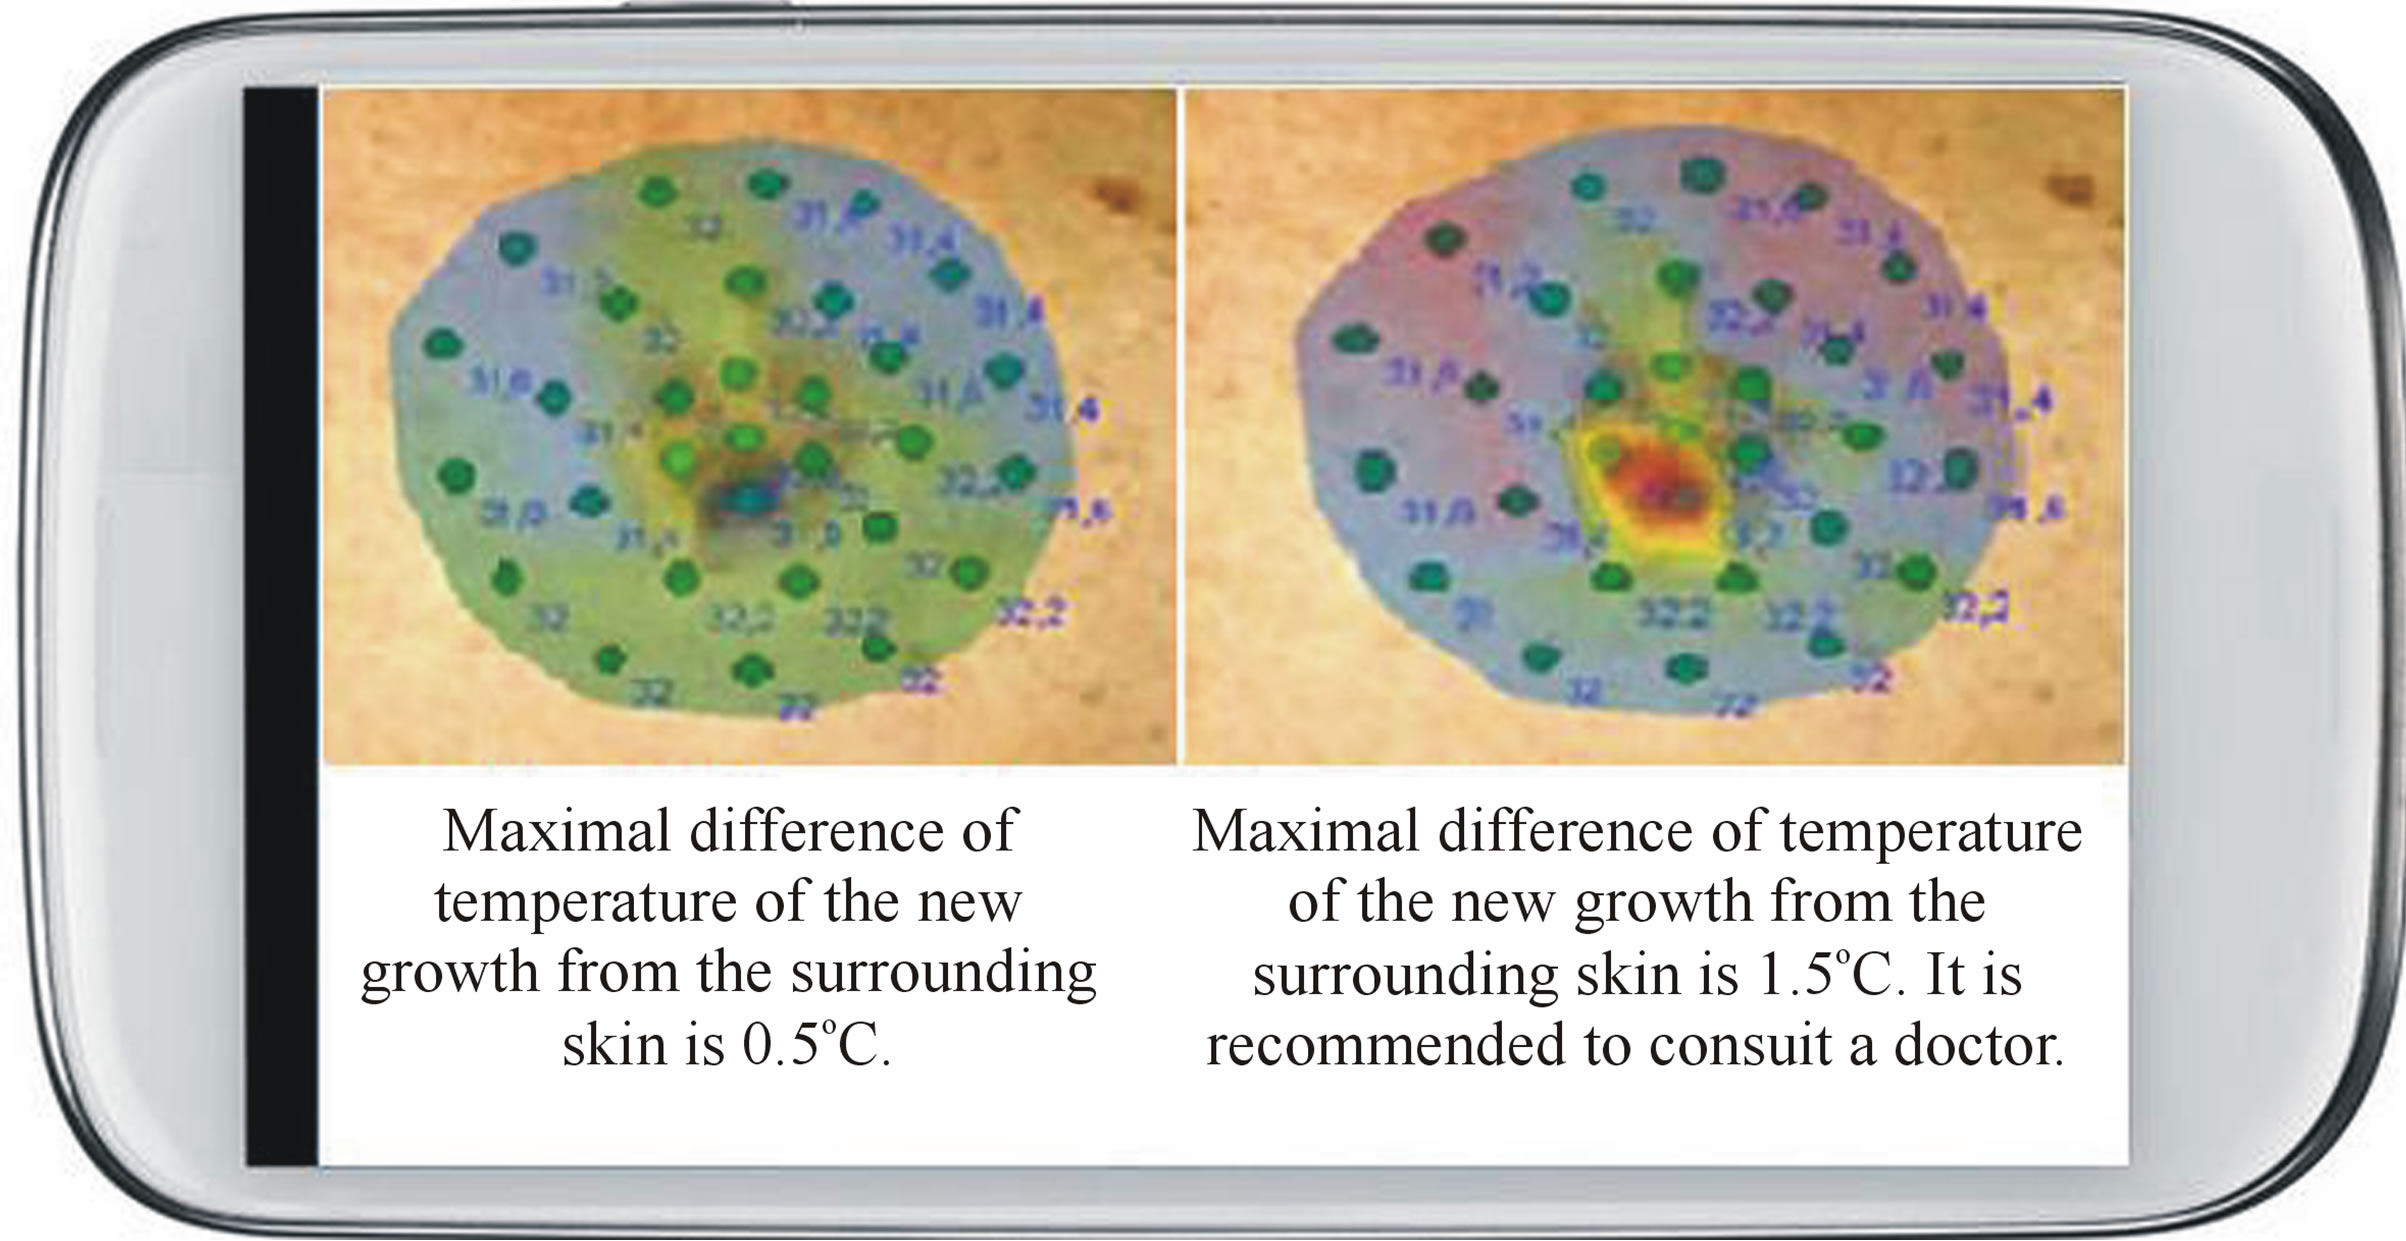
Figure 5. Thermomonitoring of nevus.
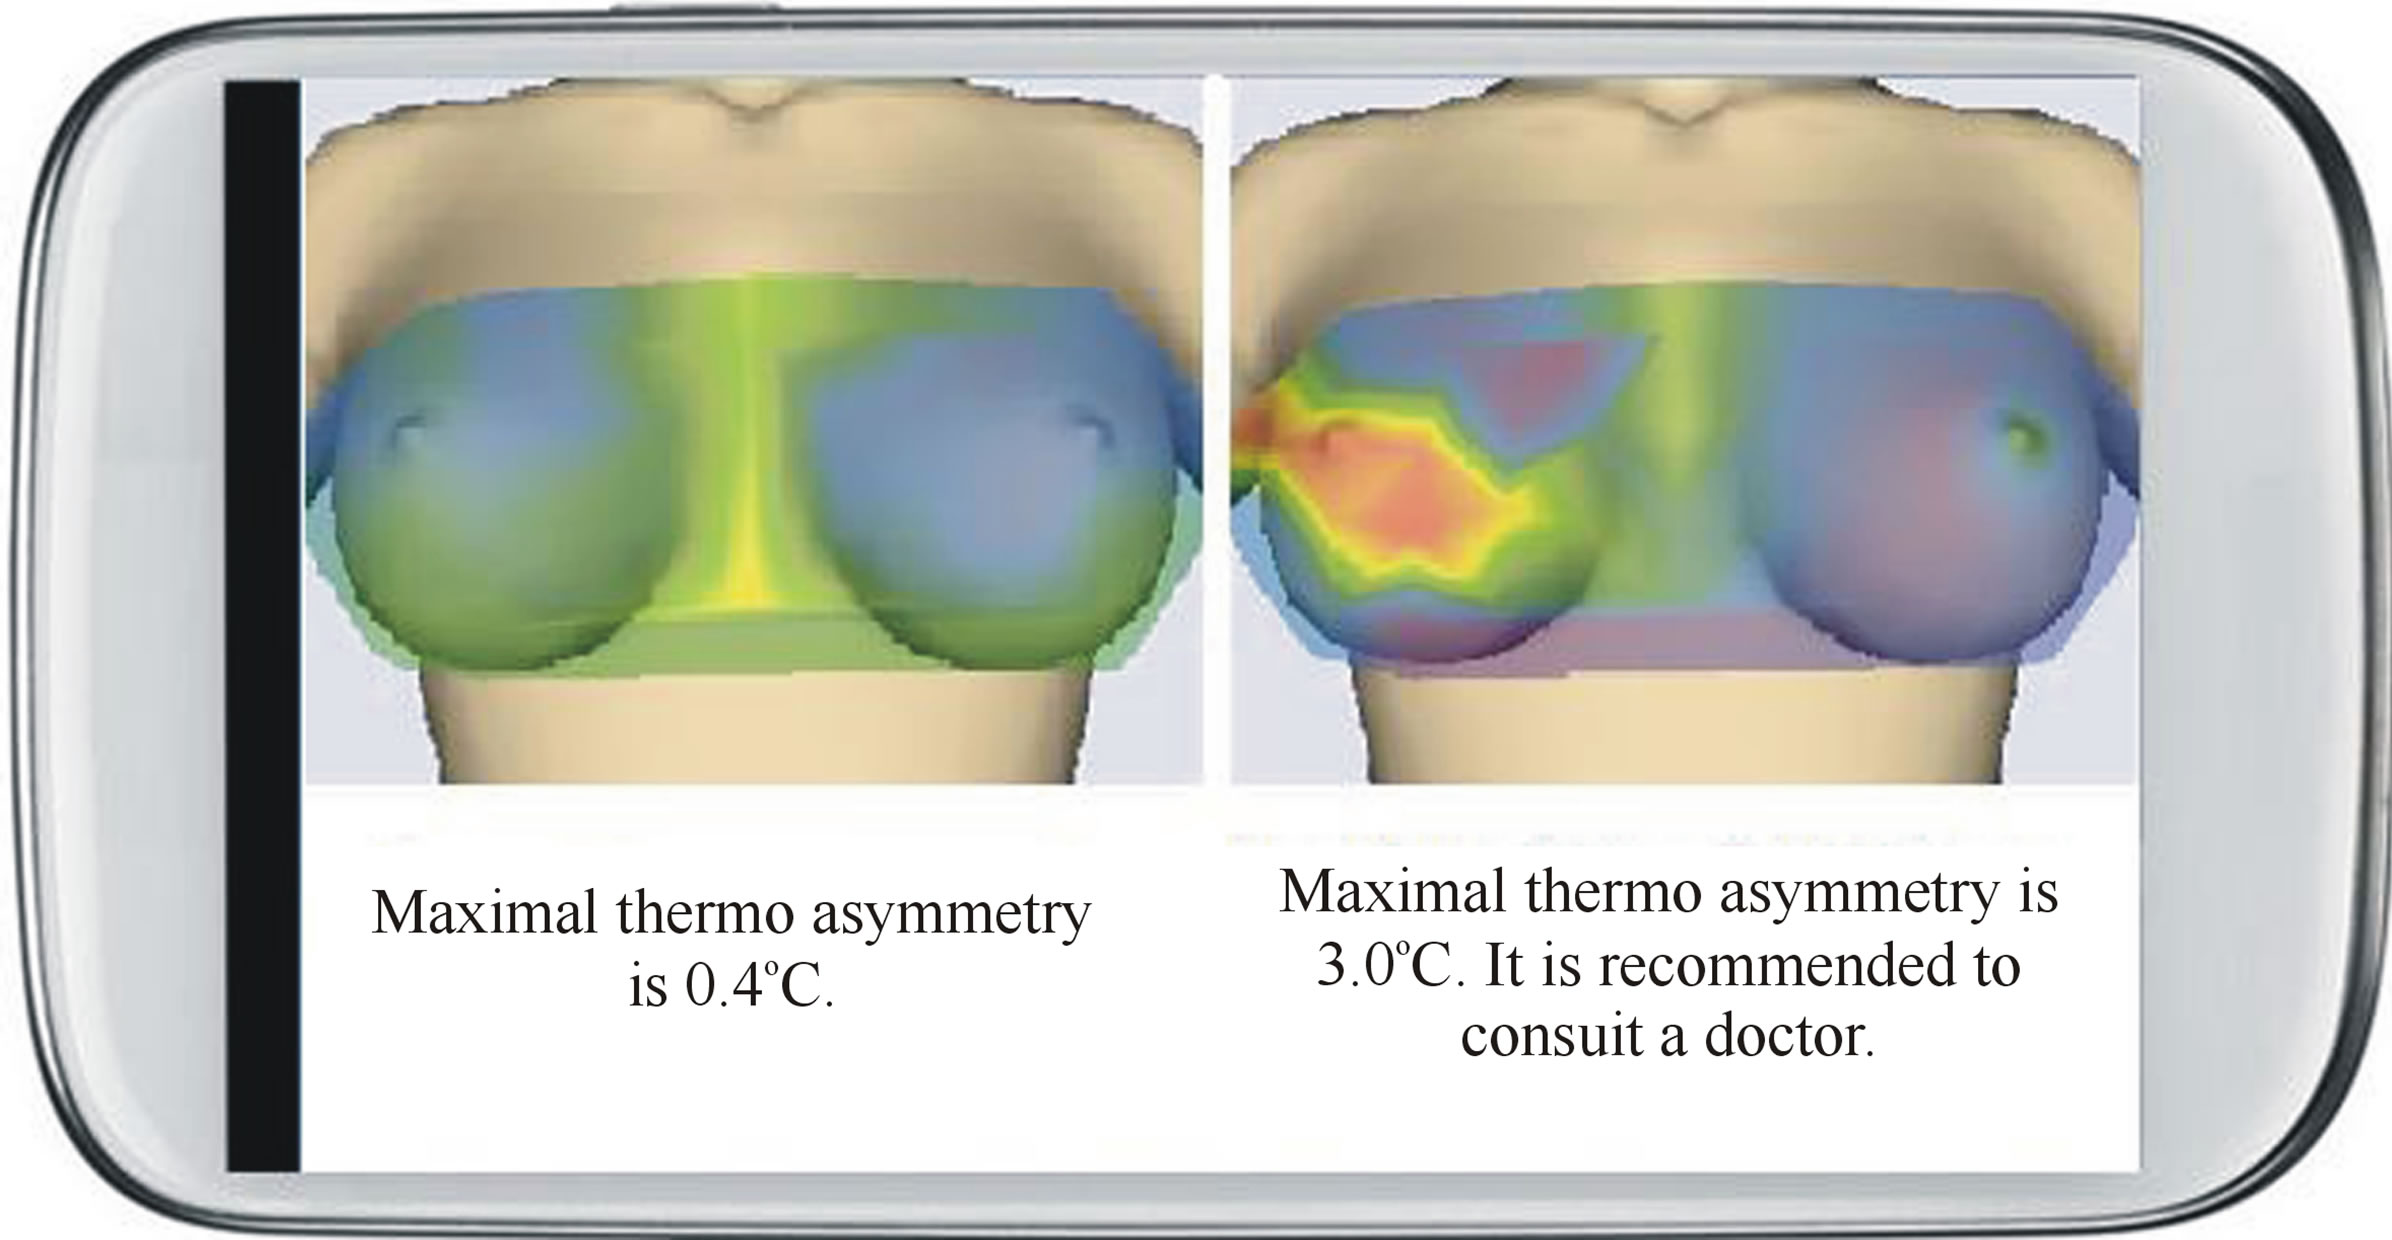
Figure 6. Thermomonitoring of mastopathy.
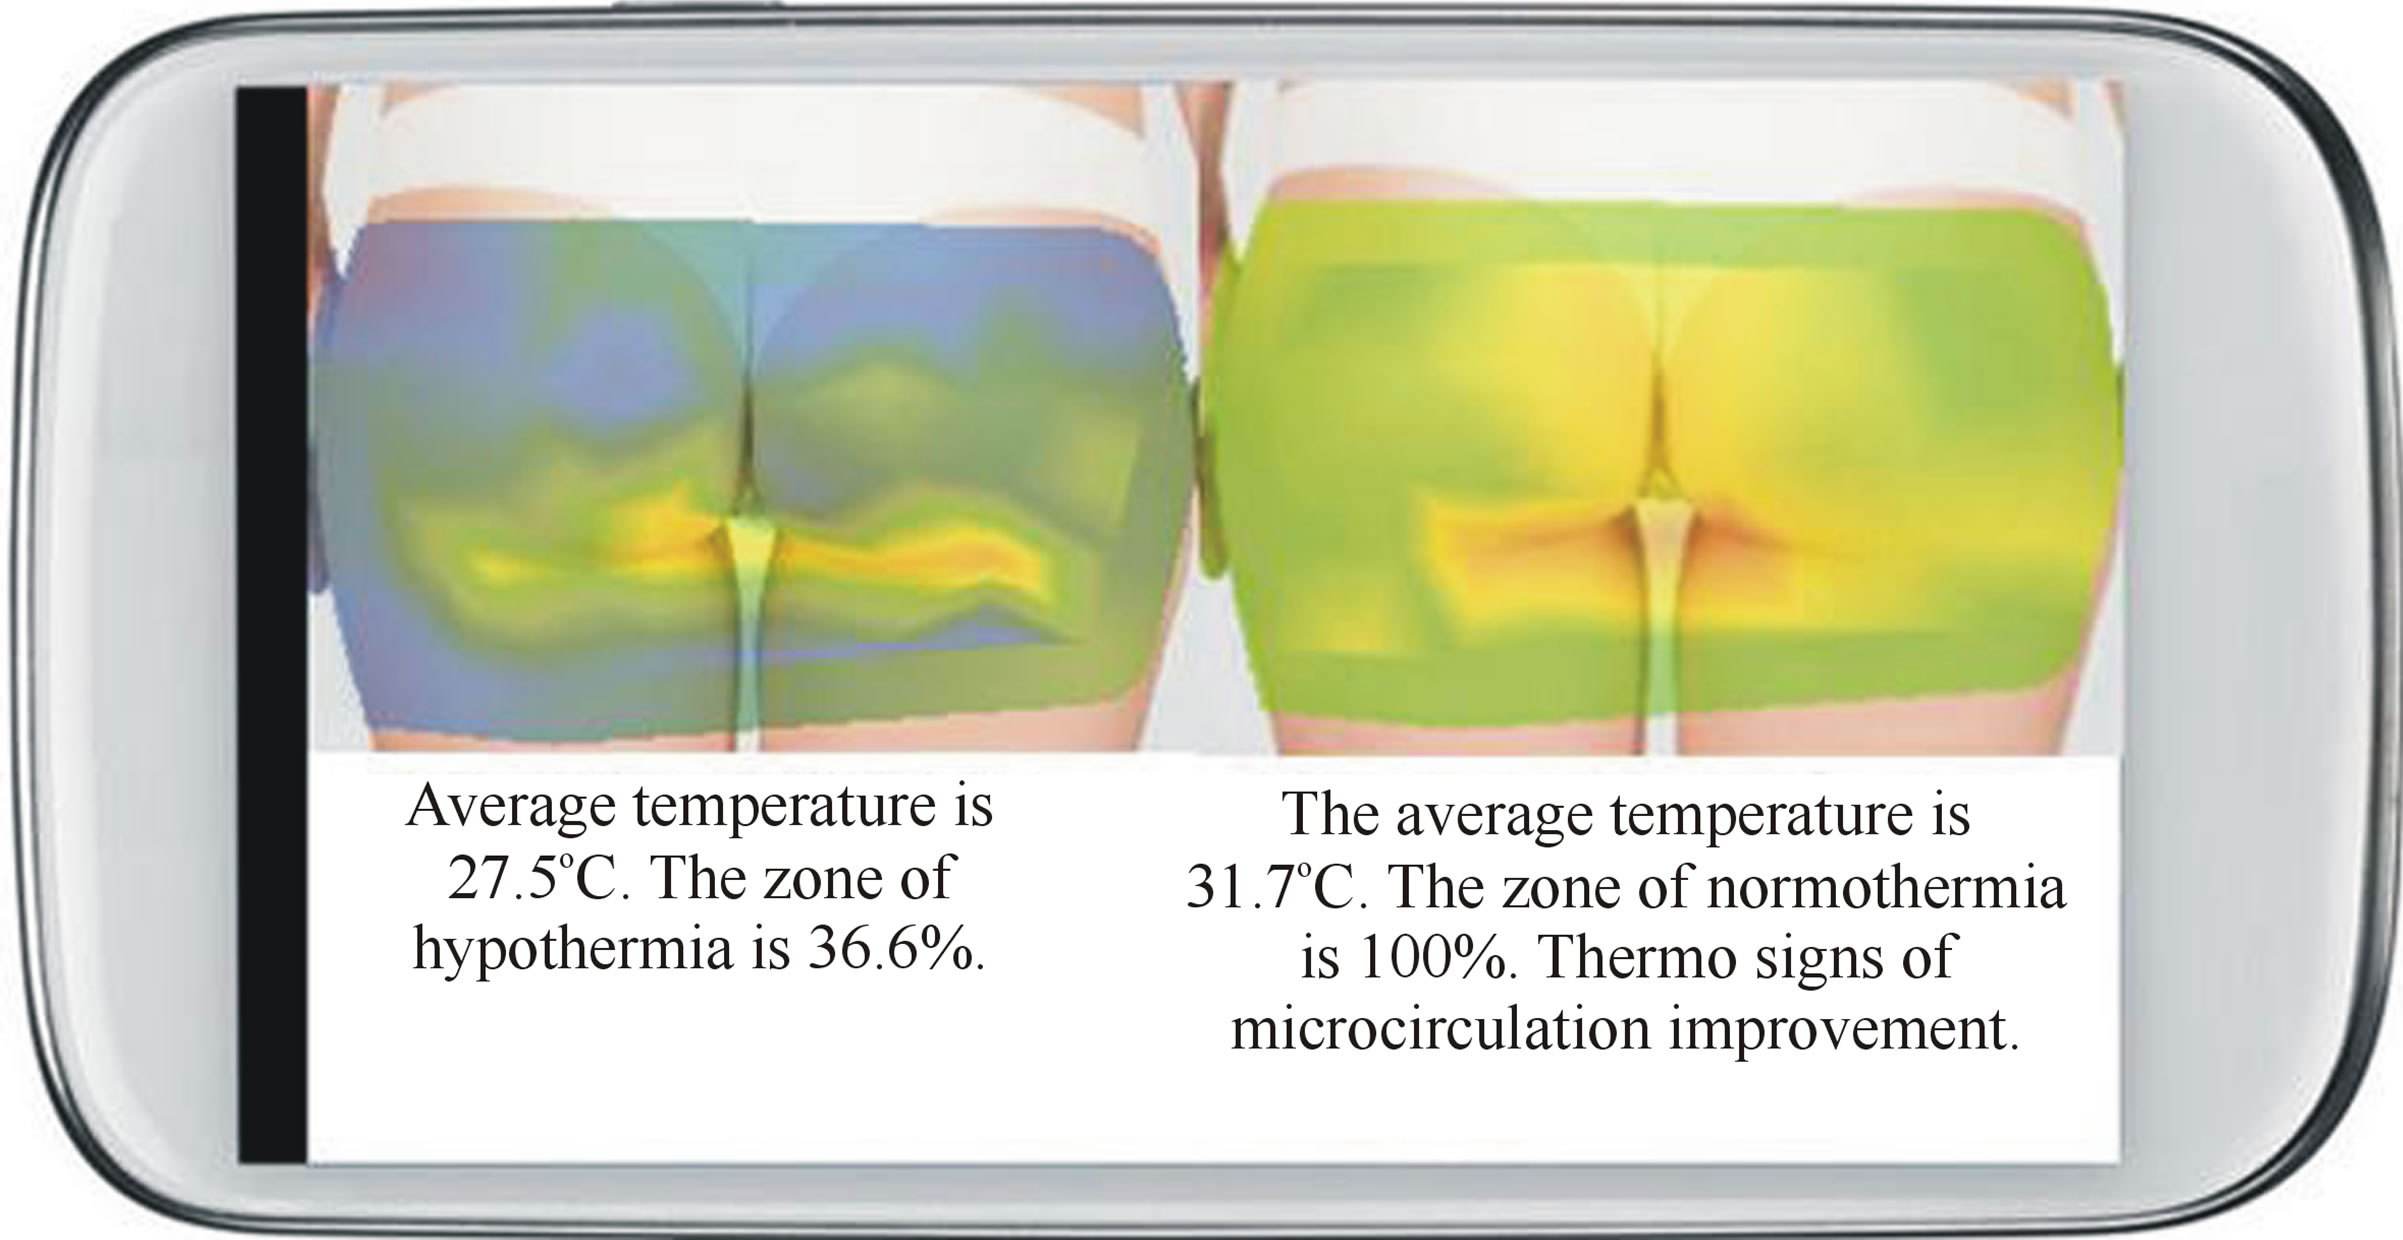
Figure 7. Thermomonitoring of cellulit.
ple, in areas covered by scalp, behind the ears, in the mouth, in the areas of contractures, skin folds and others.
● It allows to take temperature measurements and store temperature values of the points of the template and/ or thermogram needed for further analysis, at that, the unification of measurement procedure by the device provides the ability to use the same template for temperature measurement in repeated examination sessions and carry out valid comparison of the results of temperature measurements and/or thermograms taken at different times.
● It implements algorithms of the analysis of temperature values of the points of a template, thermograms and their comparison, and displays on the screen the thermograms, the results of their comparison, automatic conclusions and recommendations to the user. The algorithms are developed by the authors with regard to the well known scientific articles on thermography.
● It is easy to use at home for self-examination and monitoring of chronic diseases (inflammatory, vascular, tumor) by average person.
● The use of Smart Thermometer simplifies and reduces the cost of obtaining information about the course of a pathological process and/or the effectiveness of treatment for a large number of chronic diseases of organs, located close to skin surface and skin diseases (diseases of the joints, mammary and thyroid glands, paranasal sinuses, etc.).
Developed for the first time, Smart Thermometer Technology is reliable, easy to use and affordable technology for home monitoring of widespread diseases. Applications for patents for Smart Thermometer Technology were submitted in many countries and several patents were already obtained. We have made a pilot batch of Smart Thermometer and successfully carried out clinical tests for the device. Smart Thermometer Technology is in the stage of full technological readiness for serial production.
REFERENCES
- B. B. Lahiri, S. Bagavathiappan, T. Jayakumar and J. Philip, “Medical Applications of Infrared Thermography: A Review,” Infrared Physics & Technology, Vol. 55, No. 4, 2012, pp. 221-235. http://dx.doi.org/10.1016/j.infrared.2012.03.007
- R. N. Lawson, “Implications of Surface Temperatures in the Diagnosis of Breast Cancers,” Canadian Medical Association Journal, No. 75, 1956, pp. 309-310.
- N. Arora, D. Martins, D. Ruggerio, et al., “Effectiveness of a Noninvasive Digital Infrared Thermal Imaging System in the Detection of Breast Cancer,” The American Journal of Surgery, Vol. 196, No. 4, 2008, pp. 523-526.
- D. Mikulska, “Thermographic Examination of Cutaneus Melanocytic Nevi,” Annales Academiae Medicae Stetinensis, Vol. 55, No.1, 2009, pp. 31-38.
- D. Kennedy, T. Lee and D. Seely, “A Comparative Review of Thermography as a Breast Screening Technique,” Integrative Cancer Therapies, Vol. 8, No. 1, 2009, pp. 9- 16.