Open Journal of Biophysics
Vol.4 No.2(2014), Article ID:44020,12 pages DOI:10.4236/ojbiphy.2014.42006
A Lysozyme Concentration, pH, and Time-Dependent Isothermal Transformation Diagram Reveals Fibrous Amyloid and Non-Fibrous, Amorphous Aggregate Species
Lisa C. Burnett1,2, Benjamin J. Burnett2,3, Bin Li4, Samuel T. Durrance2,3, Shaohua Xu2,4*
1Department of Chemical Engineering, Florida Institute of Technology, Melbourne, Florida, USA
2Space Life Sciences Laboratory, Kennedy Space Center, Titusville, Florida, USA
3Department of Physics and Space Sciences, Florida Institute of Technology, Melbourne, Florida, USA
4Department of Biological Sciences, Florida Institute of Technology, Melbourne, Florida, USA
Email: *shaohua@fit.edu
Copyright © 2014 by authors and Scientific Research Publishing Inc.
This work is licensed under the Creative Commons Attribution International License (CC BY).
http://creativecommons.org/licenses/by/4.0/


Received 24 January 2014; revised 24 February 2014; accepted 3 March 2014
ABSTRACT
Deposition of aggregated protein is associated with many human diseases. The mechanism by which protein aggregate species cause cellular death remains unclear. A profile revealing protein aggregation products under a diverse set of conditions allows the search of novel aggregate products and potential pathogens. To achieve this end, an isothermal transformation diagram (ITD) of lysozyme aggregation was constructed. AFM, TEM, and Thioflavin T binding assays were used to analyze the aggregate species synthesized under a broad range of pH values, protein concentrations, and incubation times. Four states were found: 1) soluble protein species; 2) insoluble amyloid fibers; 3) insoluble amorphous aggregates; and 4) protein hydrogels. The hydrogel-a rises from aggregated amyloid fibers. This work is part of an effort to construct an array of ITDs reporting aggregation properties of many disease relevant proteins, including amyloid beta, tau, α-synuclein, and others involved in protein aggregation diseases. In addition, we propose hydrogel cyto toxicity as a potential novel mechanism in the pathogenesis of amyloid diseases.
Keywords:Phase Diagram; Alzheimer’s Disease; Prion; Dementia; Protein Aggregation; Self-Assembly; Hydrogel; Gel; Amorphous Aggregate

1. Introduction
Formation of amyloid fibers and their deposits are associated with diverse human diseases such as Alzheimer’s disease, Parkinson’s disease, Type 2 Diabetes Mellitus, and hereditary lysozyme amyloidosis [1] -[5] . In vitro, most proteins are capable of forming amyloid fibers under certain conditions, leading to the hypothesis that amyloid fiber formation is a generic property of proteins [6] . Constrained physiological conditions limit the number of proteins that form amyloid fibers in vivo to a few dozens, all of which are associated with some kind of human disease [1] .
Because of the diverse conditions and protocols used by different laboratories, various pathways have been proposed to describe how amyloid fibers are formed. Six hypotheses are outlined here [7] [8] . The misfolding theory (pathway I), posits proteins are first misfolded into an abnormal secondary structure, possibly catalyzed by a template or previously misfolded protein, and then assemble onto the tip of a growing fiber [9] . This theory resulted in part from the discovery that the predominant protein secondary structure detected in fibers is β-sheet, regardless of the original structure of the protein molecules [10] . The discovery of colloidal spheres by AFM was followed by the proposal of three new pathways (II-IV). In the modified misfolding pathway (II), proteins misfold and then assemble into fibers, although some misfolded proteins aggregate and form non-fibrous spheres as a byproduct [11] [12] . Under pathway III, a fraction of the spheres assemble into fibers with other spheres as byproducts [2] . This is distinct from pathway II in that the spheres are necessary on-path species for fiber formation. Under the colloidal aggregation theory proposed previously by this lab (pathway IV), proteins first aggregate into colloidal spheres, followed by assembly into a linear chain, which then evolves into a mature fiber [1] [13] . The detection of amorphous aggregates has led to the proposal of the amorphous pathway (V) in which the first step of aggregation is the formation of large (>1 micron) amorphous intermediates, which then evolve into fibers [14] [15] . Finally, in pathway VI both amorphous and fibrous aggregates are formed simultaneously and independently [16] [17] . An objective of this study is to determine if the aforementioned discrepancies are the result of the wide variety of experimental conditions used. If amyloid fibers may be formed under different conditions by different pathways, it is important to determine which pathway(s) is most relevant in vivo.
Three major differences among these hypotheses are: 1) the nature of amorphous aggregate formation and their role in fiber formation; 2) whether oligomers, a newly proposed pathogen [18] , are an intermediate of fiber formation or a byproduct; and 3) when and how the protein’s secondary structure transforms from native to cross-β-sheet. Most amyloid fibers are found to have predominantly cross-β-sheet structure regardless of the proteins’ native conformation and sequences, an apparent violation of Christopher Anfinsen’s theory that a protein’s conformation is dependent on its sequence [1] [19] .
Amyloid fibers have been detected by electron microscopy post mortem from most Alzheimer’s and Parkinson’s disease patients [20] . However, these fibers are undetectable in some Alzheimer’s disease cases, and are rarely found in prion disease, Huntington’s disease, and amyotrophic lateral sclerosis, all of which are well studied protein aggregation diseases [20] . Amorphous aggregate protein deposits formed by light-chain proteins have been found in the kidneys and are associated with light chain deposition disease [21] . α-Synuclein, the primary protein associated with Parkinson’s disease, has been shown to form both amorphous aggregates and amyloid fibrils in vitro [22] . In addition, cataract formation is thought to be a result of amorphous aggregation of crystalline substrates [23] . Taken together, this evidence suggests the formation of non-fibrous aggregates may be a pathogenic event in the development of amyloid diseases [24] . If amyloid fibers are not always present in protein aggregation diseases, it is of great value to determine what other pathogenic aggregate species are present and the mechanism by which these species contribute to the natural history of the disease. Amorphous aggregates are present in TEM images of both diseased brain tissues [25] [26] and amyloid beta aggregates formed in vitro [27] , but have not been rigorously scrutinized. Fibers and amorphous aggregates have been identified from TEM images of patients diagnosed with familial Alzheimer’s disease [26] , sporadic Alzheimer’s disease [25] [26] , progressive supranuclear palsy, and atypical senile dementia [26] .
To understand the multitude of pathways proposed by different groups for various proteins, we compiled an initial set of conditions that lead to the formation of four different protein species. This allows us to decipher conditions optimal for fiber formation and, conversely, to identify conditions that lead to the formation of amorphous aggregates or other structures. In the physical sciences such an organized presentation is called a phase diagram. Phase diagrams have been used to describe the aggregation behavior of crystalline materials in solution as well as changes of state in alloys, polymers, semiconductors and ceramics [28] . The relationship between solution conditions and the aggregation state can be compiled in a similar format, called an isothermal transformation diagram. Isothermal transformation diagrams are commonly used in engineering applications to represent non-equilibrium phase behavior.
In this paper, we analyzed the aggregates formed from the model protein lysozyme under an initial range of conditions of protein concentration, pH, and two time points. We found four states represented: 1) soluble protein, 2) amyloid fibers, 3) amorphous aggregates, and 4) protein hydrogels. We constructed a three-dimensional isothermal transformation diagram (ITD) to illustrate how the type of aggregate formed from lysozyme varies with protein concentration, pH, and incubation time. The isothermal transformation diagram constructed here is part of an eventual effort to construct an array of ITDs reporting aggregation properties of many disease relevant proteins, including amyloid beta, tau, and α-synuclein.
2. Material and Methods
2.1. Isothermal Transformation Diagram Construction
Lyophilized chicken egg white lysozyme, product number L6876, was obtained from Sigma Aldrich (St. Louis, MO). The protein was prepared at concentrations of 10 mg/ml, 20 mg/ml, 40 mg/ml, 70 mg/ml, and 100 mg/ml and pH values of 2.5, 3.0, 4.0, 5.0, 6.0, and 7.0. A 10 mM citrate buffer, pH 2.5, and a 10 mM phosphate buffer, pH 7.0, were used to create the aforementioned solutions. All samples were incubated in an Isotemp isothermal heat block at 55˚C. Upon incubation completion, the samples were either analyzed immediately or stored at −20˚C for future analysis. The final time point of the long-term aggregation ITD was approximated at day 96, an average of the two final incubation time points, day 78 and day 114. Conditions resulting in the formation of fibrous aggregates, hydrogels, and amorphous aggregates were repeated at least three times independently of the ITD study. The three-dimensional isothermal transformation diagrams were plotted using MATLAB version R2011a.
2.2. Sample Preparation for Aggregate Species Analysis
Immediately after vortexing, while aggregates were momentarily suspended in solution, a 1.5 ml aliquot was removed from the vial and centrifuged for 30 minutes at 3000 RCF, using an Eppendorf Centrifuge 5414c. A 0.8 ml aliquot of supernatant was removed from each sample. Supernatant samples were analyzed by UV absorbance at 280 nm for protein concentration.
2.3. Sample Preparation for Hydrogel Analysis
Lysozyme was dissolved in water at 60 mg/ml, adjusted pH to 2.5 with diluted HCl. The charged residues in lysozyme provide buffering capacity while dissolution in HCl minimizes salt concentration. High salt concentration and salt induced artifacts can decrease AFM image quality in air, contact mode. After 45 days of incubation in an isothermal IsoTemp heat block, set at 55˚C, 7.5 ml of protein sample was centrifuged at 12,100 RCF for 80 minutes. 4.5 ml of supernatant was collected from each sample. The pellets were then centrifuged for an additional 20 minutes. Any remaining supernatant was discarded. DI water (2.0 ml) was then added to each tube and the samples were centrifuged for an additional 20 minutes. The washing step was repeated once more for the pellet and the final supernatant was discarded. DI water (2.0 ml) was added to each tube. The samples collected were stored in 15 ml plastic conical tubes and were kept on ice until the next analysis step.
Supernatants were next subjected to centrifugal filtration, using Millipore Centricon Plus-70 100 kDa NMWL Swinging Bucket filters. The filtration units were first rinsed with 70 ml of Milli-Q water for 5 minutes at 3500 RCF. To remove all water, an invert spin was next performed at 1000 RCF for 2 minutes. Samples were diluted 2x and were centrifugally filtered using a Thermo Forma Refrigerated Swinging Bucket Centrifuge at 3500 RCF for 20 minutes. An invert spin was performed at 1000 RCF for 2 minutes in order to collect retentate. Samples were kept on ice or frozen until the next analysis step.
2.4. Thioflavin T Binding Assay
Thioflavin T binding assays were performed on both the supernatant samples and the bulk samples [29] . A 3.0 mM stock solution of Thioflavin T was prepared using pH 7.0, 10 mM phosphate buffer. A working solution, 100 μM Thioflavin T, pH 7.0, was used. The final protein concentration was about 20 μg/ml and the final ThT concentration was 60 μM. A Biotek Synergy 2 microplate reader was used with black, OptiPlate-96F microplates for quantification of fiber concentration. The excitation wavelength was 440 nm and the emission wavelength was 485 nm. Data was collected using Gen5 Software and was exported into and analyzed in GraphPad Prism 6 for Mac OS X Version 6.0b.
2.5. AFM Imaging
Samples for AFM were prepared following a modified procedure of conventional specimen preparation for imaging [13] [30] [31] . Freshly peeled mica was treated with 10 μl of 0.1 N NaOH. Subsequently, 10 μl of amyloid fiber solution, amorphous aggregate solution, or hydrogel sample was applied to the mica surface. After 10 minutes of incubation at ambient conditions, the mica was gently rinsed with 2 ml of de-ionized water by allowing water to flow slowly over the mica surface to remove salts and unbound proteins. Excess water was removed by capillary force with a Kimwipe tissue. The surface was air dried overnight.
AFM imaging was performed with a Molecular Imaging Picoscan Plus atomic force microscope in contact mode, using standard thin-leg Si3N4 cantilevers. Imaging generally began in a 5 × 5 mm2 area. When stable images were obtained, the scanning force was minimized by a reduction of the set point voltage, and the scanning area was changed to the desired size. The raw data were plane-fit. Particle height was measured with the off-line data analysis program. Vertical and horizontal AFM measurements were calibrated with slides of deposited monodisperse NIST-traceable polyethylene spheres of 21, 30, 50, 200, and 450 nm diameters (Bangs Laboratories, Inc., Fishers, IN).
2.6. TEM of Lysozyme
A 3 μl aliquot of sample solution was applied to a Formvar TEM grid. After an incubation of 3 - 4 min, the grid was rinsed with 30 - 40 μl of de-ionized water, then stained with 4 - 5 μl of 2.5% UrAc for 1 min, and rinsed with water again. A Kimwipe was used to remove excess liquid by capillary force after each of the previous steps. Finally, the grid was air dried and stored for TEM. TEM was carried out using a Zeiss EM 900. Digital images were captured with a Morada Soft Imaging System.
3. Results
The protein isothermal transformation diagram in Figure 1 illustrates the conditions (pH, protein concentration, and incubation time) under which lysozyme forms diverse aggregate species, including: amyloid fibers, amorphous aggregates, or hydrogels, in the context of the condition set tested. Lysozyme was chosen as a model protein for the construction of the ITD because of the rich repository of structural and biochemical knowledge available for this protein. Moreover, mutations in human lysozyme are associated with lysozyme amyloidosis [3] -[5] [32] [33] . In addition, human lysozyme and HEWL have been shown to form amyloid fibers in vitro [34] -[37] . Lysozyme molecules were incubated at 55˚C under various pH and protein concentration conditions and were subsequently harvested at different time points for structural, morphological and biochemical analyses. It should be noted that acidic hydrolysis of protein is not significant in the lower pH conditions used in the study (pH 2.0 to 3.0) [38] -[40] .
The ITD of lysozyme demonstrates that pH and protein concentration are both major drivers of aggregate morphology (Figure 1). At time point zero all samples were clear and soluble; no visible aggregates were present (black circles, Figure 1(B)). After an extended period of incubation at 55˚C, different structures evolved in the samples. The distinct visual appearances of the samples after incubation are depicted in Figure 1(A). Aggregated samples (Figure 1) were classified into four categories based on macroscopic observations: 1) soluble protein, a clear, non-viscous liquid, no aggregate species were observed in this phase (black circles), 2) fibrous aggregates, a clear soluble phase and a phase of insoluble fibrous aggregates (green circles), 3) a protein hydrogel, a gelatinous phase slightly yellow in color and extremely viscous (red circles), and 4) amorphous aggregates, a clear, soluble phase and an insoluble phase of opaque, white aggregates (blue circles). AFM, TEM,
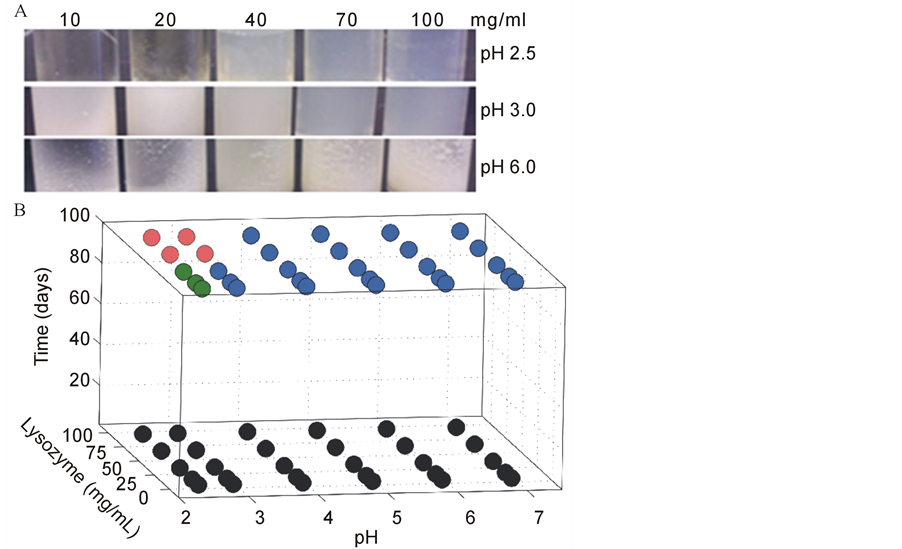
Figure 1. Lysozyme ITD reveals distinct aggregate morphologies. A) Divergent macroscopic appearance of samples at final incubation. Representative images illustrate the difference in sample appearance at the end of incubation. Conditions shown in the representative images are of lysozyme at 10, 20, 70, and 100 mg/ml, which were incubated, at 55˚C, in small glass vials in a 10 mM phosphate-citrate buffer at pH 2.5, 3.0, and 6.0 for an average of 96 days. Hydrogels (red) formed when lysozyme of 70 and 100 mg/ml was incubated at pH 2.5 or 3.0. Fibers (green) formed for concentrations of 10 to 40 mg/ml lysozyme at pH 2.5; the sample mixture remained in the fluid state. All other conditions led to opaque, amorphous aggregate formation (blue). B) Three dimensional isothermal transformation diagrams. The incubation time was on average 96 days, pH from 2.5 to 7.0, and lysozyme concentration was from 10 to 100 mg/ml. All samples exhibited the same soluble phase behavior at time zero (black). Upon incubation completion, samples diverged to three distinct phases: 1) a mixture of fibrous aggregates and clear solution (green); 2) a mixture of opaque, amorphous aggregates and clear liquid (blue); 3) a protein hydrogel (red).
and ThT binding assays confirmed the initial phase classifications based on macroscopic observations (Figures 2-4).
Fibrous aggregates formed in a very narrow range of pH conditions and lysozyme concentrations (Figure 1(B), green). Samples at pH 2.5 and lysozyme concentrations of 10 mg/ml, 20 mg/ml, and 40 mg/ml formed a mixture consisting of a clear, soluble phase and a phase of fibrous aggregates. TEM, AFM, and ThT binding confirmed that these fibrous aggregates are amyloid fibers (Figures 2, 4). After extended incubation, samples at pH 2.5, 3.0 and lysozyme concentrations of 70, 100 mg/ml transformed into a viscous, gelatin-like state referred to as a hydrogel (Figure 1(B), red). This name was given due to the sample’s high viscosity and gel-like consistency.
The majority of sample points on the ITD transformed to a mixture that contained a clear, soluble phase, and a phase containing opaque, white amorphous aggregates (Figure 1(B), blue). These aggregates are called amorphous because macroscopically they appear similar to aggregates that form immediately upon mixing lysozyme and SDS in an appropriate ratio to cause precipitation. Macroscopically and under examination by TEM, amorphous aggregates appear to have a disorganized, fractal-like nature (Figure 3(A)).
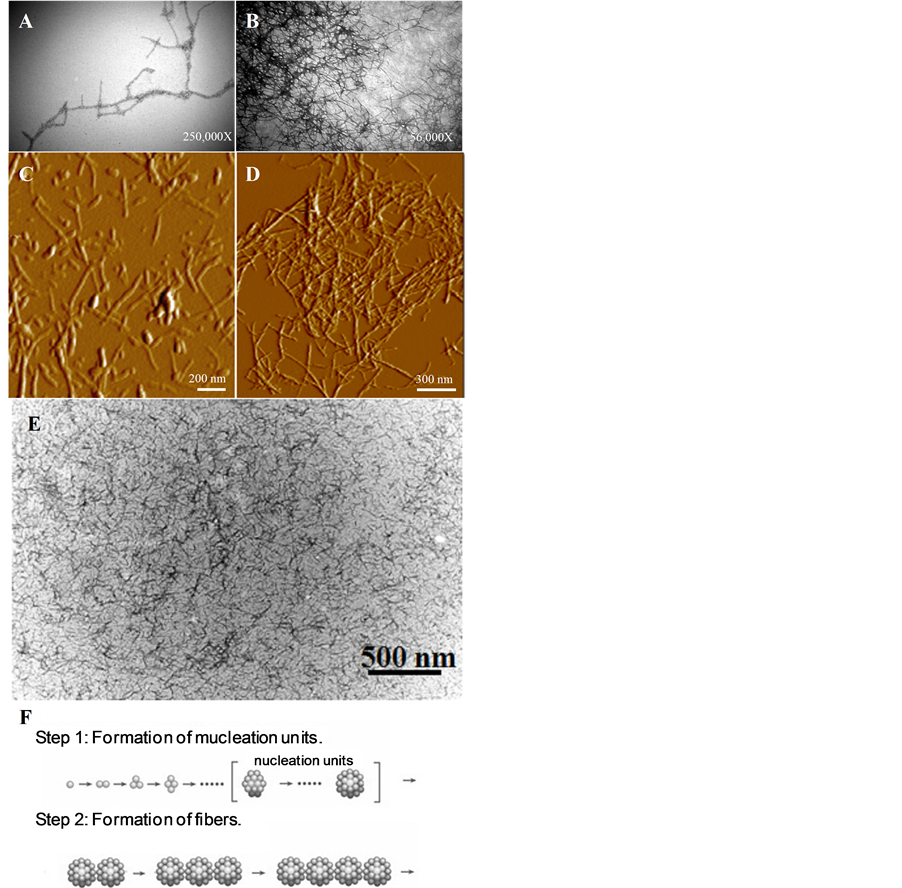
Figure 2. TEM and AFM images of fibrous aggregates, amorphous aggregates, and hydrogels. A, B) TEM images of later stage lysozyme aggregates after 10 days, A), and 26 days, B), of 55˚C incubation at pH 2.5 and 10 mg/ml. Note the linear morphology of the spherical aggregates and their appearance as “beads on a string.” C) and D) Representative AFM images of the lysozyme aggregates formed as described in A), and B) respectively. These images revealbeaded fibers and spheres, C), as well as an agglomerate of lysozyme fibers, D). E) TEM analysis of the hydrogel phase shows a highly dense mixture of fibrous species. F) The distinct morphologies observed at varying degrees of fiber maturation are consistent with the colloidal model of amyloid fiber aggregation.
Structural characteristics of the aggregated species were further investigated by high-resolution microscopy. TEM images of the fibrous aggregates formed at pH 2.5 show an unbranching, rod-like morphology with significant bending, twisting, and self-association (Figure 2(A)). Additional analysis by AFM revealed the presence of both fibrous aggregates as well as spherical species (Figure 2(C)). The individual fibers appear to have a non-branching structure, suggesting that a linear aggregation process is responsible for their formation, which is consistent with the linear colloidal aggregation model (Figure 2(F)) [1] . Groups of many fibers appear to associate with one another in Figures 2(B) and (D). A representative image of the protein hydrogel phase is shown in Figure 2(E). Note the high density of fibrous species and the close self-association amongst fibers.
Similar to what has been reported for tau fiber formation, we predict that under these conditions lysozyme may initially aggregate by forming colloidal spheres, however, further experiments are necessary to prove this hypothesis [30] . Nascent fibers may then form through the linear self-assembly of the colloidal spheres, appearing as beads on a string [1] [30] . The size of the spheres assembled into fibers is comparable to the size of the free spheres, and the density of the free spheres may initially increase and then decrease as they form fibers. Kinetic analysis indicates that fiber formation can be promoted by either seeding or physical agitation, factors well known to accelerate colloidal aggregation [37] . Although conditions that induce aggregation vary among different proteins, fiber formation appears to be a generic property of peptides and proteins [7] .
In addition to amyloid fibers, fractal-like amorphous aggregates have also been reported from pathology sections of familial Alzheimer’s, sporadic Alzheimer’s, and atypical senile dementia patient brain tissue [25] [26] . The fractal-like, amorphous aggregates observed from our in vitro study (Figure 3(A)) appear similar to those observed by Yagishita, et al., (Figure 3(B)) from the brains of patients diagnosed with atypical senile dementia [26] . The uniquely fractal-like morphology suggests that the aggregation process by which these amorphous aggregates evolved was non-linear, and followed a distinctly different pathway of aggregation from the fibers formed under acidic conditions (Figure 2).
ThT binding assays were performed to further characterize the protein aggregate species. Utilizing the high affinity with which Thioflavin T binds to amyloid fibers, we investigated the structural species of the lysozyme protein aggregates observed in the ITD described above (Figure 1). Per unit of protein, the amorphous aggregates (AA) exhibited a small amount of ThT binding (Figure 4(A)). It is not clear if such ThT binding is attributed to the amorphous aggregates or to a small amount of amyloid fibers present but not detected by AFM or TEM. The fibrous aggregates (F) showed strong ThT binding and fluorescence intensity yielding a 2.6-fold increase in fluorescence intensity over the opaque amorphous aggregate samples (P = 0.03), further confirming that these fibrous aggregates are amyloid fibers. The hydrogel samples exhibited the highest degree of fluorescence intensity per unit of protein, exhibiting more than 7 times the fluorescence intensity of amorphous aggregates (P < 0.0001) and 3 times the fluorescence intensity of fibrous aggregates (P < 0.0001). This provides supporting evidence of the TEM analysis that the protein hydrogel phase is made up of fibrous aggregates (Figure 2(E)) and suggests that at a critical concentration, a highly dense mixture of amyloid fibers may transition to the hydrogel phase.
To further investigate the composition of the protein hydrogel phase, its constituent species were separated according to molecular weight, as described in the methods section. As seen in Figure 4(B), the filtrate of the hydrogel shows negligible fluorescence intensity, while the pellet shows a high degree of fluorescence intensity. The pellet had 50-fold greater fluorescence intensity than the filtrate (P < 0.0001), and 7-fold greater fluores-
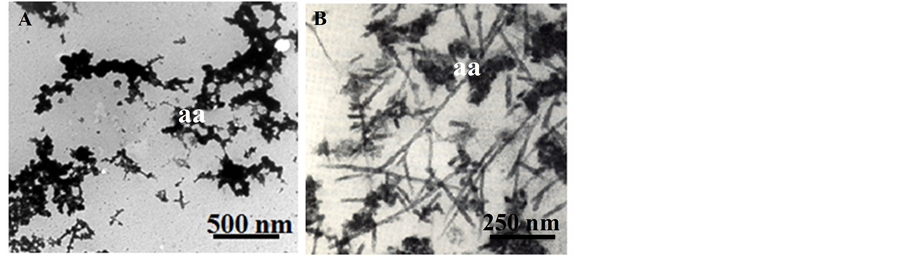
Figure 3. TEM of amorphous aggregates (aa). A) The fractal-like nature of lysozyme amorphous aggregates suggests a non-linear aggregation pathway. B) Similar fractal morphologies of amorphous aggregates are also observed in AD patient pathology. The amorphous aggregates shown in panel B, which formed in vivo, are found in alongside fibrils. The TEM image in panel B is adapted from Yagishita, et al., 1991 [25] [26] .
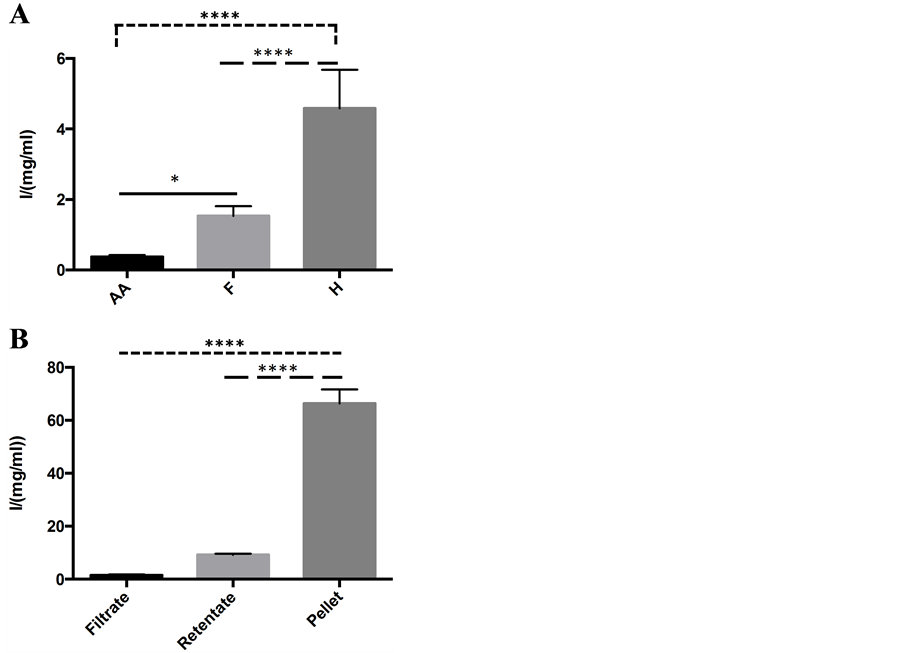
Figure 4. Thioflavin T amyloid fiber binding assay confirms the presence of amyloid fibers (F). A) ThT binding to three distinct protein aggregation states. Fluorescence intensity per unit protein was lowest in the amorphous aggregate (AA) phase as compared to fibers (F) and hydrogels (H), suggesting that few, if any amyloid fibers are present in the amorphous aggregate samples. Fluorescence intensity per unit protein was greatest in the hydrogel phase (H), suggesting a large population of lysozyme amyloid fibers. B) Distinct ThT binding to the separated components of the lysozyme hydrogel. Protein species were separated by molecular weight after 45 days incubation. The pellet shows the greatest amount of fluorescence intensity. Day zero species control experiment showed negligible fluorescence intensity and did not form a pellet. Error bars represent SEM. **** = P < 0.0001; * = P < 0.05.
cence intensity than the retentate (P < 0.0001). The consistency of the hydrogel pellet was extremely viscous and gelatinous. The control sample was not incubated at 55˚C and showed no pellet upon centrifugation, as well as, negligible ThT binding. The high fluorescence intensity of ThT upon exposure to the hydrogel pellet suggests that it is composed of amyloid fibers. Notably, hydrogel formation has also been reported for other amyloidogenic proteins [41] -[44] . Upon heating, the hydrogel proved to be thermoreversible, as it gained a fluid consistency. This suggests that intermolecular forces and not chemical bonds are responsible for hydrogel formation. Independent experiments conducted at lysozyme concentrations of 60 mg/ml, pH 2.5, incubated for 45 days show that these conditions also lead to the formation of a hydrogel. Similarly, 10 mg/ml lysozyme incubated at pH 2.0 for one year transforms to the hydrogel state as well. In the aggregate, these data suggest that given proper incubation time, mixtures of lysozyme amyloid fibers at an acidic pH in a range of concentrations (10 mg/ml to 100 mg/ml) can evolve to a viscous, protein hydrogel state.
4. Discussion
An isothermal transformation diagram was constructed to provide an overview of how lysozyme aggregate morphologies and their phase transitions are dependent on the conditions that induce the protein’s aggregation, including pH, incubation time, and protein concentration. TEM and AFM identified two distinct aggregate species: amyloid fibers and amorphous aggregates (Figures 2, 3). TEM examination of the hydrogel phase showed a dense population of fibers.
The detection of the amorphous aggregates or fractals in the aggregation product raises the question as to whether such aggregates are also responsible for the pathogenesis of some protein aggregation diseases, especially in cases where pathogenic analysis of the diseased tissue revealed little amyloid fibers, such as in cataracts [45] . Based on the ITD, opaque, amorphous aggregates or fractals formed under a broader set of the experimental conditions than did amyloid fibers or protein hydrogels. Amyloid fibers, including hydrogels, formed in a very narrow range of pH and lysozyme concentrations. Only samples incubated at pH 2.5 for all lysozyme concentrations tested or at pH 3.0 for lysozyme at concentrations of 70 mg/ml and higher formed amyloid fibers.
The amorphous aggregates formed much faster than the fibrous aggregates and the hydrogels; amorphous aggregate formation could be seen after only 8 hours of incubation. When analyzed by TEM, these samples have fractal-like morphology (Figure 3(A)). The fast formation of amorphous aggregates is in contrast with the slow process of fiber formation, which often requires seven days of incubation before any amyloid fibers can be detected, under the experimental conditions used in this study.
Protein hydrogel formation was observed at pH 2.5, 3.0 and lysozyme concentrations of 70, 100 mg/ml in the isothermal transformation diagram. Hydrogels also formed in independent experiments carried out at 60 mg/ml lysozyme, pH 2.0 and 45 days incubation as well as 10 mg/ml and 365 days of incubation. Recently, we also observed that the inclusion of salt substantially shortens the gelation time to ≤5 days under similar pH conditions and protein concentrations (unpublished data). Extended fiber incubation seems to increase the probability that singular or loosely associated amyloid fibers will transform to a hydrogel. Although further investigation is needed, these results suggest that an increased fiber concentration is essential for hydrogel formation.
We note that heat is sufficient to melt the hydrogel suggesting that weak, non-covalent bonds formed a physical gel. We speculate that an extended hydrogen bond network exists between individual fibers, as well as between fibers and water. The hydrogel forms faster at higher concentration of lysozyme, suggesting that a critical concentration of fibers is necessary in order for gelation to occur. Further experiments are required to evaluate the mechanism by which fibers self-assemble into hydrogels.
We speculate that the formation of a hydrogel may provide a novel hypothesis as to why the accumulation of amyloid fibers is pathologically associated with cell death in neurodegenerative diseases such as Alzheimer’s. It is known that amyloid fibers have a high propensity to self-associate and are typically found as neurofibrillary tangles and plaques from pathological analyses [46] . The hydrogel state has greater viscosity than soluble proteins or amyloid fibers at similar concentrations. If amyloid proteins were to form a hydrogel, this would drastically increase cellular viscosity and reduce cellular diffusivity, which is vital for biological function and metabolism. The reduced diffusivity may also contribute to the deposition of other molecules found on plaques and tangles of amyloid proteins [47] [48] . Injection of amyloid fibers into cells has little effect on cell viability, which would be anticipated if diffuse amyloid fibers impose less impedance on molecular diffusion than a viscous hydrogel might [49] . The hydrogel phase may represent a more complete amyloid fiber self-assembly reaction than the formation of singular amyloid fibers or the loose association of amyloid fibers. Aβ (16-20), α-synuclein curly fibers, and β-lactoglobulin are also reported to form amyloid fiber-based hydrogels in vitro [41] [43] [44] .
The isothermal transformation diagram also provides new information that allows for critical analysis of the existing models of amyloid fiber formation. Model V and VI both require the formation of amorphous aggregates, which then evolve into fibers. However, the presence of amorphous aggregates in vivo remains a matter of debate and the evidence for a complete evolution of amorphous aggregates to amyloid fibers needs to be established. This study found no evidence of fiber evolution from amorphous aggregates after three months of observation. Upon formation of amorphous aggregates, individual proteins interact with neighboring proteins and have limited space and increased spatial hindrance for structural change. Conformational change for individual protein molecules in an amorphous aggregate structure may be more difficult than for soluble protein monomers. If evolution from amorphous aggregates to fibers occurs, it is expected to be a very slow process, as the energy required for a conformational change to the cross-β-sheet structure is substantially larger for amorphously aggregated proteins than soluble protein monomers.
The faster kinetics and different products at pH 4.0 and above compared to that at pH 2.5 suggests different pathways of aggregation. Since amyloid fibers are cross-β-sheet structure, it is of interest to know if a major conformational change also occurred in amorphous aggregates forming at ≥pH 4.0. Acidic pH can promote conformational change and make lysozyme positively charged. Lysozyme carries more positive charges at pH 2.0 than at pH 4.0. Coulomb repulsion may explain the slower aggregation kinetics at pH 2.5 and 3.0 than at ≥pH 4.0. The aggregation at ≥pH 4.0 may result from reduced Coulomb repulsion, while at pH 2.5 and 3.0, lysozyme unfolding and hydrophobic interactions may have played a leading role. The increased protein unfolding and Coulomb repulsion at pH 2.5 and 3.0 likely permits enough time for lysozyme to adopt a new conformation as the aggregation occurs. Aggregation provides the energy for the major conformational change of lysozyme from their native conformation to a predominant cross-β-sheet structure. The cross-β-sheet conformation may therefore represent a lower energy state for the aggregated structure. It remains to be determined to what extent the fractal-like amorphous aggregates can evolve to a cross-β-sheet structure and whether or not amyloid fiber formation will occur.
The amyloid aggregation ITD reported here is, to our knowledge, the first of its kind. In the future, it is of interest to characterize the aggregation properties of other proteins such as amyloid beta, tau, and α-synuclein. Further characterization of the amorphous aggregate and hydrogel phases observed may provide valuable insight into protein aggregation properties. The observation of the hydrogel phase and its hypothesized implication in human disease merits further study.
5. Conclusions
An isothermal transformation diagram was constructed to illustrate the different aggregate morphologies of lysozyme protein aggregation. Under the various conditions tested, distinct species were observed including: amorphous aggregates, amyloid fibers, and protein hydrogels. The protein hydrogels were composed of a dense population of fibers. Taken together, we hypothesize that the formation of a hydrogel in vivo may reduce cellular diffusivity and may be associated with the pathology of amyloidosis diseases. ITDs may serve as a useful tool for elucidating conditions responsible for the formation of different aggregate species for other amyloidogenic proteins, including amyloid beta, tau, and α-synuclein.
Acknowledgements
The authors thank Dan Woodard, M.D., of Kennedy Space Center, Dr. Yekaterina Lin, Dr. Clayton J. Baum, Dr. NasriNesnas, and Dr. James Brenner of Florida Institute of Technology for insightful advice and discussion. The authors are also grateful to Gayle Duncombe and to Dr. Michael Grace at Florida Institute of Technology for the use of imaging core facilities and technical assistance. The authors thank Florida Space Research Institute, the Community Foundation for Brevard, NASA, Florida Space Grant Consortium, and Space Florida for funding.
References
- Xu, S. (2007) Aggregation Drives “Misfolding” in Protein Amyloid Fiber Formation. The International Journal of Experimental and Clinical Investigation: The Official Journal of the International Society of Amyloidosis, 14, 119-131.
- Haataja, L., et al. (2008) Islet Amyloid in Type 2 Diabetes, and the Toxic Oligomer Hypothesis. Endocrine Reviews, 29, 303-316. http://dx.doi.org/10.1210/er.2007-0037
- Pepys, M., et al. (1993) Human Lysozyme Gene Mutations Cause Hereditary Systemic Amyloidosis. Nature, 362, 553-557.
- Yazaki, M., Farrell, S. and Benson, M. (2003) A Novel Lysozyme Mutation Phe57Ile Associated with Hereditary Renal Amyloidosis. Kidney International, 63, 1652-1657. http://dx.doi.org/10.1046/j.1523-1755.2003.00904.x
- Granel, B., et al. (2006) Lysozyme Amyloidosis: Report of 4 Cases and a Review of the Literature. Medicine, 85, 66-73. http://dx.doi.org/10.1097/01.md.0000200467.51816.6d
- Straub, J. and Thirumalai, D. (2011) Toward a Molecular Theory of Early and Late Events in Monomer to Amyloid Fibril Formation. Annual Review of Physical Chemistry, 62, 437-463. http://dx.doi.org/10.1146/annurev-physchem-032210-103526
- Chiti, F. and Dobson, C. (2006) Protein Misfolding, Functional Amyloid, and Human Disease. Annual Review of Biochemistry, 75, 333-366. http://dx.doi.org/10.1146/annurev.biochem.75.101304.123901
- Nilsson, M.R. (2004) Techniques to Study Amyloid Fibril Formation in Vitro. Methods, 34, 151-160. http://dx.doi.org/10.1016/j.ymeth.2004.03.012
- Collins, S.D., Douglass, A., Vale, R.D. and Weissman, J.S. (2004) Mechanism of Prion Propagation: Amyloid Growth Occurs by Monomer Addition. PLOS Biology, 321, 1582-1590.
- Kelly, J.W. (1998) The Alternative Conformations of Amyloidogenic Proteins Andtheir Multi-Step Assembly Pathways. Current Opinion in Structural Biology, 8, 101-106. http://dx.doi.org/10.1016/S0959-440X(98)80016-X
- Necula, M., et al. (2007) Small Molecule Inhibitors of Aggregation Indicate that Amyloid Beta Oligomerization and Fibrillization Pathways Are Independent and Distinct. The Journal of Biological Chemistry, 282, 10311-10324. http://dx.doi.org/10.1074/jbc.M608207200
- Baskakov, I.B. and Olga, V. (2005) In Vitro Conversion of Mammalian Prion Protein into Amyloid Fibrils Displays Unusual Features. Biochemistry, 44, 2339-2348. http://dx.doi.org/10.1021/bi048322t
- Xu, S., Bevis, B. and Amsdorf, M. (2001) The Assembly of Amyloidogenic Yeast Sup35 as Assessed by Scanning (Atomic) Force Microscopy: An Analogy to Linear Colloidal Aggregation? Biophysical Journal, 81, 446-454. http://dx.doi.org/10.1016/S0006-3495(01)75712-8
- Xu, S. and Lin, B. (2001) The Mechanism of Oxidation-Induced Low-Density Lipoprotein Aggregation: An Analogy to Colloidal Aggregation and Beyond? Biophysical Journal, 81, 2403-2413. http://dx.doi.org/10.1016/S0006-3495(01)75887-0
- Rangachari, V., et al. (2006) Secondary Structure and Interfacial Aggregation of Amyloid-Beta (1-40) on Sodium Dodecyl Sulfate Micelles. Biochemistry, 45, 8639-8648. http://dx.doi.org/10.1021/bi060323t
- Qin, Z., et al. (2007) Structural Characterization of the Partially Folded Intermediates of an Immunoglobulin Light Chain Leading to Amyloid Fibrillization and Amorphous Aggregation. Biochemistry, 46, 3521-3531. http://dx.doi.org/10.1021/bi061716v
- Cheon, M., et al. (2007) Structural Reorganisation and Potential Toxicity of Oligomeric Species Formed during the Assembly of Amyloid Fibrils. PLoS Computational Biology, 3, 1727-1238. http://dx.doi.org/10.1371/journal.pcbi.0030173
- Walsh, D., et al. (2002) Naturally Secreted Oligomers of Amyloid-Beta Protein Potently Inhibit Hippocampal Long-Term Potentiation in Vivo. Nature, 416, 535-539. http://dx.doi.org/10.1038/416535a
- Anfinsen, C.B. (1972) The Formation and Stabilization of Protein Structure. Biochemical Journal, 128, 737-749.
- de la Torre, J.C. (2000) Cerebral Hypoperfusion, Capillary Degeneation, and Development of Alzheimer Disease. Alzheimer Disease and Associated Disorders, 14, 72-81.http://dx.doi.org/10.1097/00002093-200000001-00012
- Uversky, V. and Fink, A. (2007) Protein Misfolding, Aggregation, and Conformational Diseases. In: Atassi, M.Z., Ed., Protein Reviews, Vol. 6, Springer, Berlin, 189-192. http://dx.doi.org/10.1007/978-0-387-36534-3
- Hoyer, W., et al. (2002) Dependence of α-Synuclein Aggregate Morphology on Solution Conditions. Journal of Molecular Biology, 322, 383-393. http://dx.doi.org/10.1016/S0022-2836(02)00775-1
- Stranks, S.D., et al. (2009) Model for Amorphous Aggregation Processes. Physical Review E: Statistical, Nonlinear, and Soft Matter Physics, 80, 051907. http://dx.doi.org/10.1103/PhysRevE.80.051907
- Stefani, M. and Dobson, C. (2003) Protein Aggregation and Aggregate Toxicity: New Insights into Protein Folding, Misfolding Diseases and Biological Evolution. Journal of Molecular Medicine, 81, 678-699. http://dx.doi.org/10.1007/s00109-003-0464-5
- Kidd, M. (1964) Alzheimer’s Disease—An Electron Microscopical Study. Brain, 87, 307-320. http://dx.doi.org/10.1093/brain/87.2.307
- Yagishita, S., et al. (1981) Reappraisal of the Fine Structure of Alzheimer’s Neurofibrillary Tangles. Acta Neuropathologica, 54, 239-246. http://dx.doi.org/10.1007/BF00687747
- Rangachari, V.R., Reed, D.K., Moore, B.D. and Rosenberry, T.L. (2006) Secondary Structure and Interfacial Aggregation of Amyloid-Beta (1-40) on Sodium Dodecyl Sulfate Micelles. Biochemistry, 45, 8639-8648. http://dx.doi.org/10.1021/bi060323t
- Papon, P., Leblond, L. and Meijer, P. (2002) The Physics of Phase Transitions: Concepts and Applications. 2nd Edition, In: Papon, P., Leblond, J. and Meijer, P.H.E., Eds., Advanced Texts in Physics, Springer, Berlin, 123-162, 185-209. http://dx.doi.org/10.1007/978-3-662-04989-1
- Bolder, S., et al. (2007) Thioflavin T and Birefringence Assays to Determine the Conversion of Proteins into Fibils. Langmuir, 23, 4144-4147. http://dx.doi.org/10.1021/la063048k
- Xu, S., et al. (2010) Characterization of Tau Fibrillization in Vitro. Alzheimer’s & Dementia: The Journal of the Alzheimer’s Association, 6, 110-117.
- Xu, S. and Arnsdorf, M. (1994) Calibration of the Scanning (Atomic) Force Microscope with Gold Particles. Journal of Microscopy, 173, 199-210. http://dx.doi.org/10.1111/j.1365-2818.1994.tb03442.x
- Rocken, C., et al. (2006) ALys Amyloidosis Caused by Compound Heterozygosity in Exon 2 (Thr70Asn) and Exon 4 (Trp112Arg) of the Lysozyme Gene. Human Mutation, 27, 119-120. http://dx.doi.org/10.1002/humu.9393
- Valleix, S., et al. (2002) Hereditary Renal Amyloidosis Caused by a New Variant Lysozyme W64R in a French Family. Kidney International, 61, 907-912. http://dx.doi.org/10.1046/j.1523-1755.2002.00205.x
- Swaminathan, R., et al. (2011) Lysozyme: A Model Protein for Amyloid Research. Advances in Protein Chemistry and Structural Biology, 84, 63-111. http://dx.doi.org/10.1016/B978-0-12-386483-3.00003-3
- Cao, A., Hu, D. and Lai, L. (2004) Formation of Amyloid Fibrils from Fully Reduced Hen Egg White Lysozyme. Protein Science: A Publication of the Protein Society, 13, 319-324. http://dx.doi.org/10.1110/ps.03183404
- Yonezawa, Y., et al. (2002) An Insight into the Pathway of the Amyloid Fibril Formation of Hen Egg White Lysozyme Obtained from a Small-Angle X-Ray and Neutron Scattering Study. Journal of Molecular Biology, 323, 237-251. http://dx.doi.org/10.1016/S0022-2836(02)00941-5
- Morozova-Roche, L.A., et al. (2000) Amyloid Fibril Formation and Seeding by Wild-Type Human Lysozyme and Its Disease-Related Mutational Variants. Journal of Structural Biology, 130, 339-351. http://dx.doi.org/10.1006/jsbi.2000.4264
- Barkholt, V. and Jensen, A. (1989) Amino Acid Analysis: Determination of Cystein Plus Half-Cystein in Proteins after Hydrochloric Acid Hydrolysis with a Disulfide Compound as Additive. Analytical Biochemistry, 177, 318-322. http://dx.doi.org/10.1016/0003-2697(89)90059-6
- Hoare, D. and Koshland Jr., D.A. (1967) Method for the Quantitative Modification and Estimation of Carboxylic Acid Groups in Proteins. The Journal of Biological Chemistry, 242, 2447-2453.
- Spencer, R. and Finn, W. (1969) A New Convenient Method for Estimation of Total Cysine-Cysteine in Proteins. Analytical Biochemistry, 32, 185-190. http://dx.doi.org/10.1016/0003-2697(69)90123-7
- Bolisetty, S., et al. (2012) Gelation, Phase Behavior, and Dynamics of Beta-Lactoglobulin Amyloid Fibrils at Varying Concentrations and Ionic Strengths. Biomacromolecules, 13, 3241-3252. http://dx.doi.org/10.1021/bm301005w
- Pasternack, R., et al. (2006) Formation Kinetics of Insulin-Based Amyloid Gels and the Effect of Added Metalloporphyrins. Biophysical Journal, 90, 1033-1042. http://dx.doi.org/10.1529/biophysj.105.068650
- Krysmann, M.J., Castelletto, V., Kelarakis, A., Hamley, I.W., Hule, R.A. and Pochan, D.J. (2008) Self-Assembly and Hydrogelation of an Amyloid Peptide Fragment. Biochemistry, 47, 4597-4605. http://dx.doi.org/10.1021/bi8000616
- Bhak, G., et al. (2010) Amyloid Hydrogel Derived from Curly Protein Fibrils of Alpha-Synuclein. Biomaterials, 31, 5986-5995. http://dx.doi.org/10.1016/j.biomaterials.2010.03.080
- Michael, R., et al. (2013) Absence of Beta-Amyloid in Cortical Cataracts of Donors with and without Alzheimer’s Disease. Experimental Eye Research, 106, 5-13. http://dx.doi.org/10.1016/j.exer.2012.10.012
- Serrano-Pozo, A., et al. (2011) Neuropathological Alterations in Alzheimer Disease. Cold Spring Harbor Perspectives in Medicine, 1, 006189.
- Atwood, C.S., Moir, R.D., Huang, X., Scarpa, R., Bacarra, M., Romano, D., Hartshorn, M., Tanzi, R. and Bush, A. (1998) Dramatic Aggregation of Alzheimer Aβ by Cu(II) Is Induced by Conditions Representing Physiological Acidosis. The Journal of Biological Chemistry, 23, 12817-12826. http://dx.doi.org/10.1074/jbc.273.21.12817
- Castellani, R., et al. (2007) Iron: The Redox-Active Center of Oxidative Stress in Alzheimer Disease. Neurochemical Research, 32, 1640-1645. http://dx.doi.org/10.1007/s11064-007-9360-7
NOTES

*Corresponding author.