Open Journal of Metal
Vol.3 No.3(2013), Article ID:37022,5 pages DOI:10.4236/ojmetal.2013.33005
Identification of Silver Nanoparticles on Polyester Fiber on Raman Spectrograms of the in the Conditions of Information Uncertainty
Research and Education Center Nanoelectronics, SWSU, Kursk, Russia
Email: *emelianov@nm.ru
Copyright © 2013 V. M. Emeljanov et al. This is an open access article distributed under the Creative Commons Attribution License, which permits unrestricted use, distribution, and reproduction in any medium, provided the original work is properly cited.
Received June 4, 2013; revised July 5, 2013; accepted July 12, 2013
Keywords: polyester fiber; colloidal silver nanoparticles; Raman spectra; information uncertainty; mathematical modeling
ABSTRACT
The paper shows the results of method development identification of colloidal silver nanoparticles on the components of the Raman spectra, using the conditions information uncertainty decision to increase the reliability evaluating the presence nanoparticles at the surface polyester fibers.
1. Introduction
To provide biomedical, therapeutic and protective properties of textile materials using silver nanoparticles is necessary to use convergence nano-, bio-, info-, cognitive science and technology.
In physical effect used Raman light scattering (SERS) [1-3], which is based on plasmon enhancement signal components from the Raman spectrum in the presence of silver nanoparticles. In addition, the applied polarizing effect of the laser beam Raman spectrometer PE fibers with silver nanoparticles, which provides additional gain of combination of background and fluorescent components of the Raman spectrogram.
2. Experimental
To improve the reliability of the control of presence of small amounts of colloidal silver nanoparticles on polyester (PE) fibers used Raman spectrometer, followed by separation of the spectral components of informative and processing on mathematical models in conditions of information uncertainty.
In the experiment, selected PE fiber to which silver nanoparticles were deposited from a colloidal solution of silver nanoparticles AgBion—2 (TU 2499-003-44471019- 2006, concern “Nanoindustry”). Obtained following fiber samples: Sample 1—no nanoparticles; sample 2—nanoparticulate dried in vivo; sample 3—nanoparticulate dried in an oven. The measurements were performed with a scanning probe microscope (SPM) with a confocal Raman and fluorescence spectrometer OmegaScope ™ -.
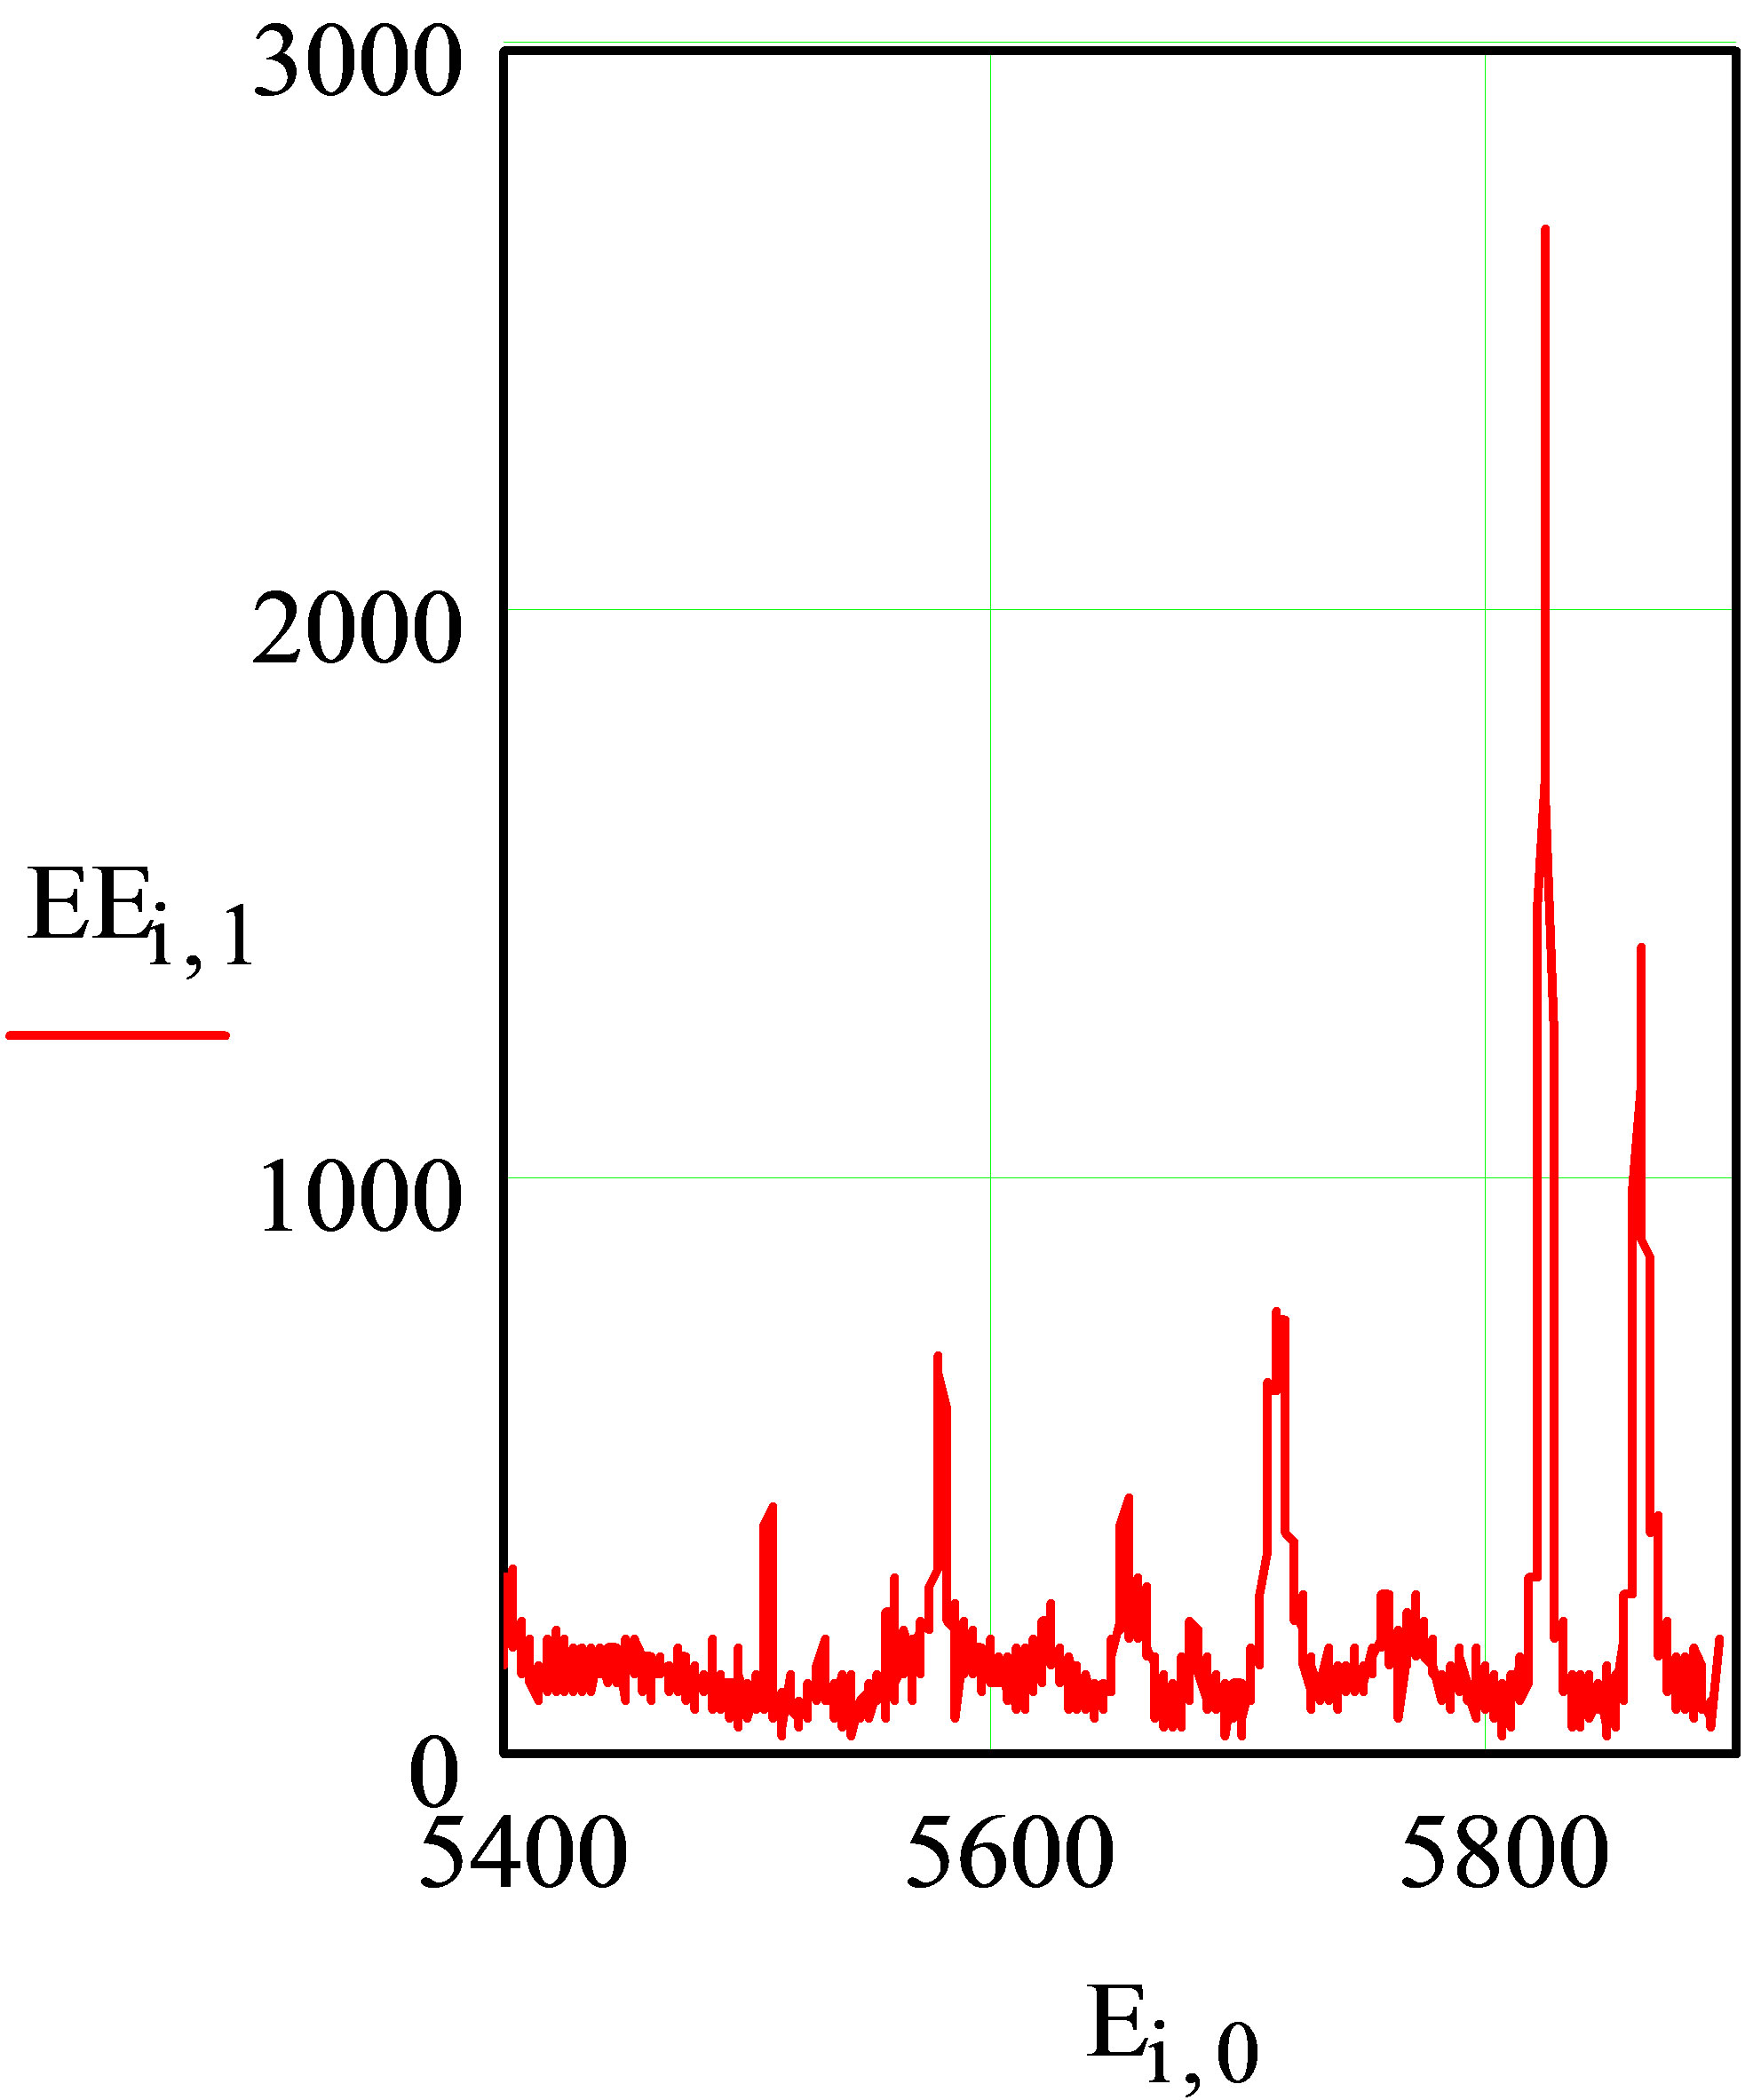
After the transfer of the digital portion of the Raman spectrograms of the program Spekwin32 in Mathcad, obtained spectrograms shown in Figure 1. Total of 10 spectrograms obtained. In order to take into account the background fluorescent component, which is present on the spectrograms presented should make the mathematiccal modeling of the background components for minimum data Raman spectrum [4,5].
The results of mathematical modeling and background components of the initial spectrum given no opportunity to highlight only the peaks of fluorescent components constituting the Raman spectrum (Figure 1) with the values of the parameters: Ei, 0, E1i, 0, E2i, 0, E3i, 0, E4i, 0, E5i, 0, E6i, 0, E7i, 0, E8i, 0, E9i, 0 —wave number (frequency) and EEi, 1, EE1i, 1, EE2i, 1, EE3i, 1, EE4i, 1, EE5i, 1, EE6i , 1, EE7i, 1, EE8i, 1, EE9i, 1 —intensity signals.
3. Results and Discussions
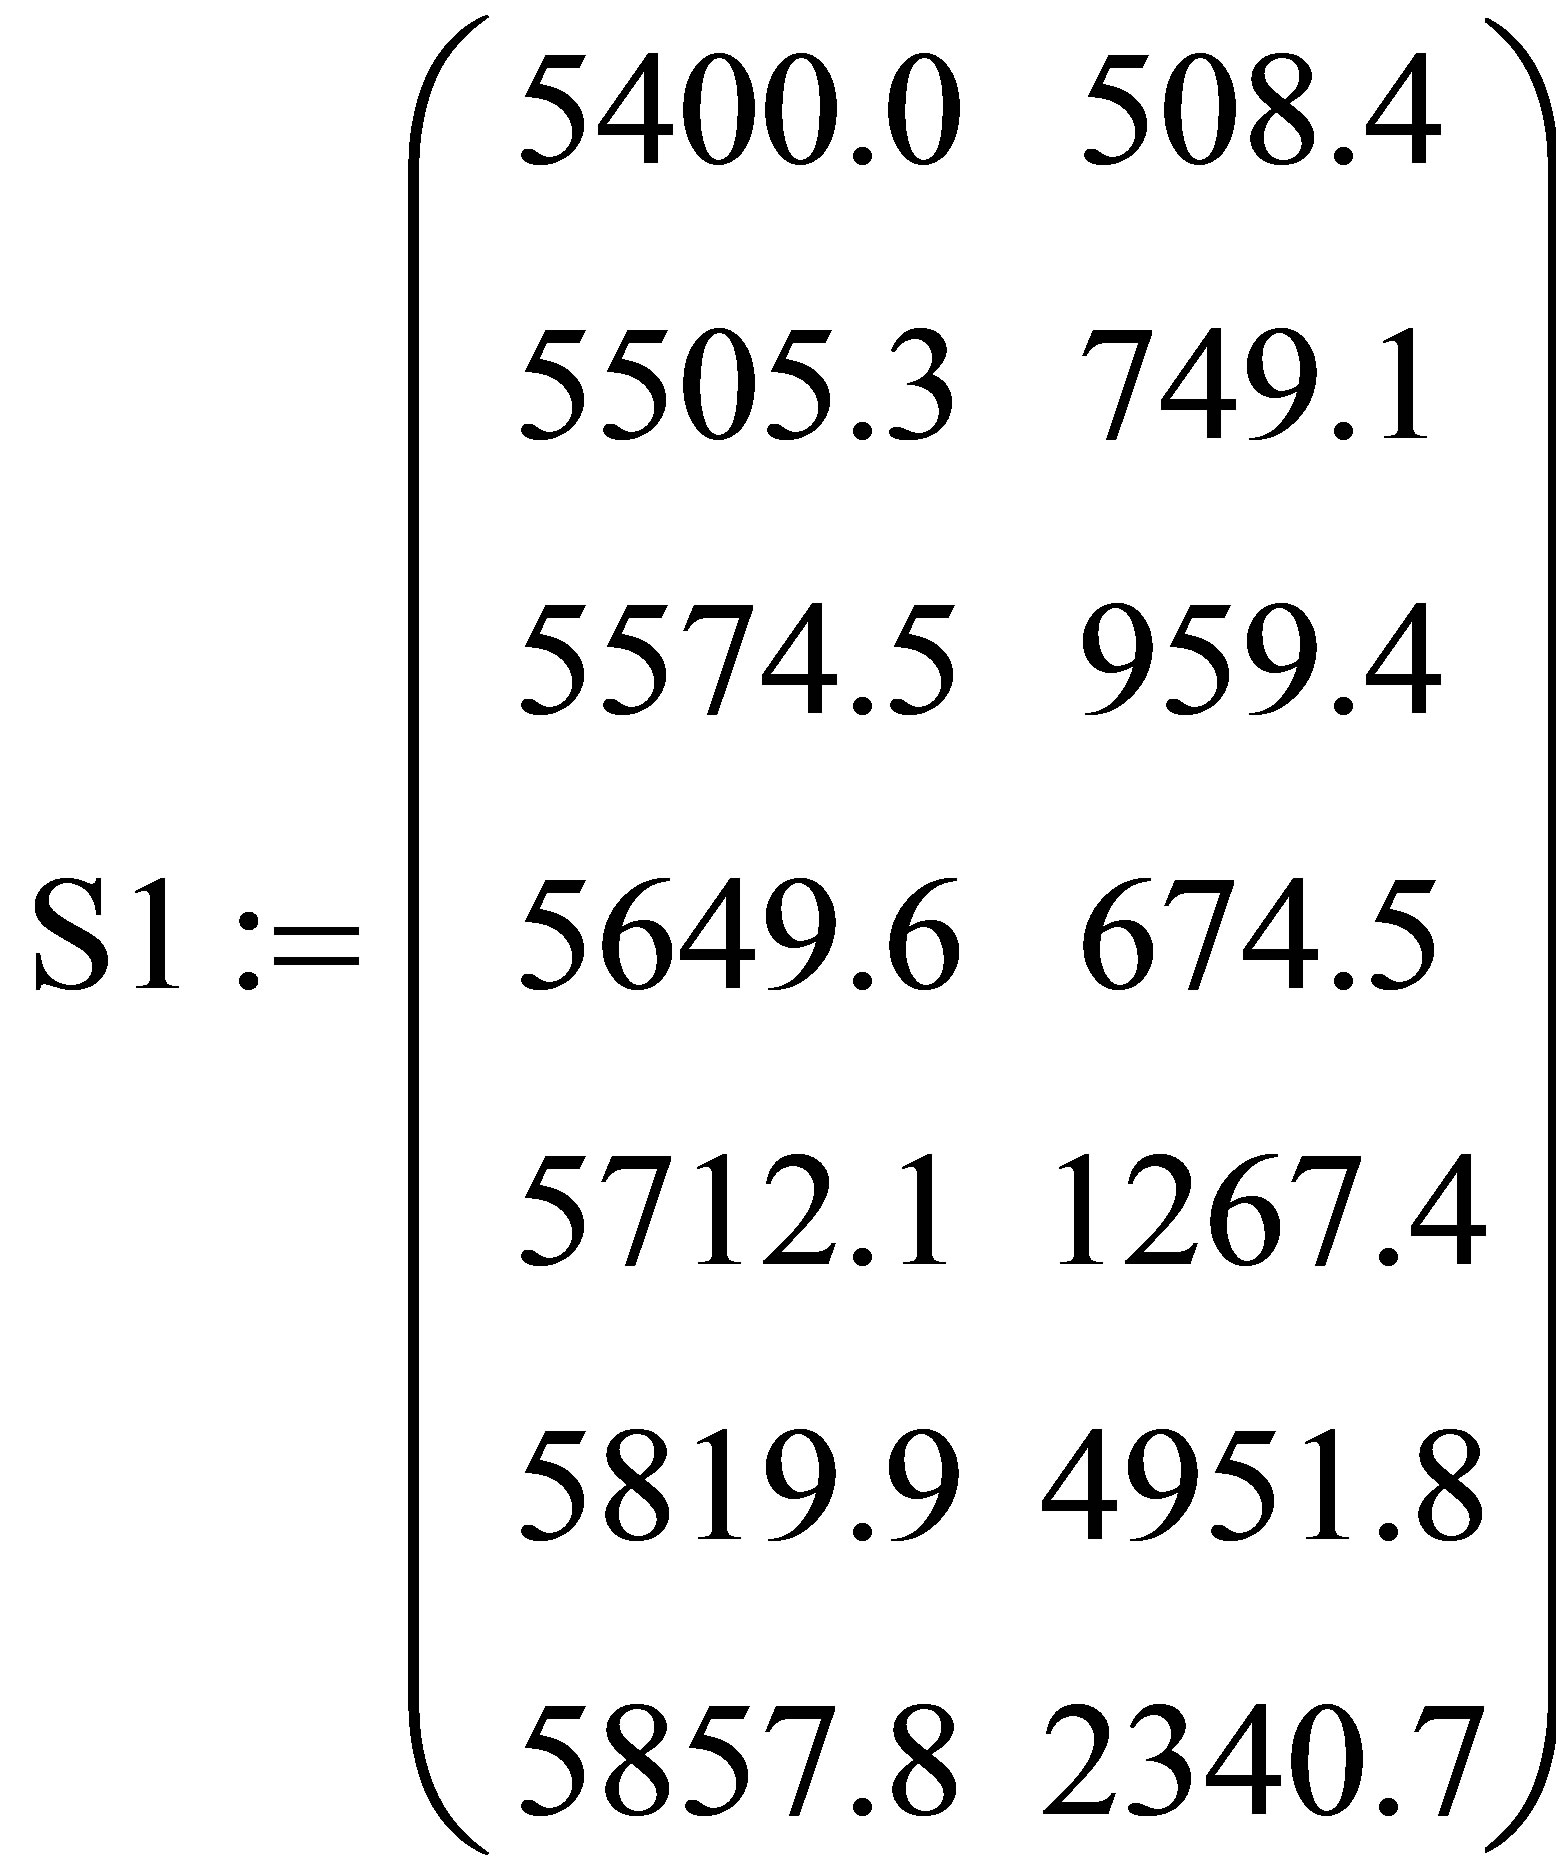
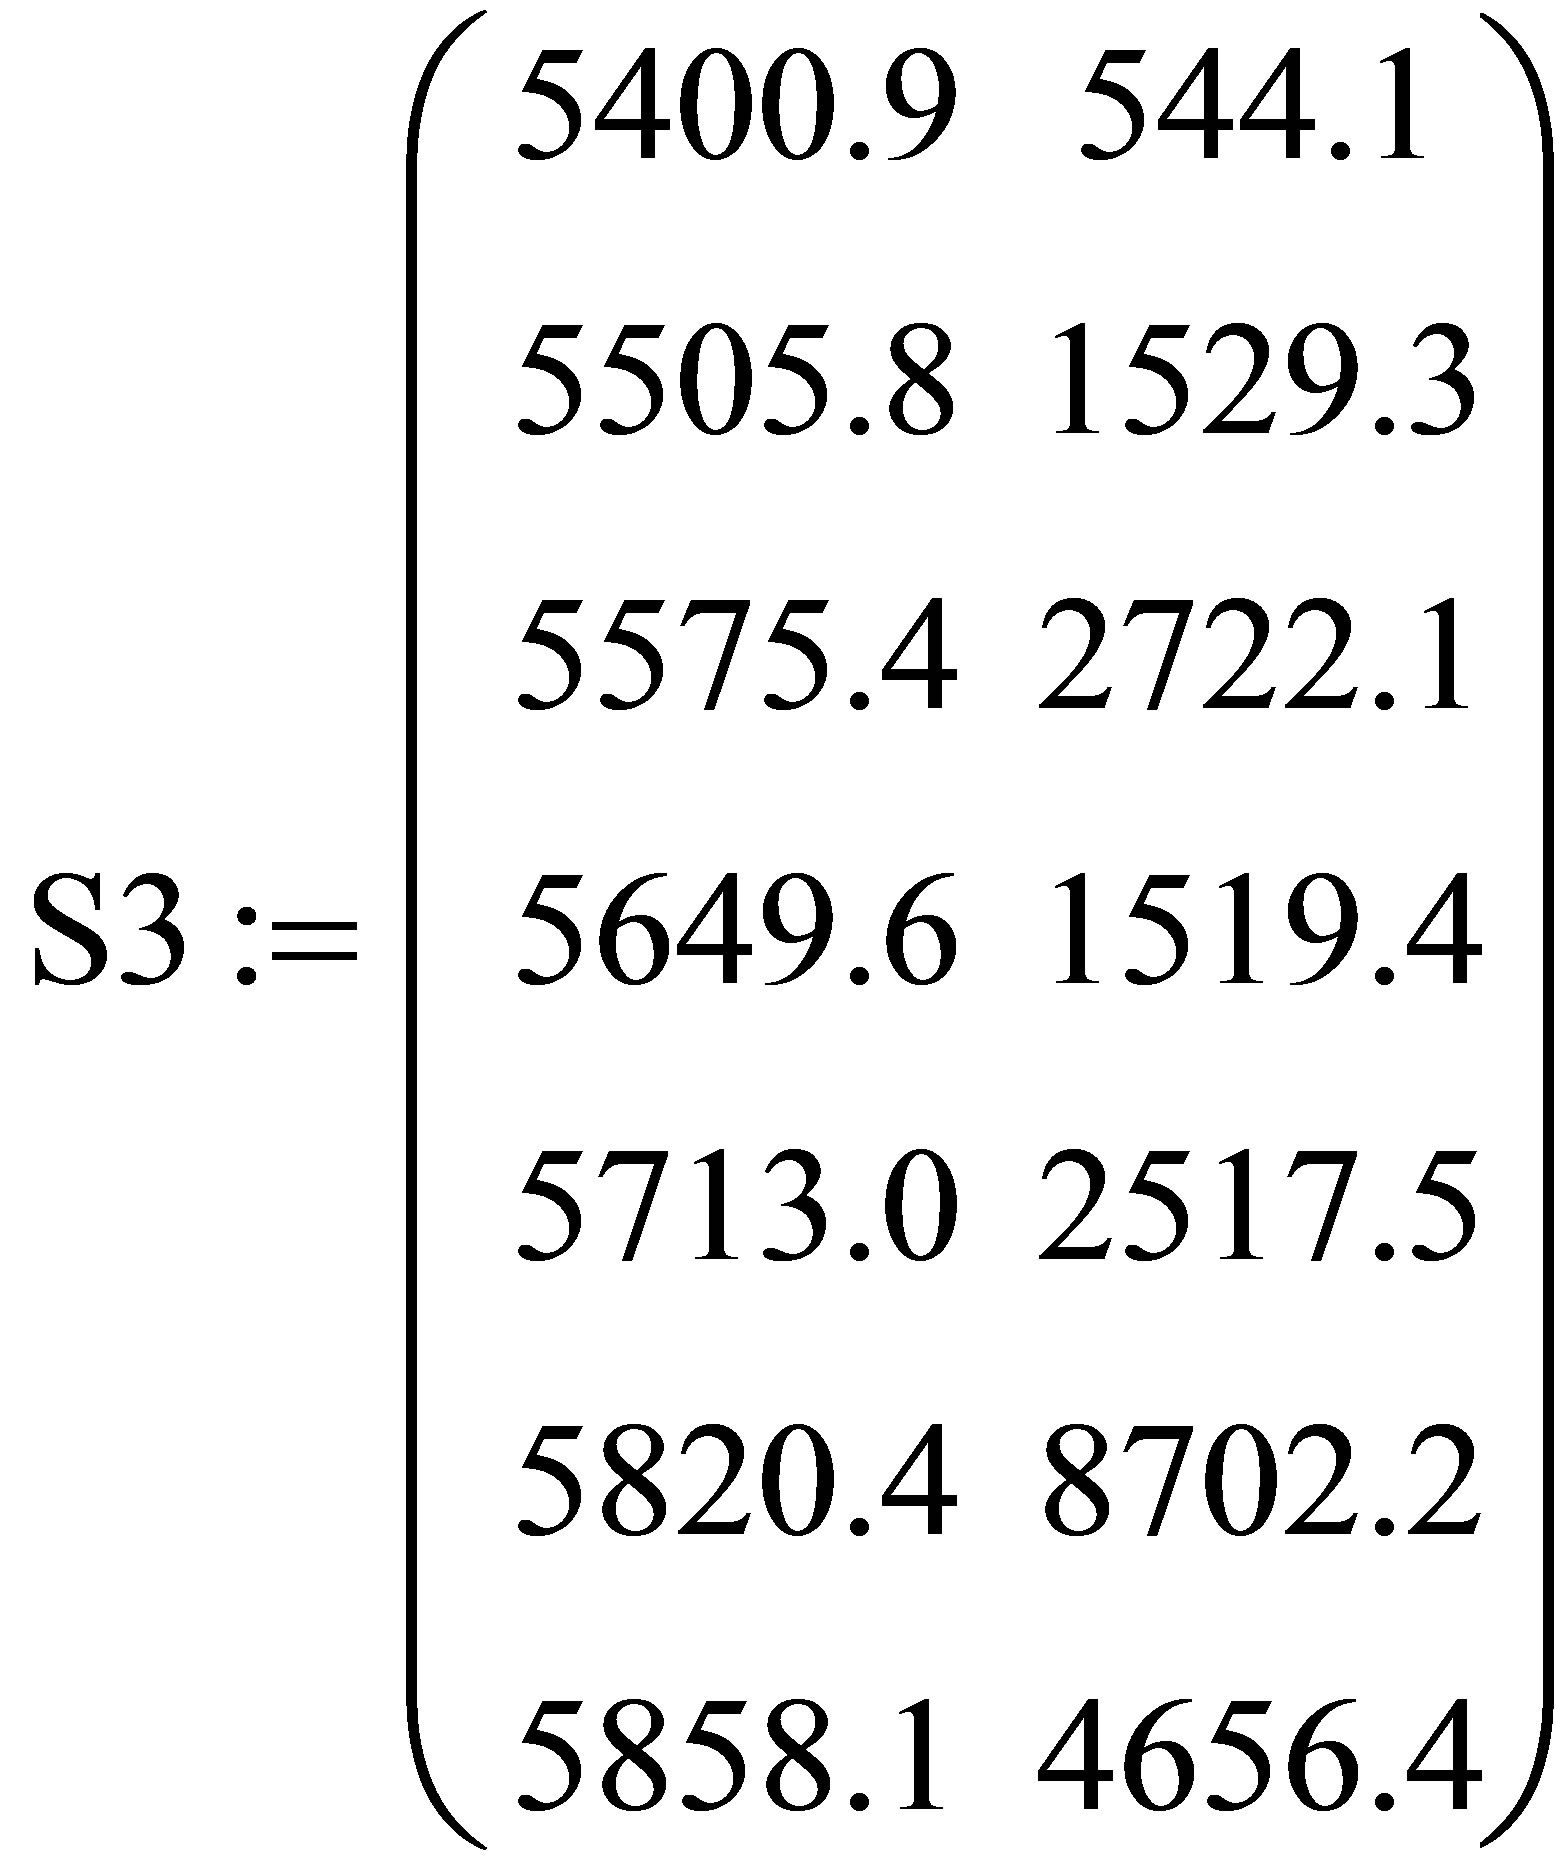
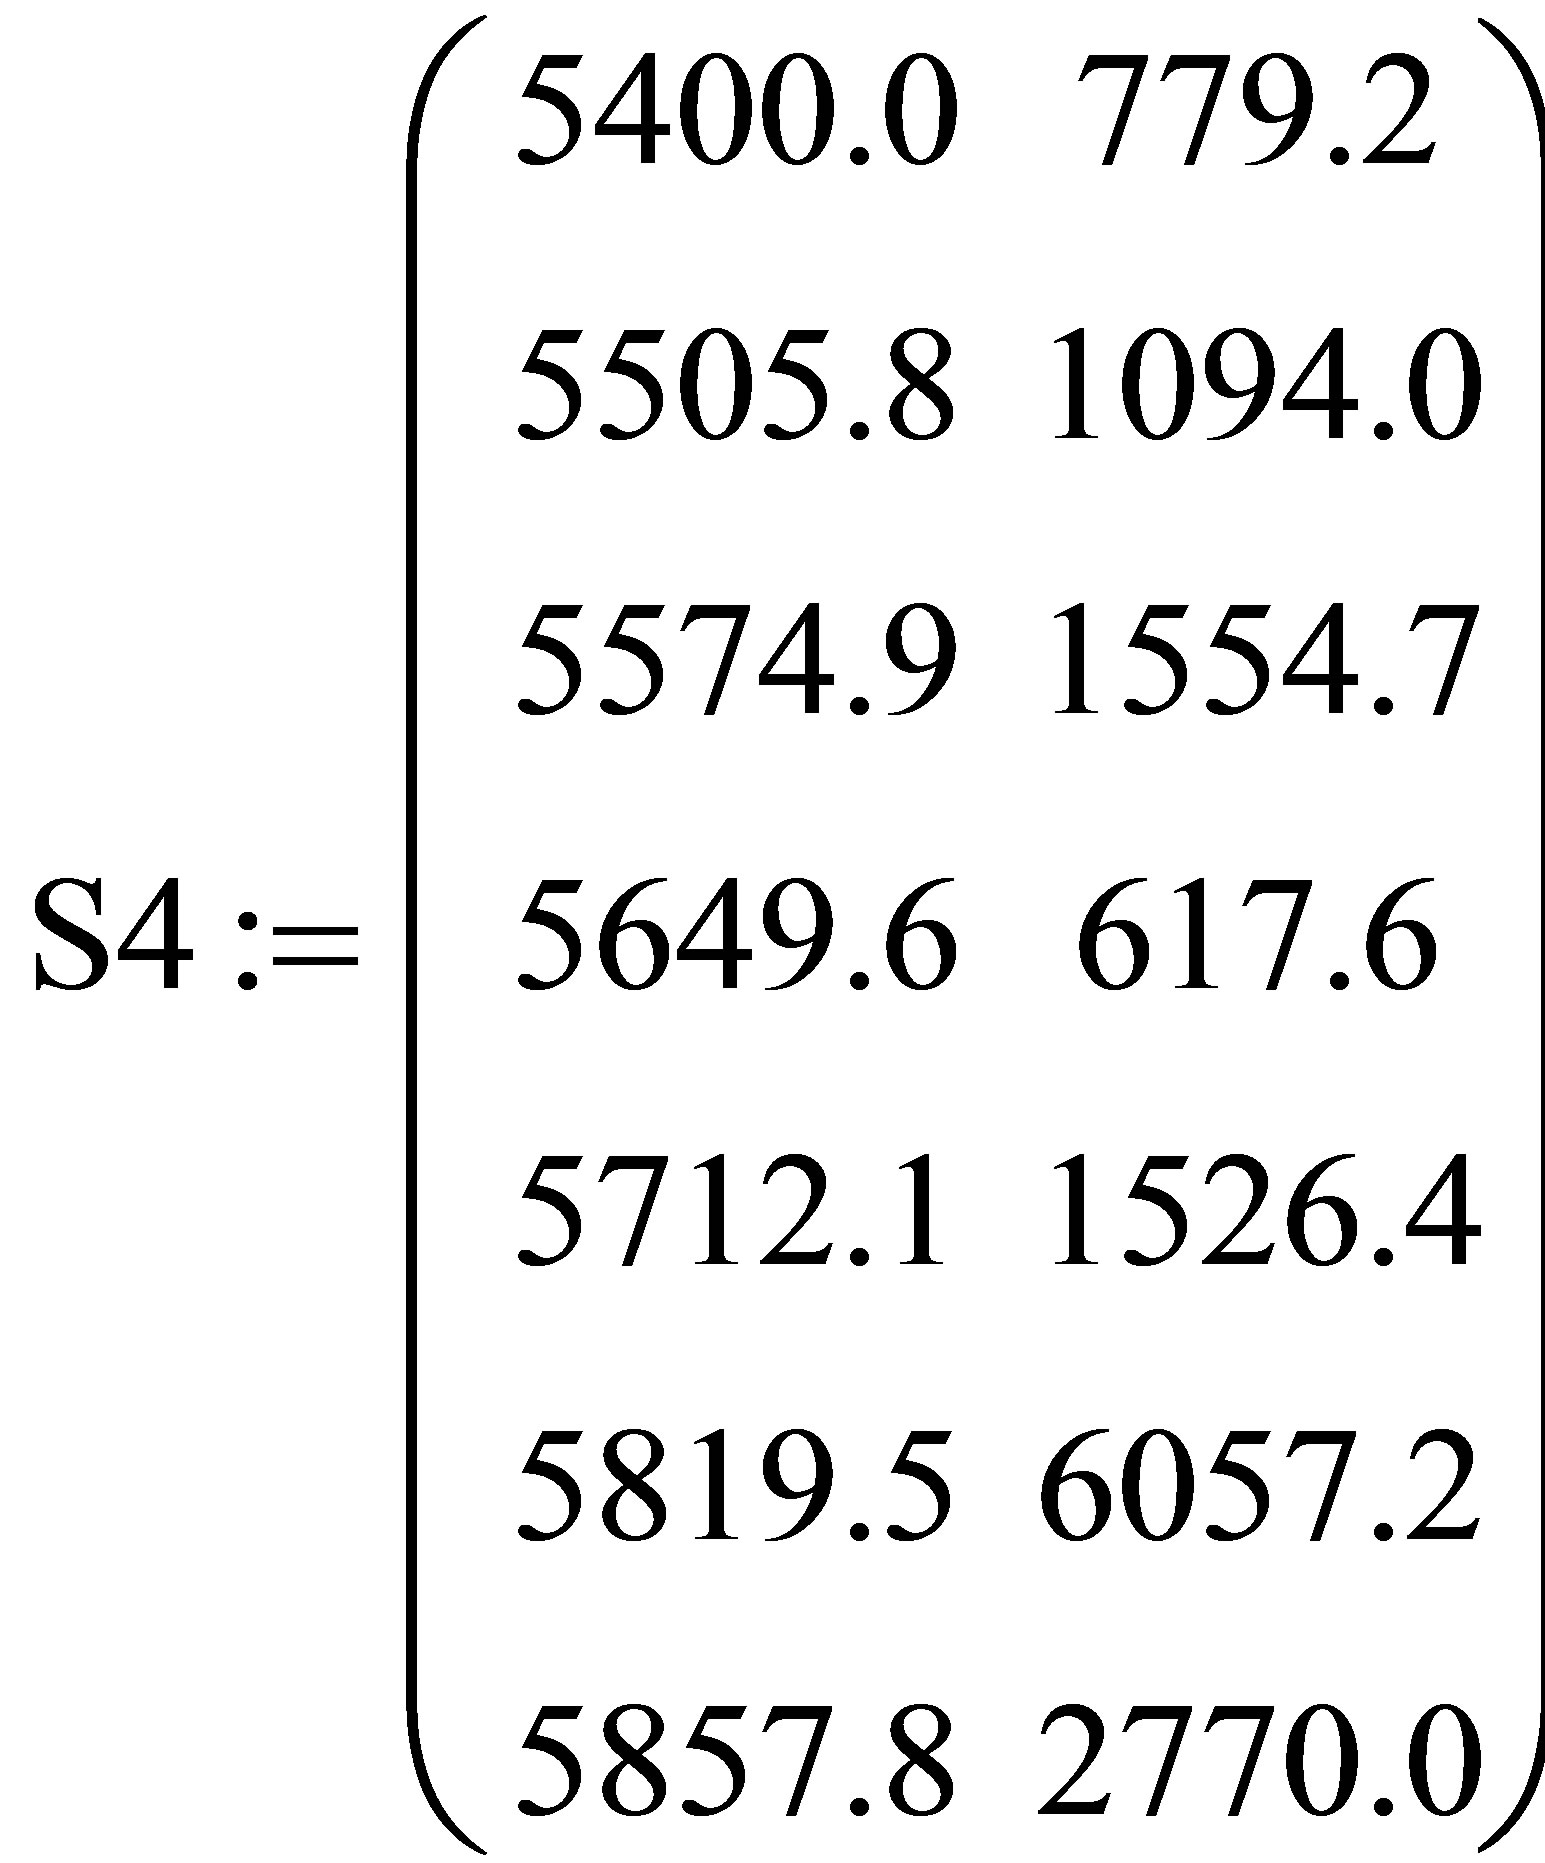
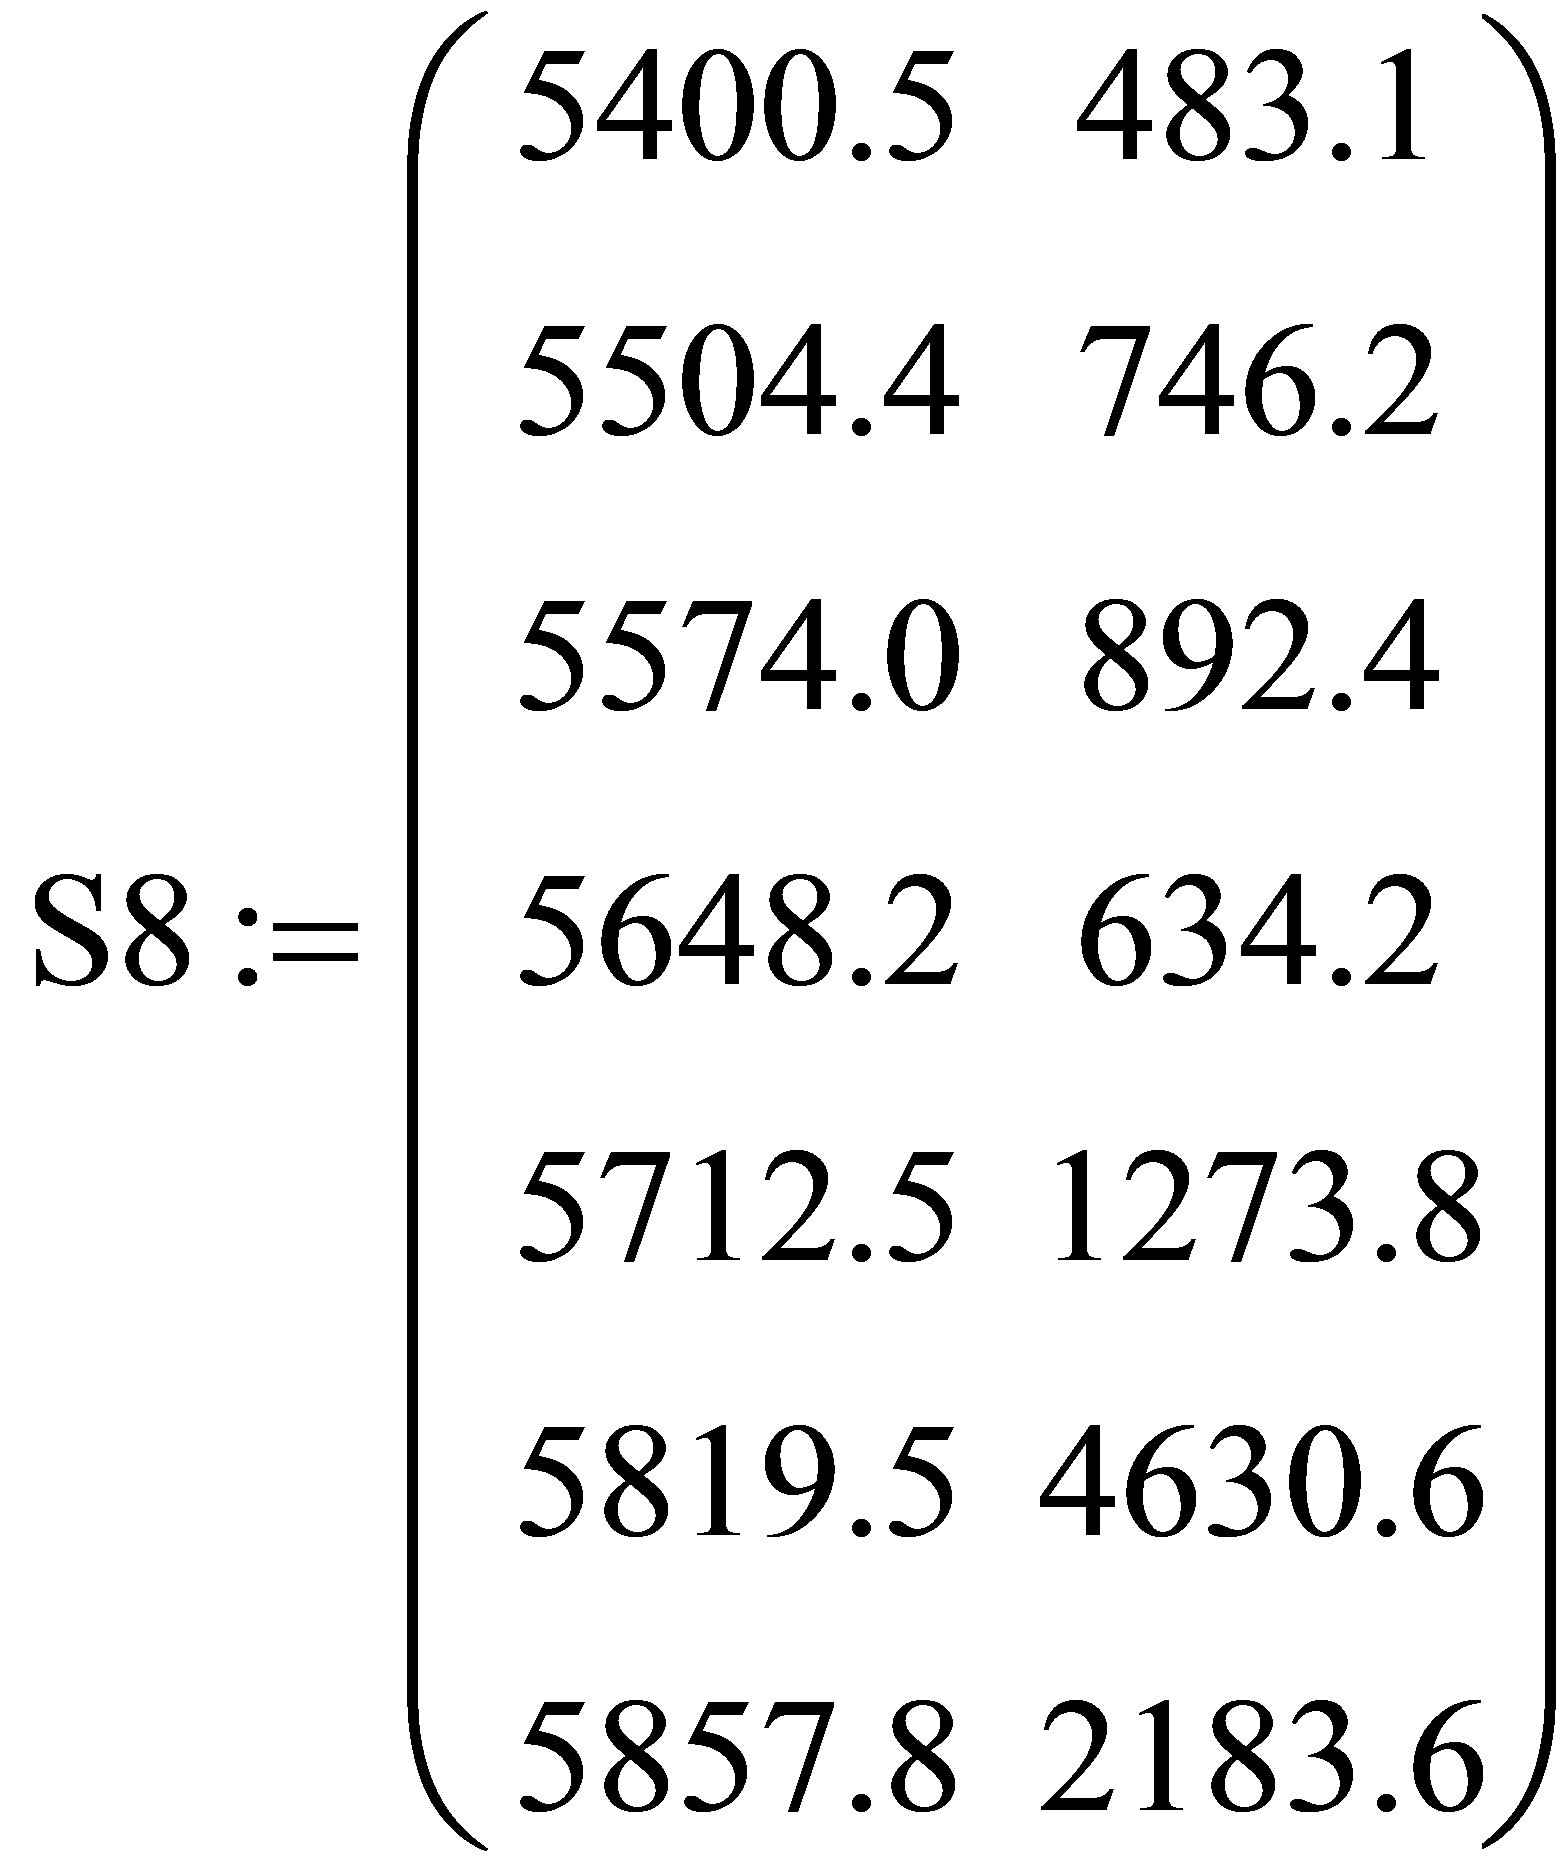
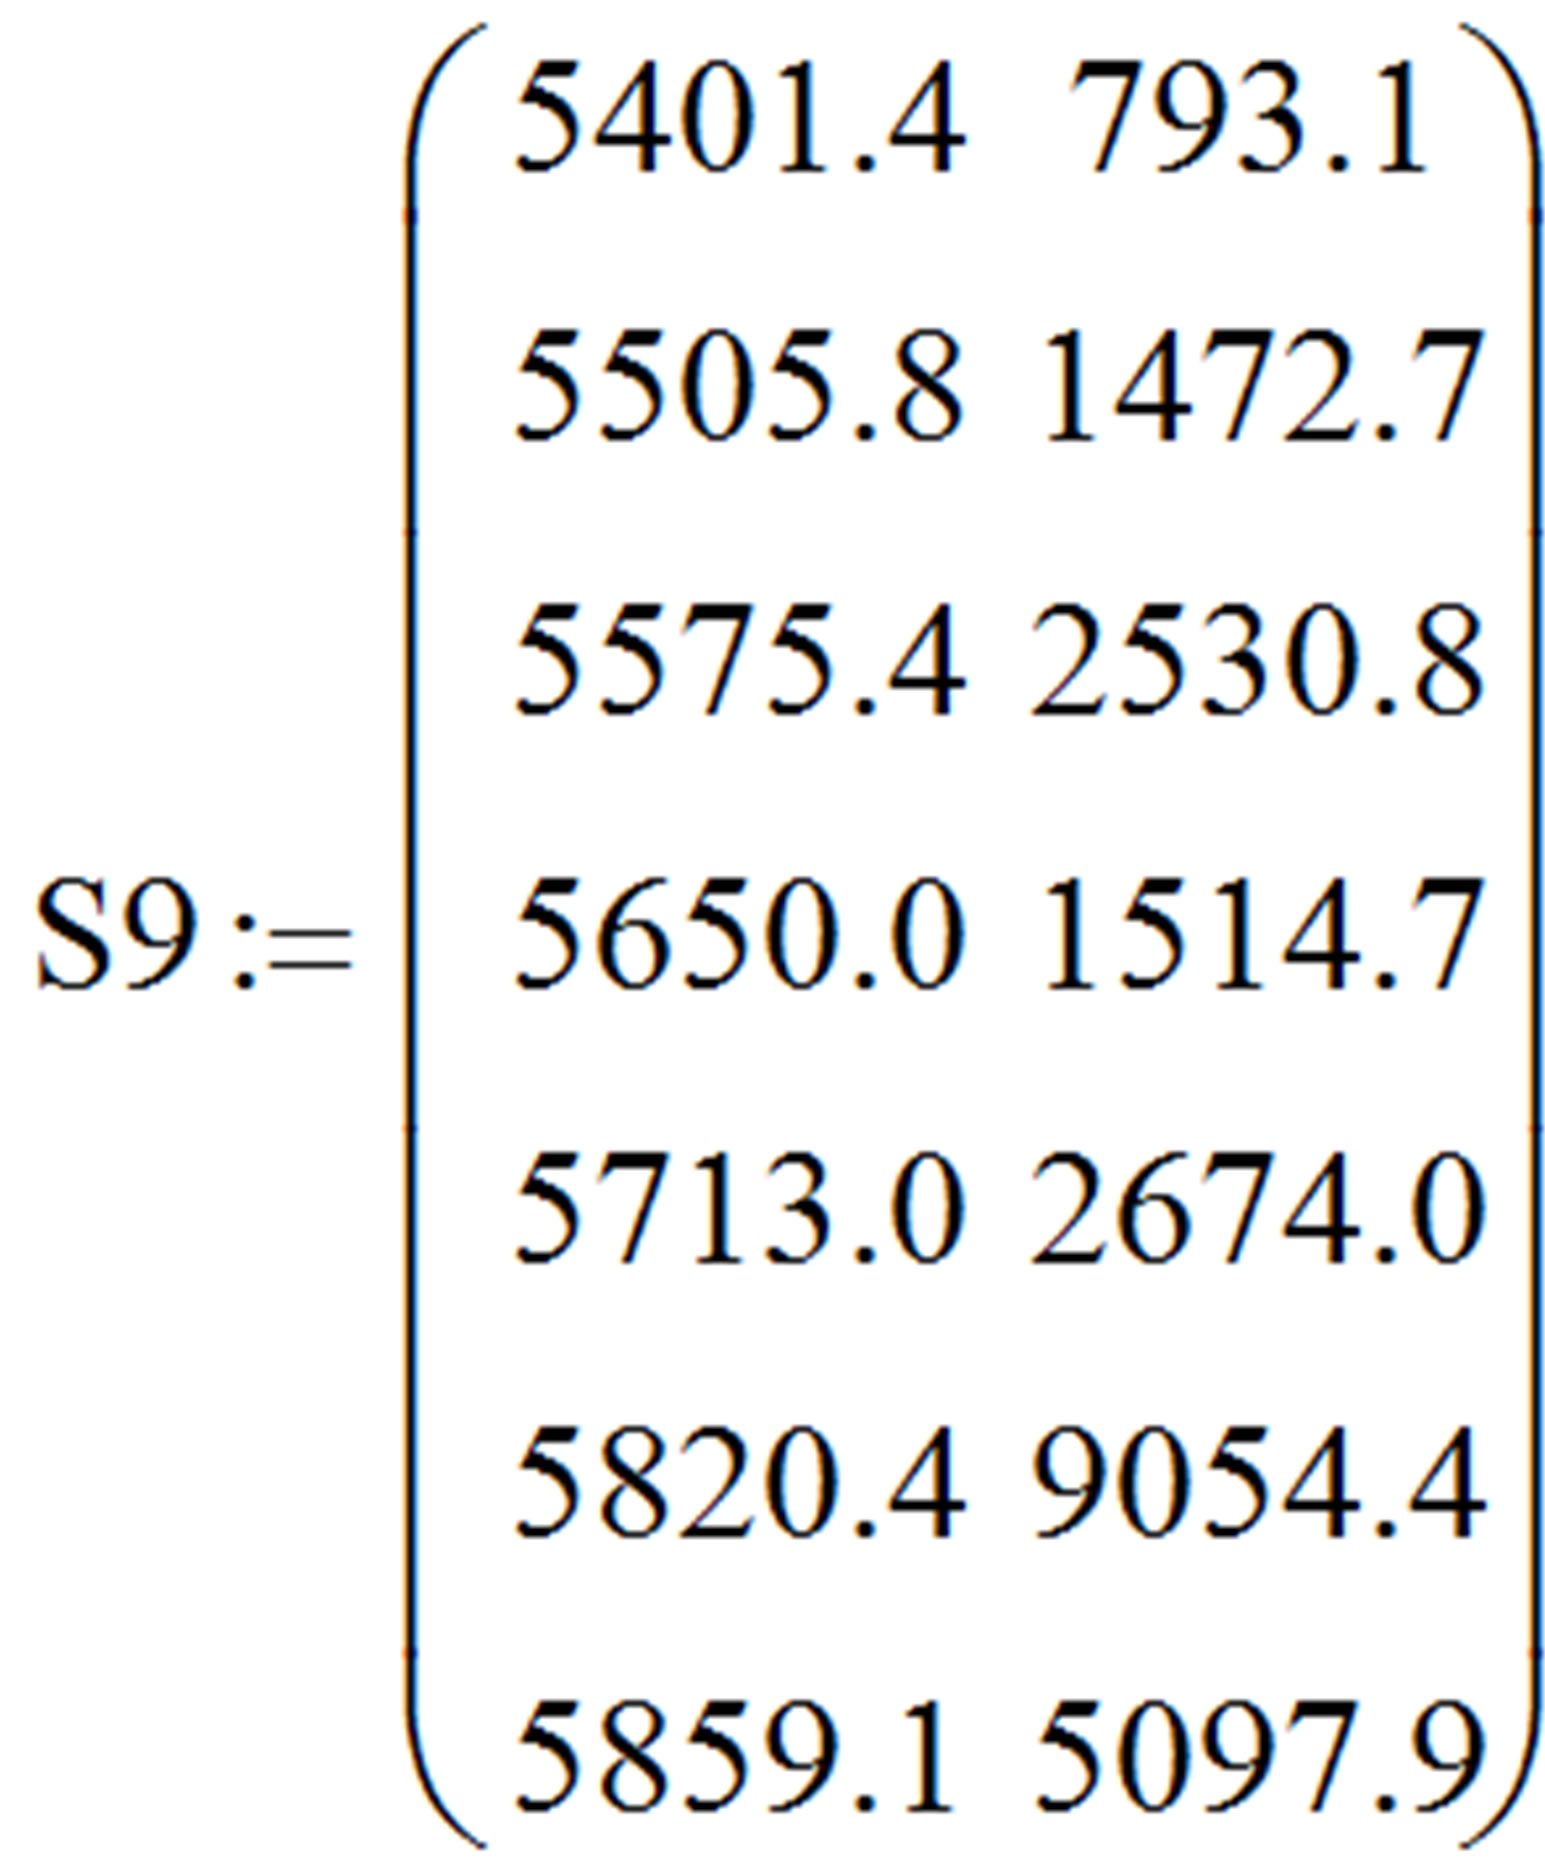
We construct a matrix S0-S9 the intensities of all the peaks EE-EE9 each spectrogram Figures 1(a)-(m) (second columns of the matrices S0-S9), depending on the wave number E-E9 (the first column of S0-S9) and each spectrogram Figures 1(a)-(m) and, for example, according to Figure 1(a): the matrix S0 with the first column
 (a)
(a)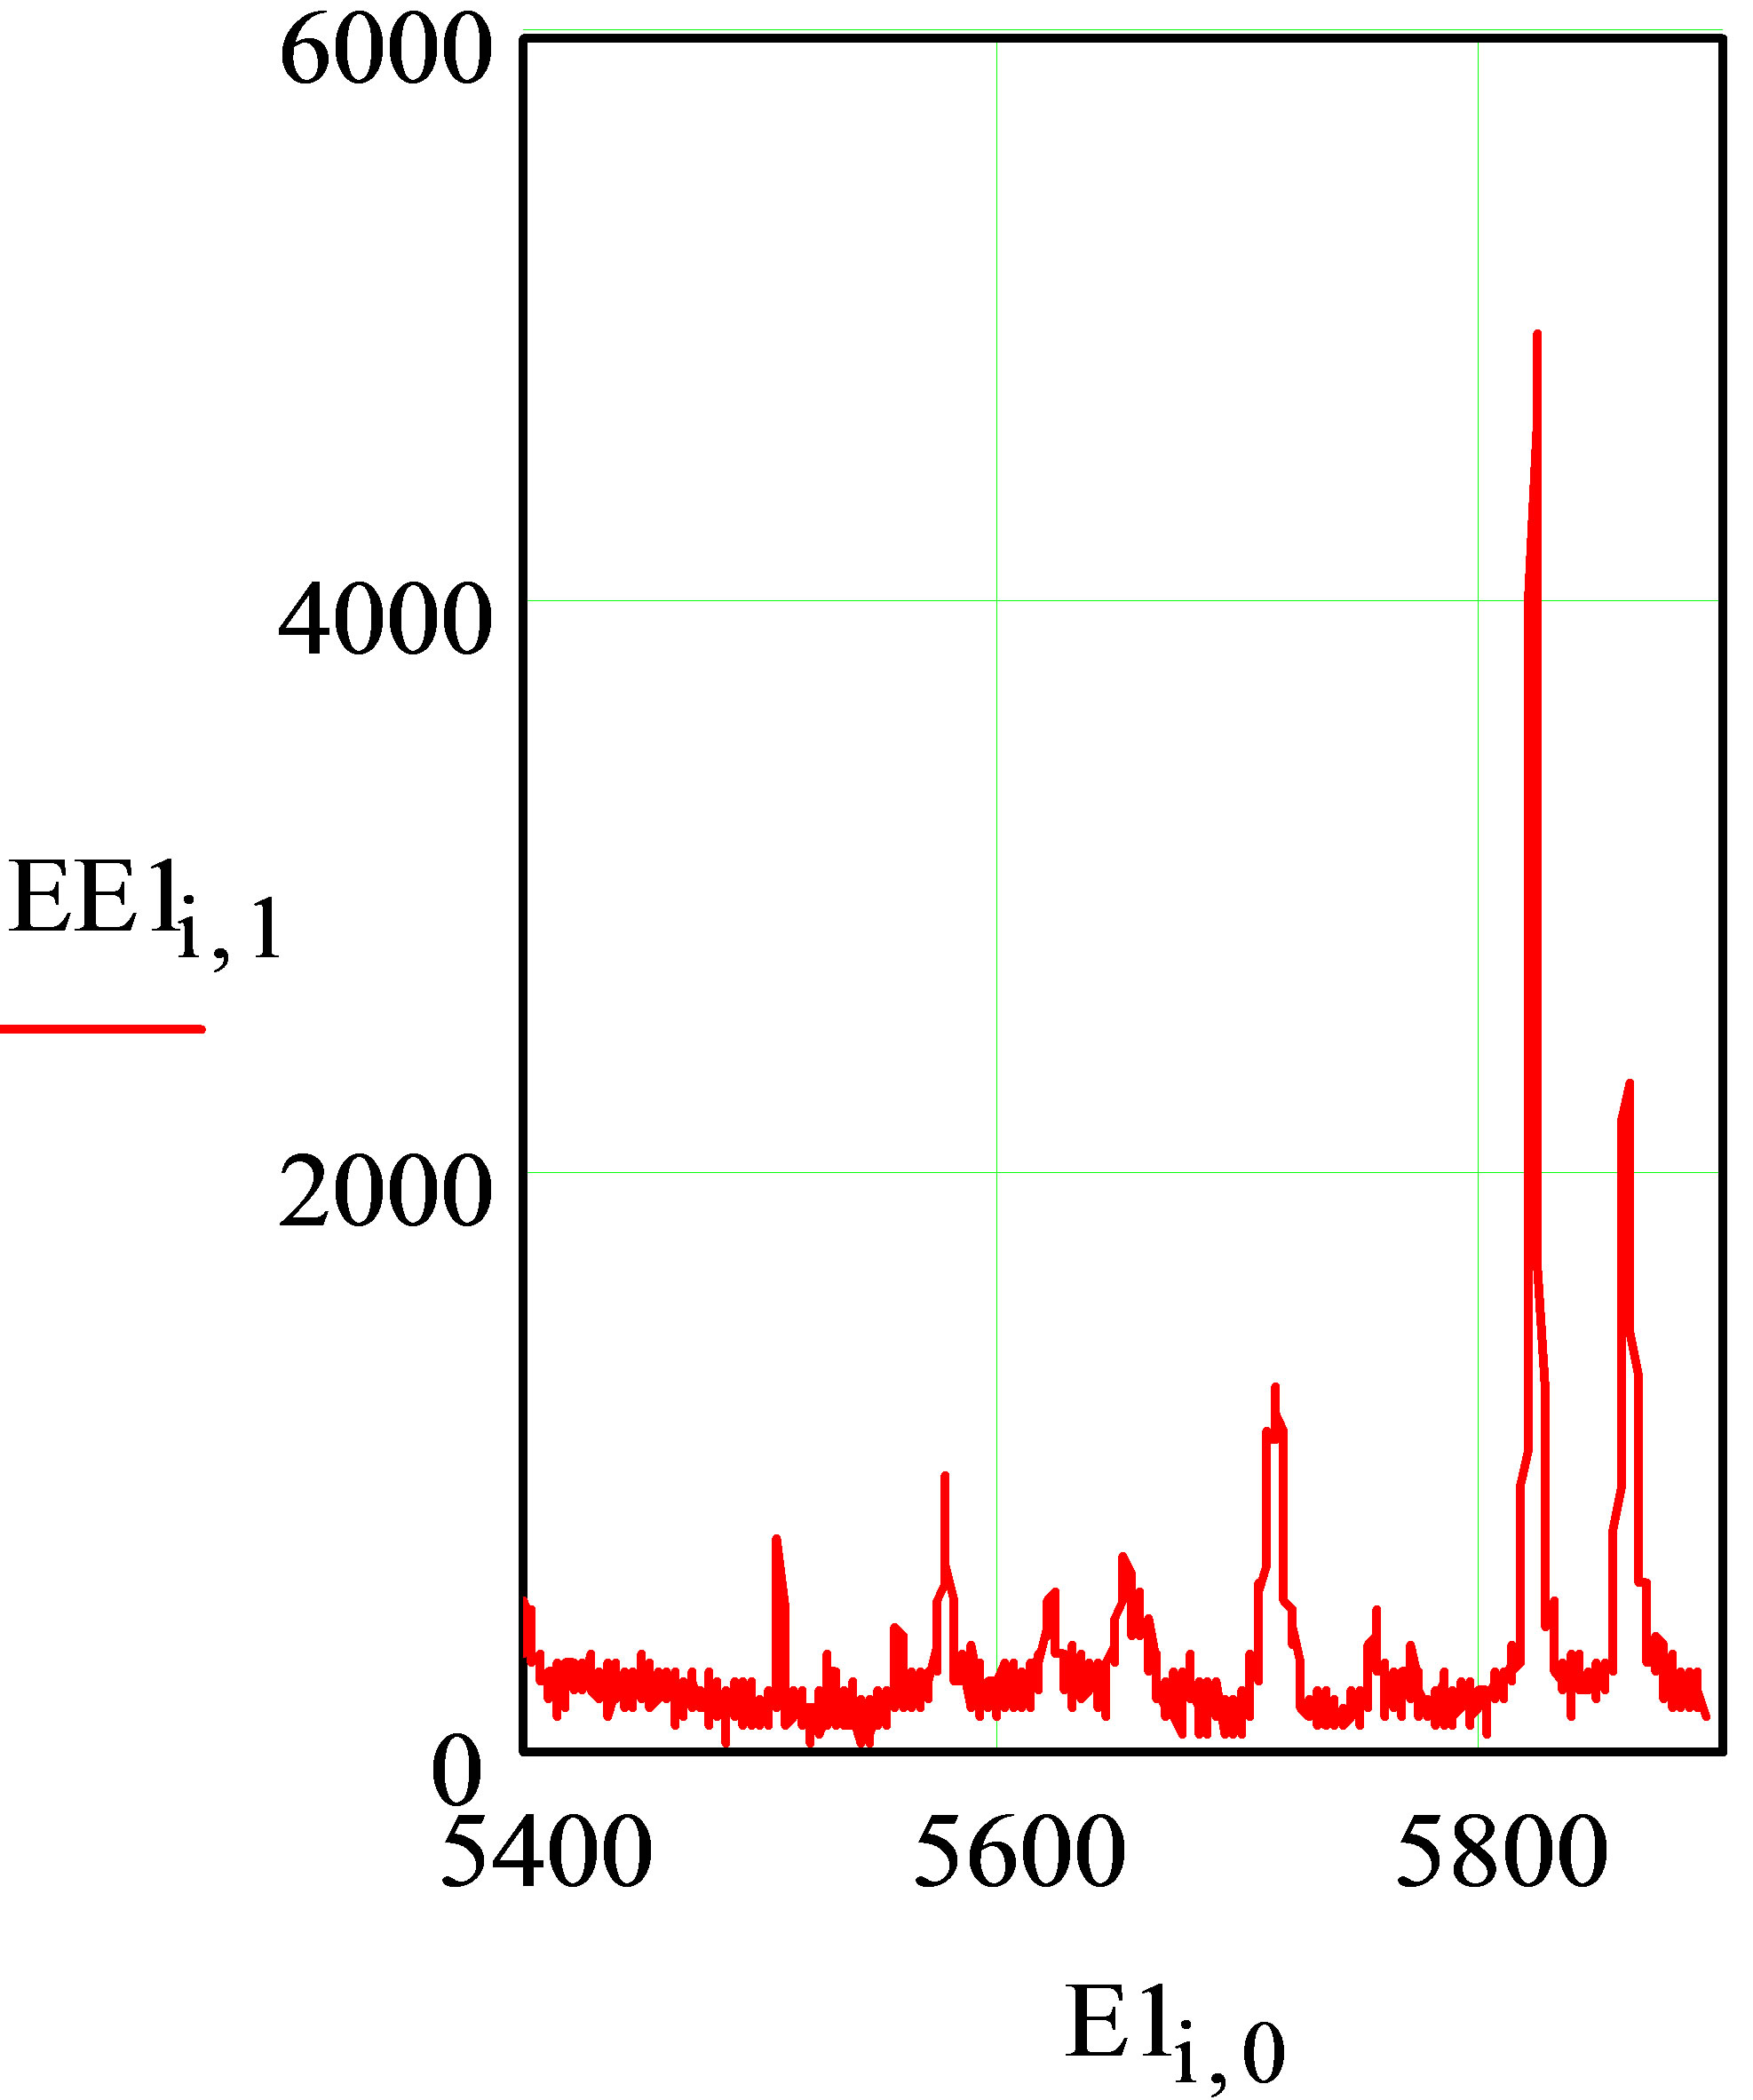 (b)
(b)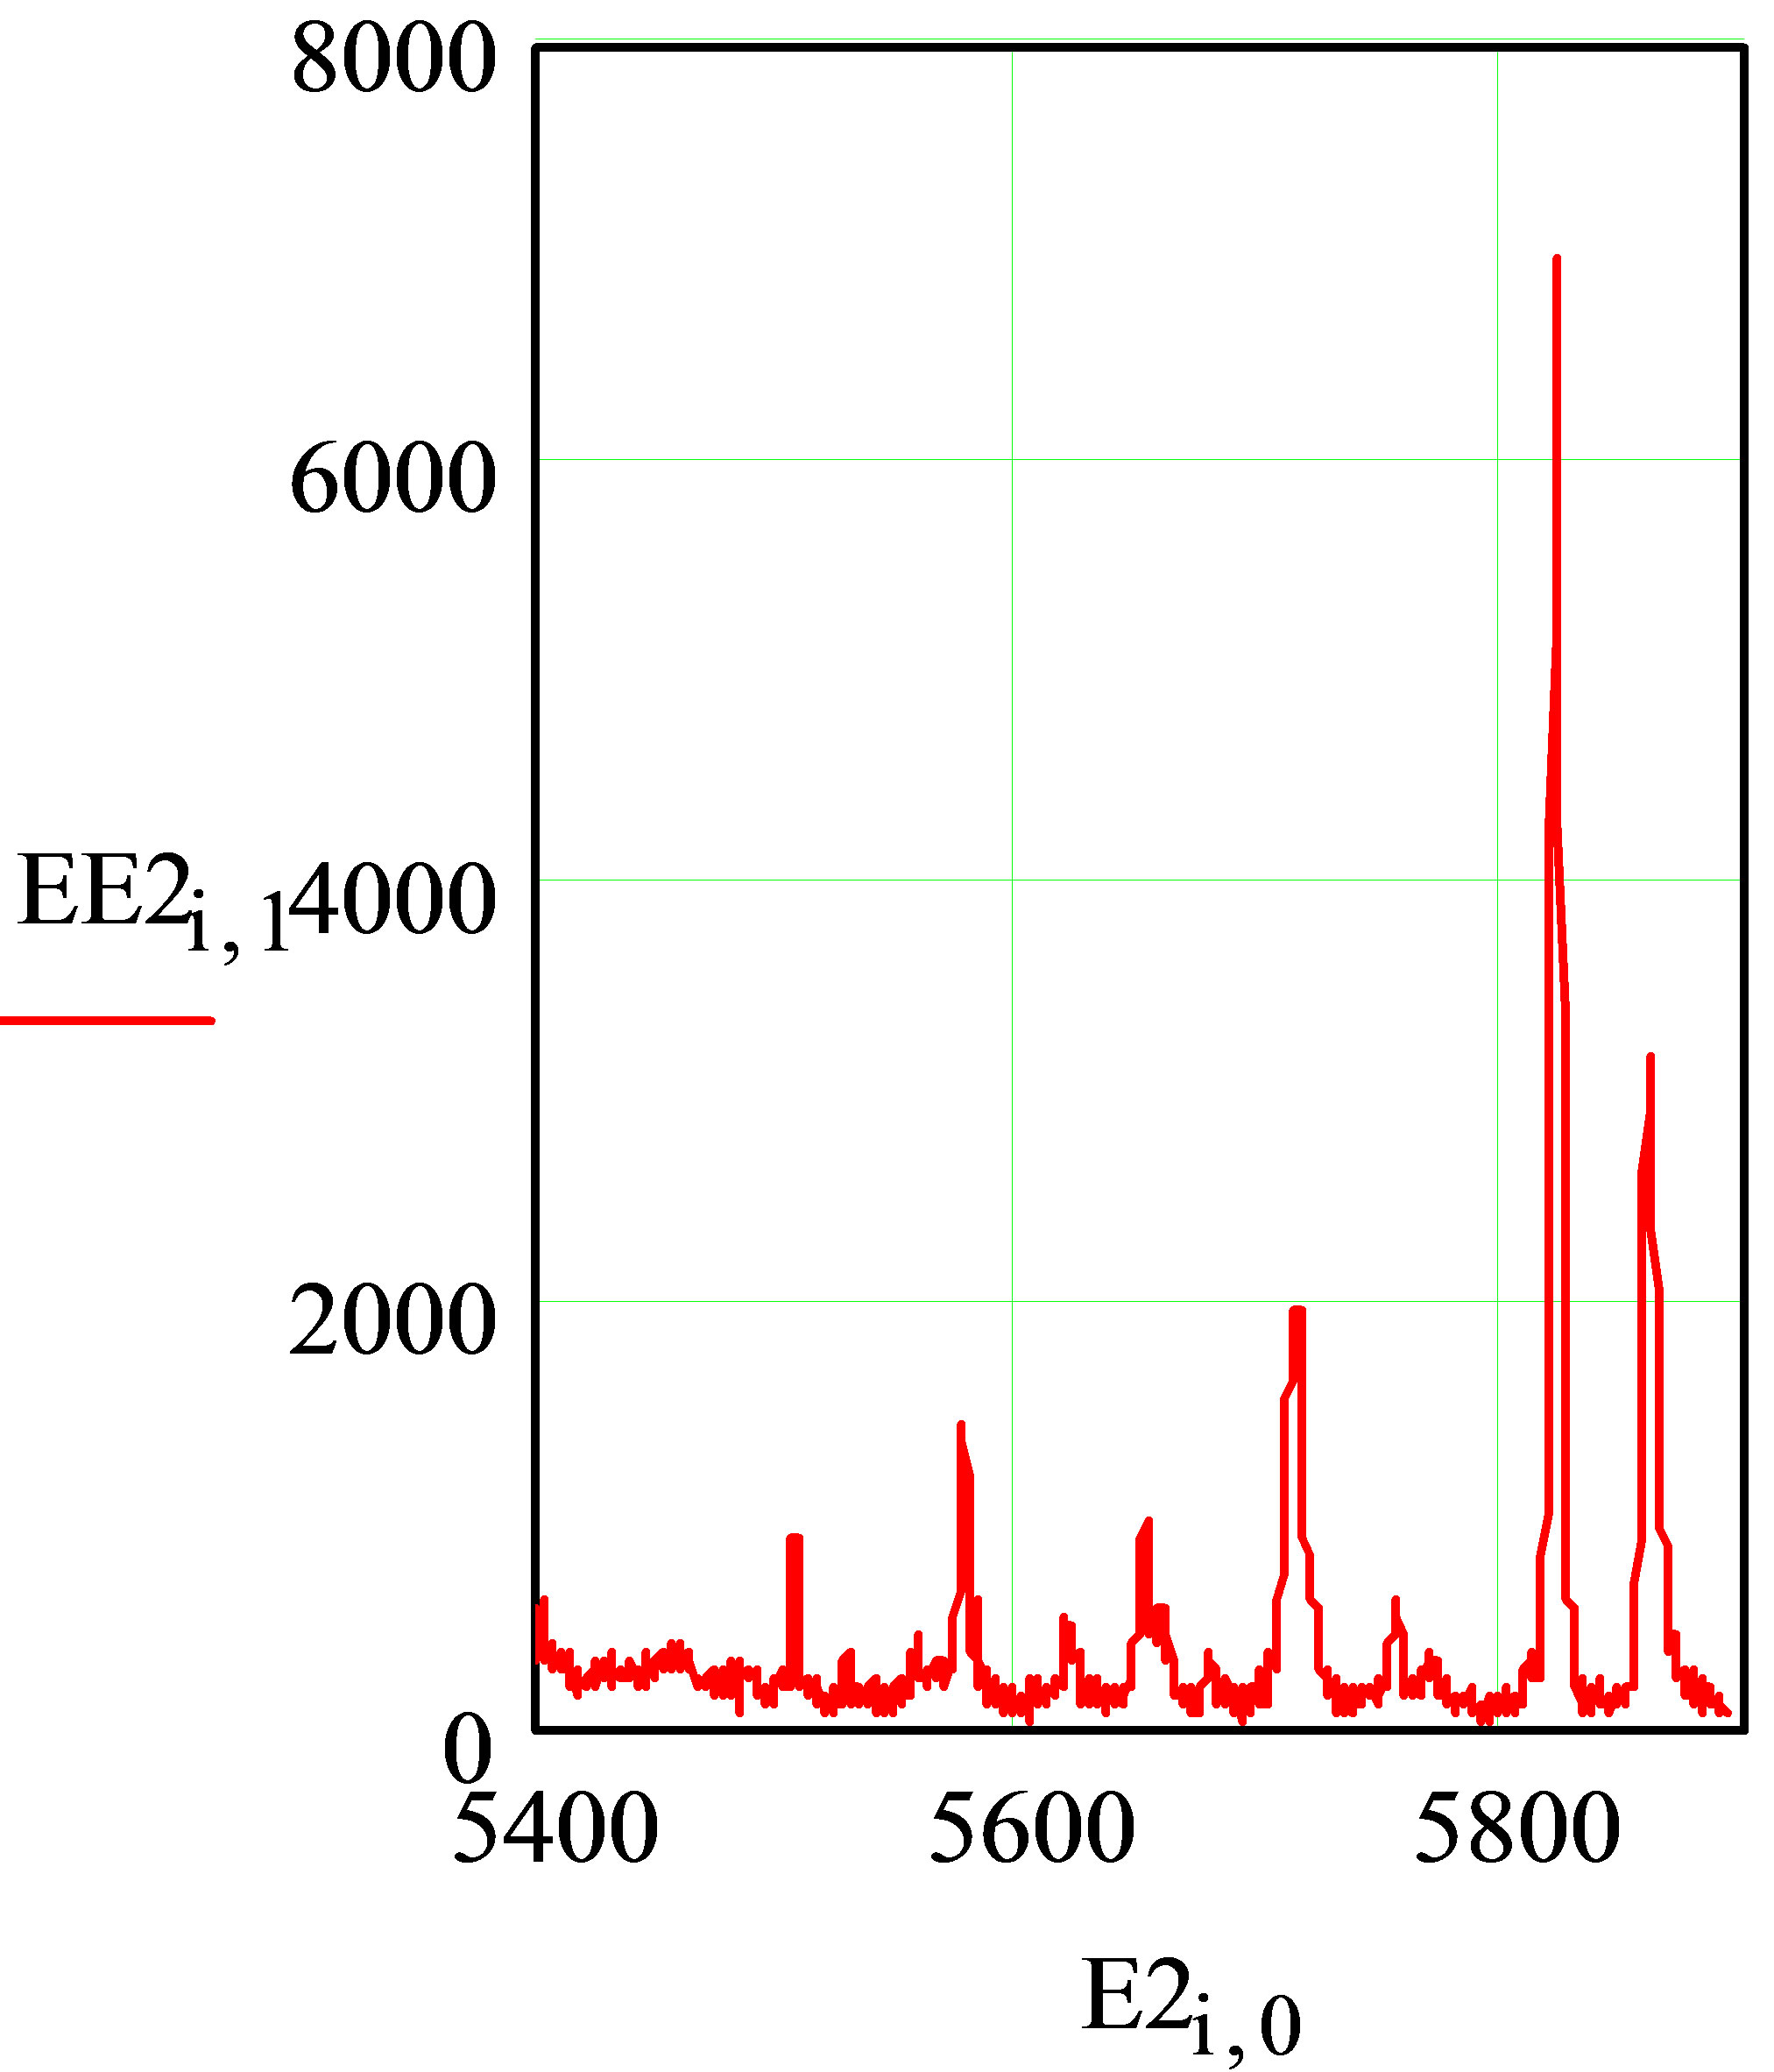 (c)
(c)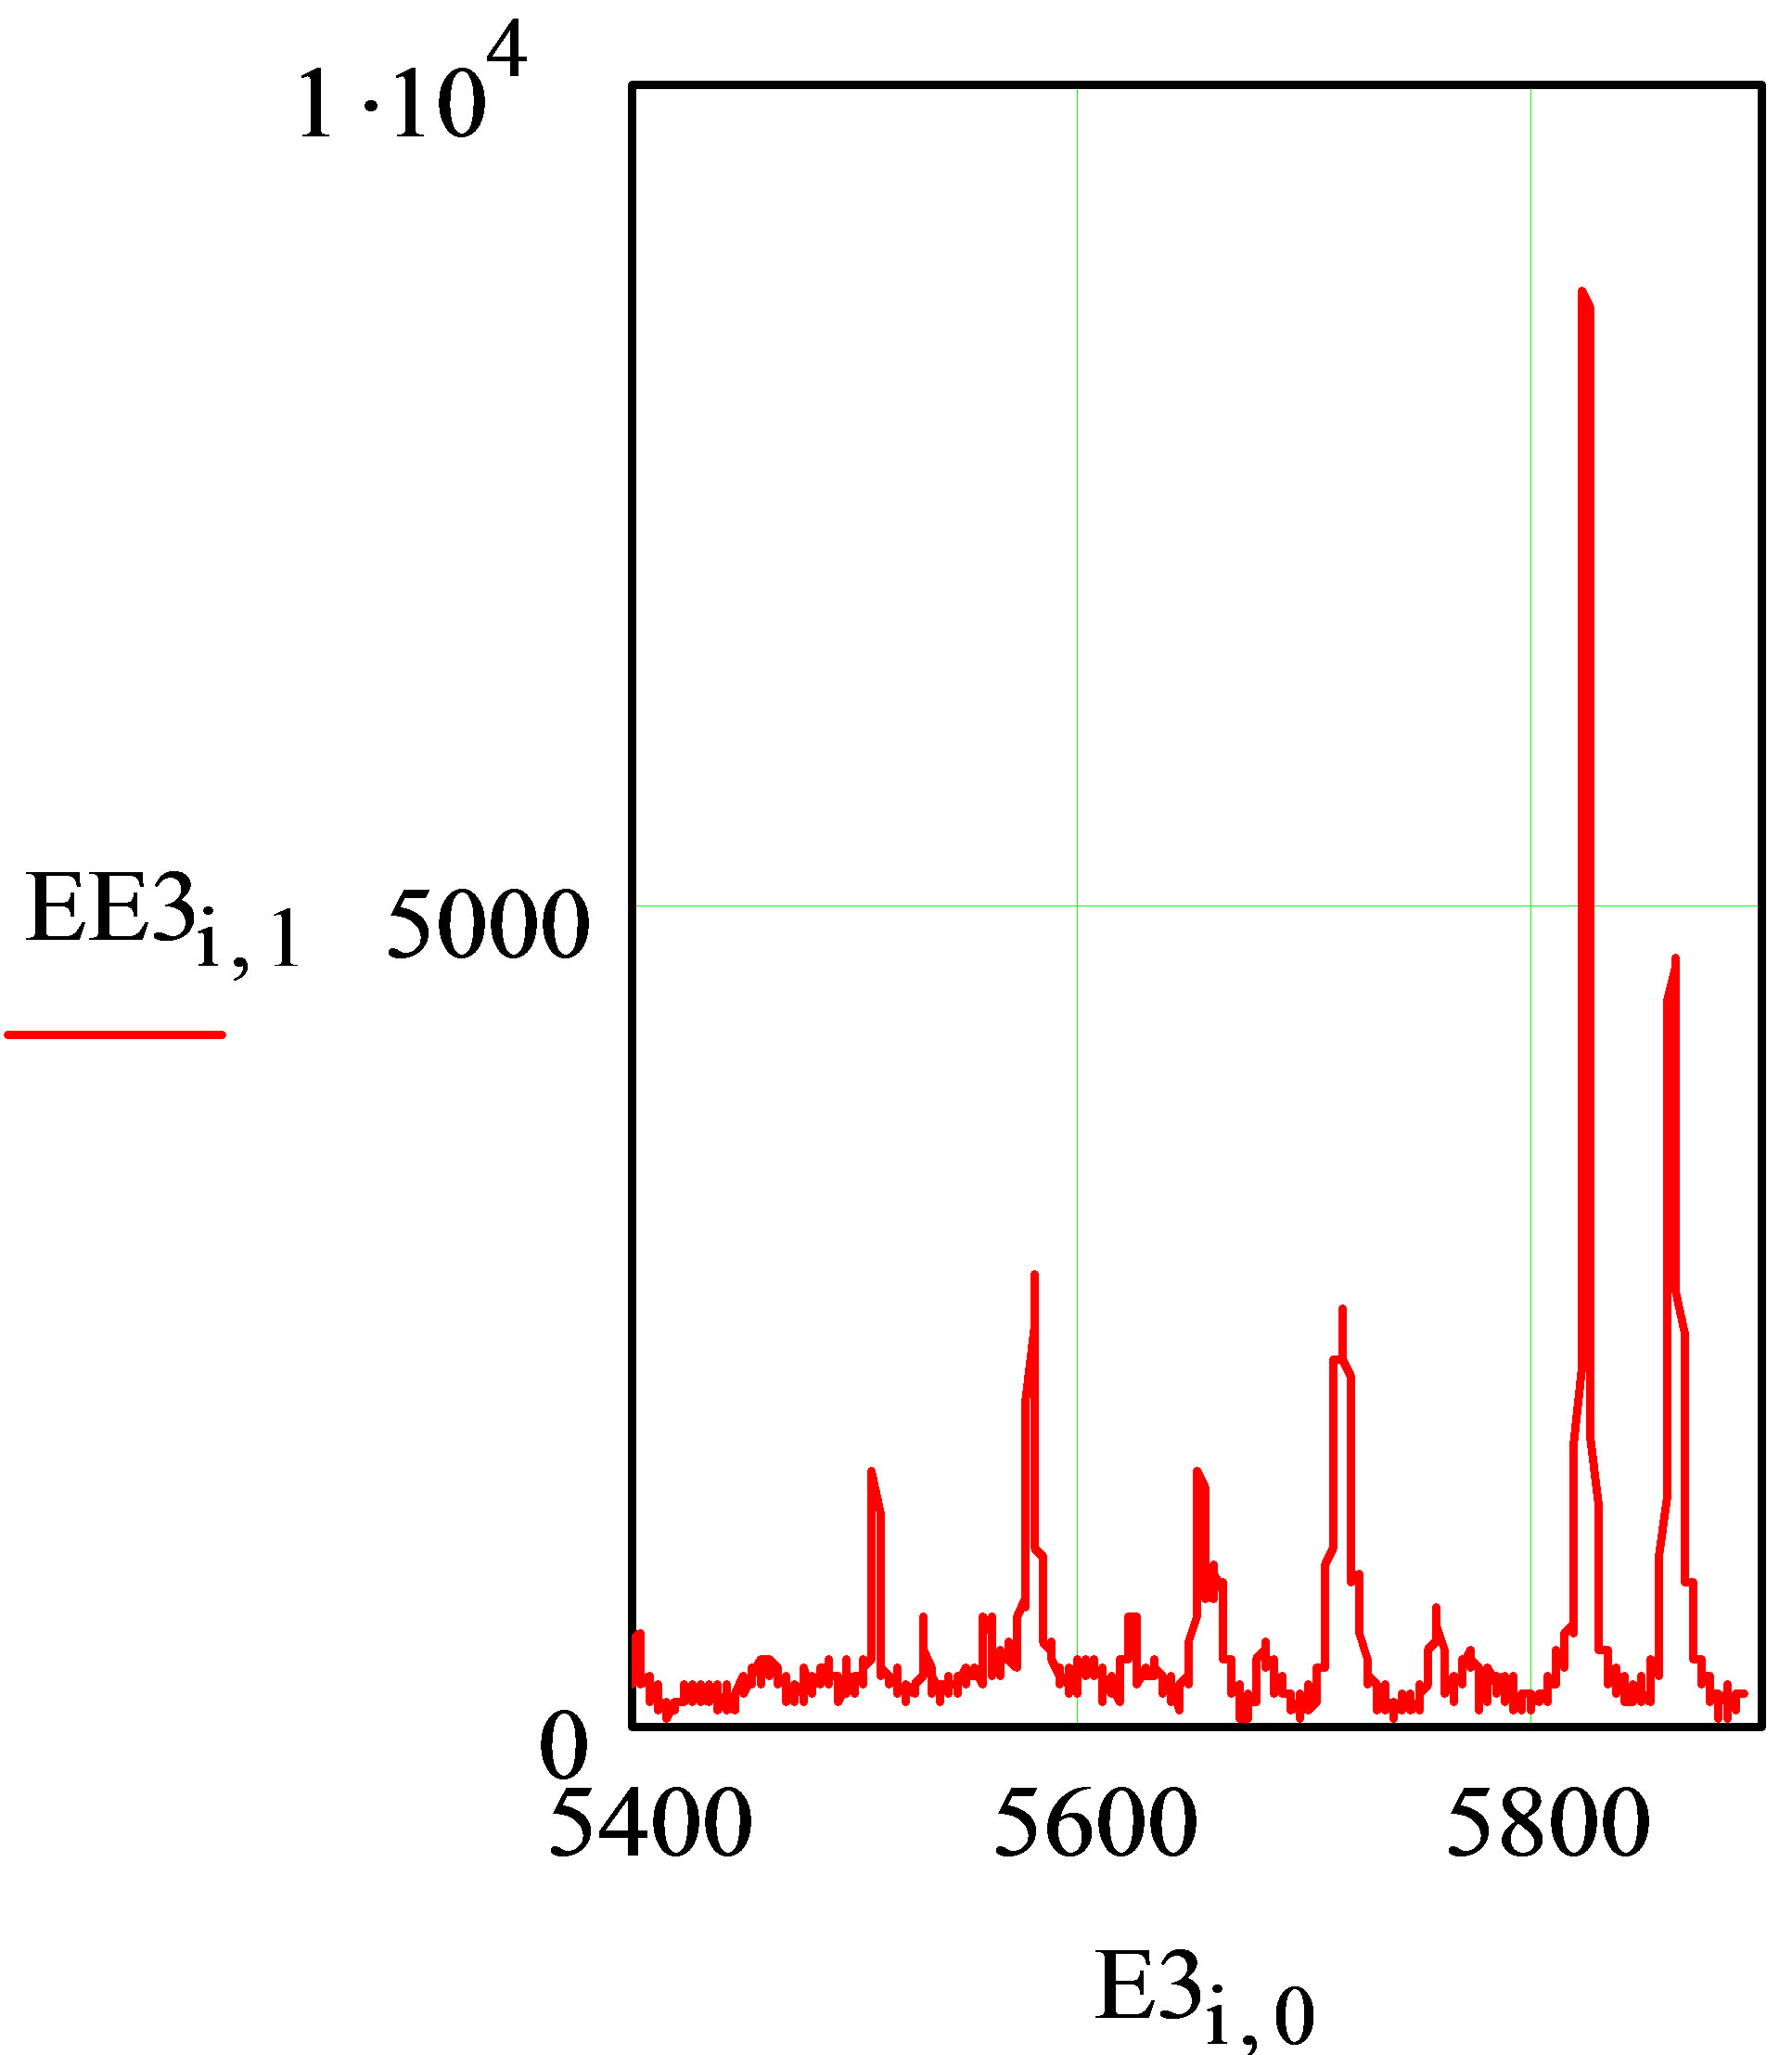 (d)
(d) (e)
(e) (f)
(f) (g)
(g) (h)
(h)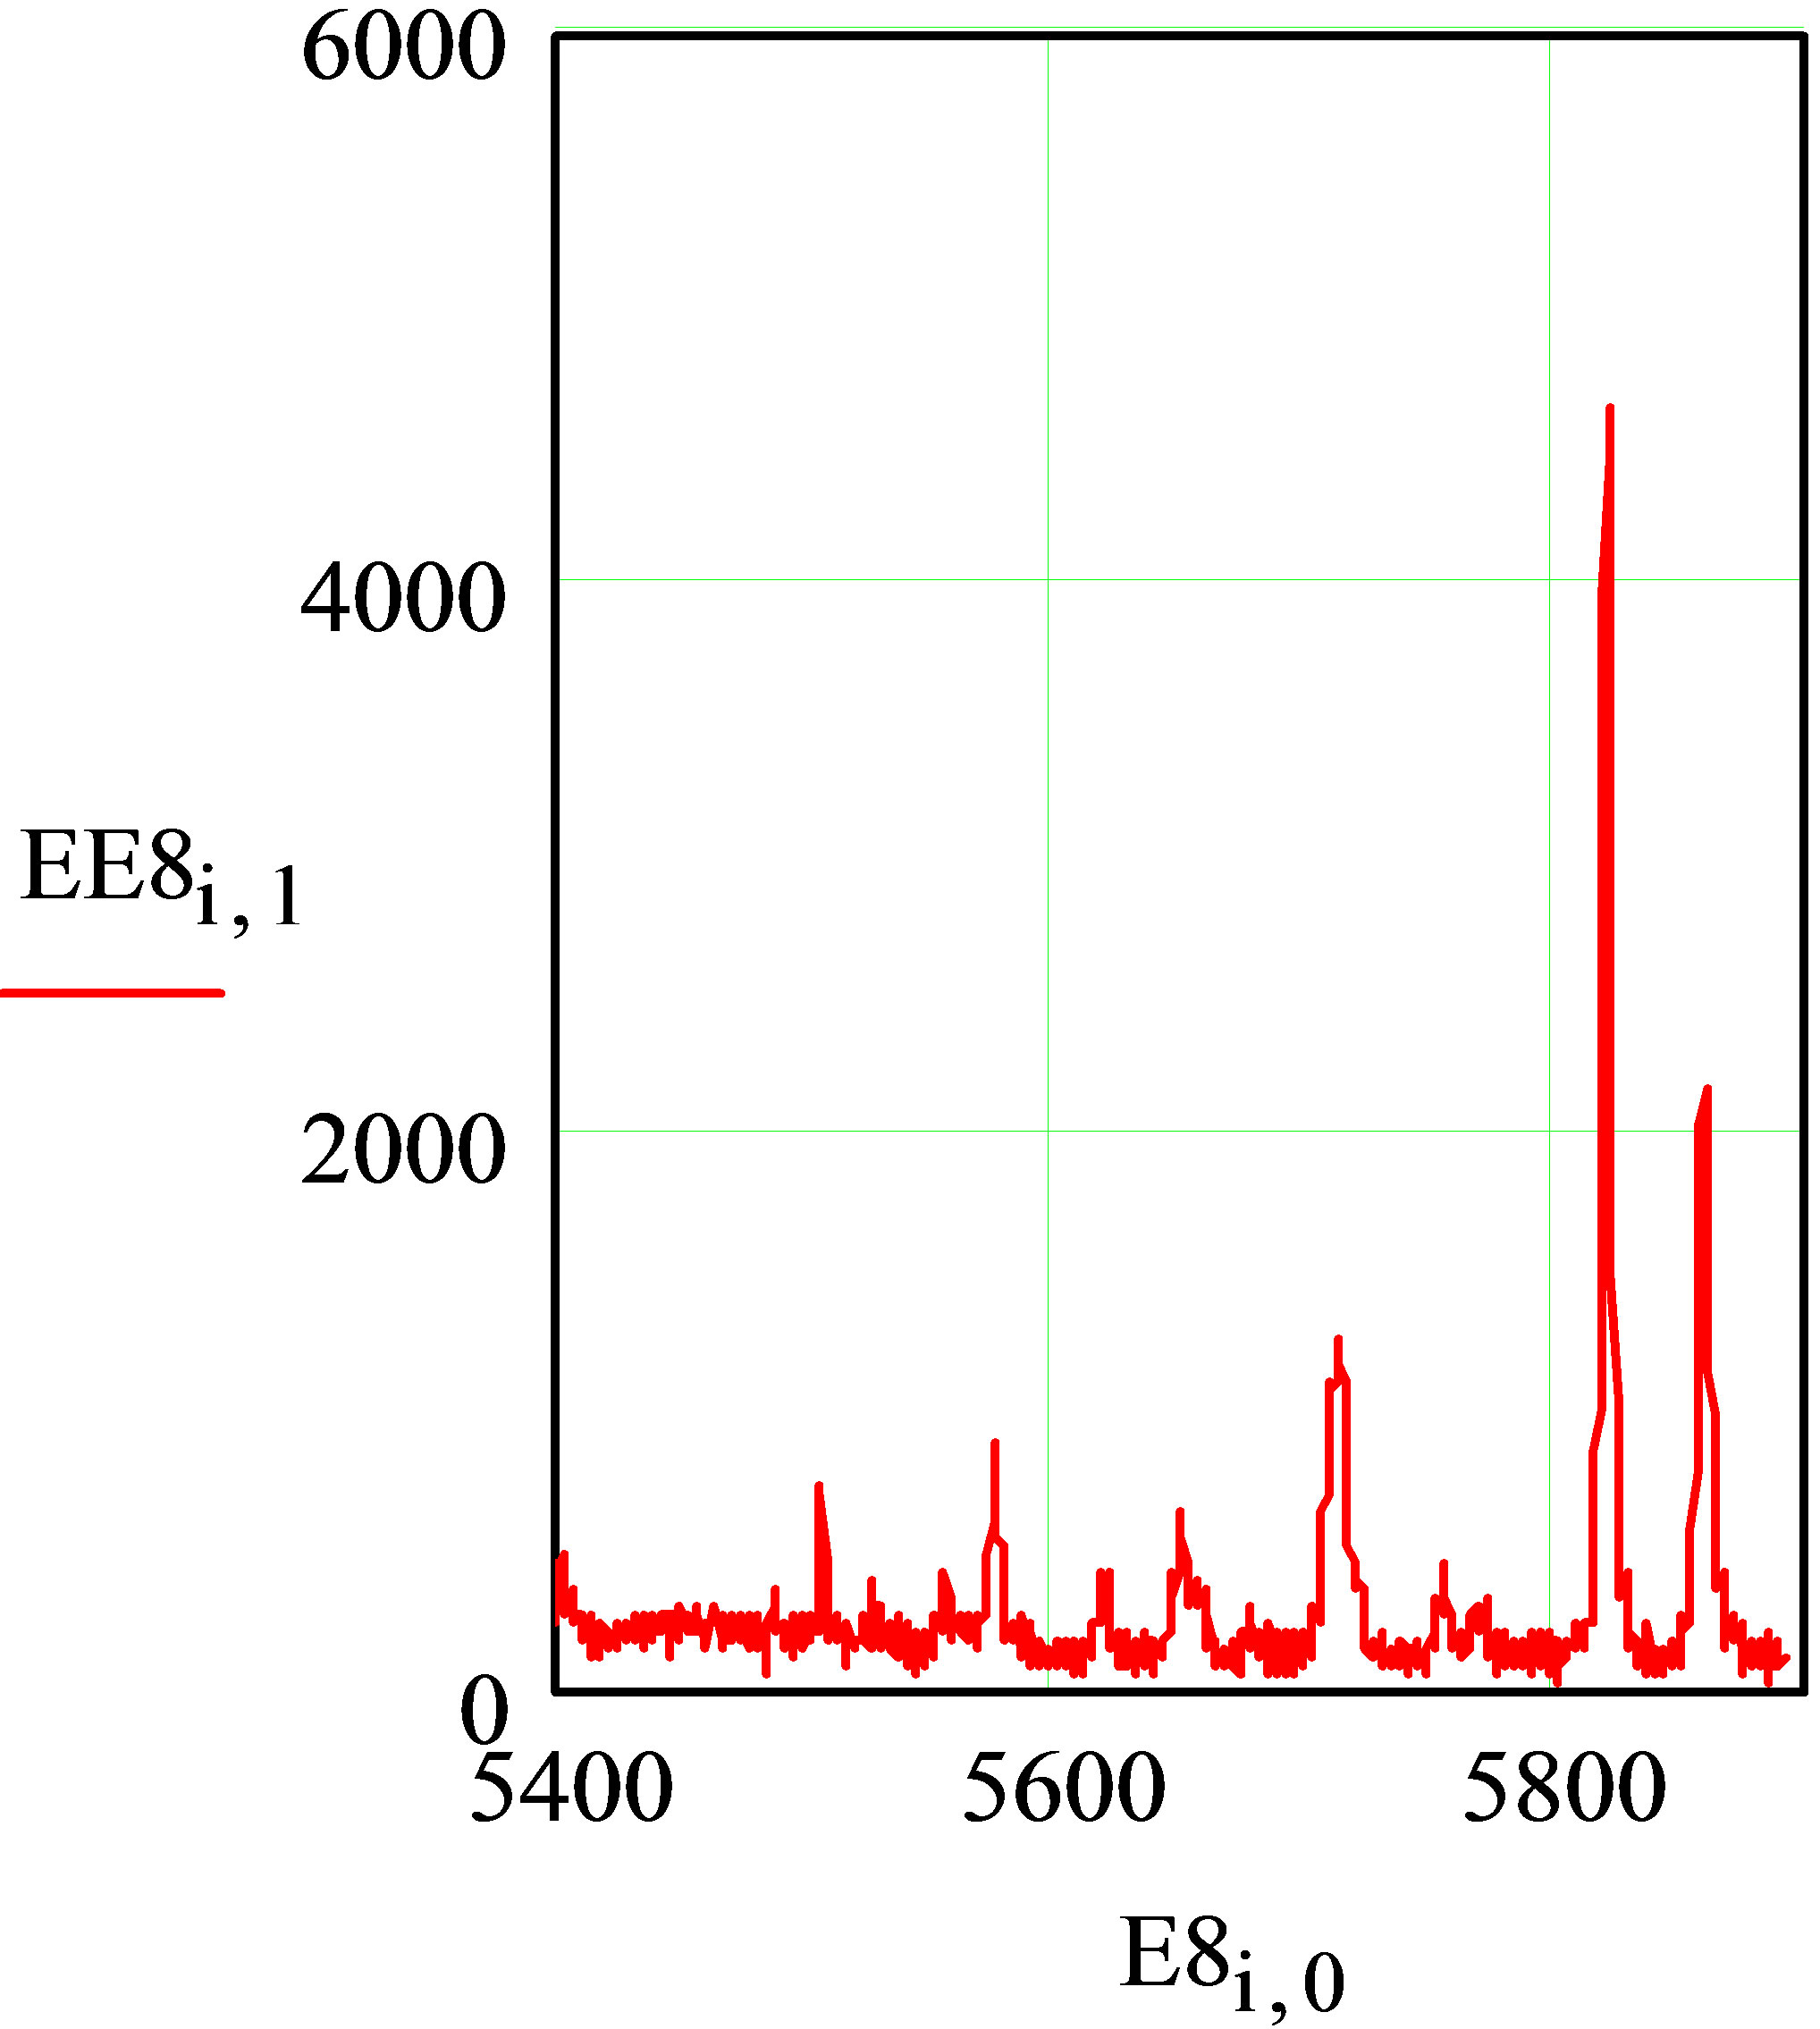 (k)
(k)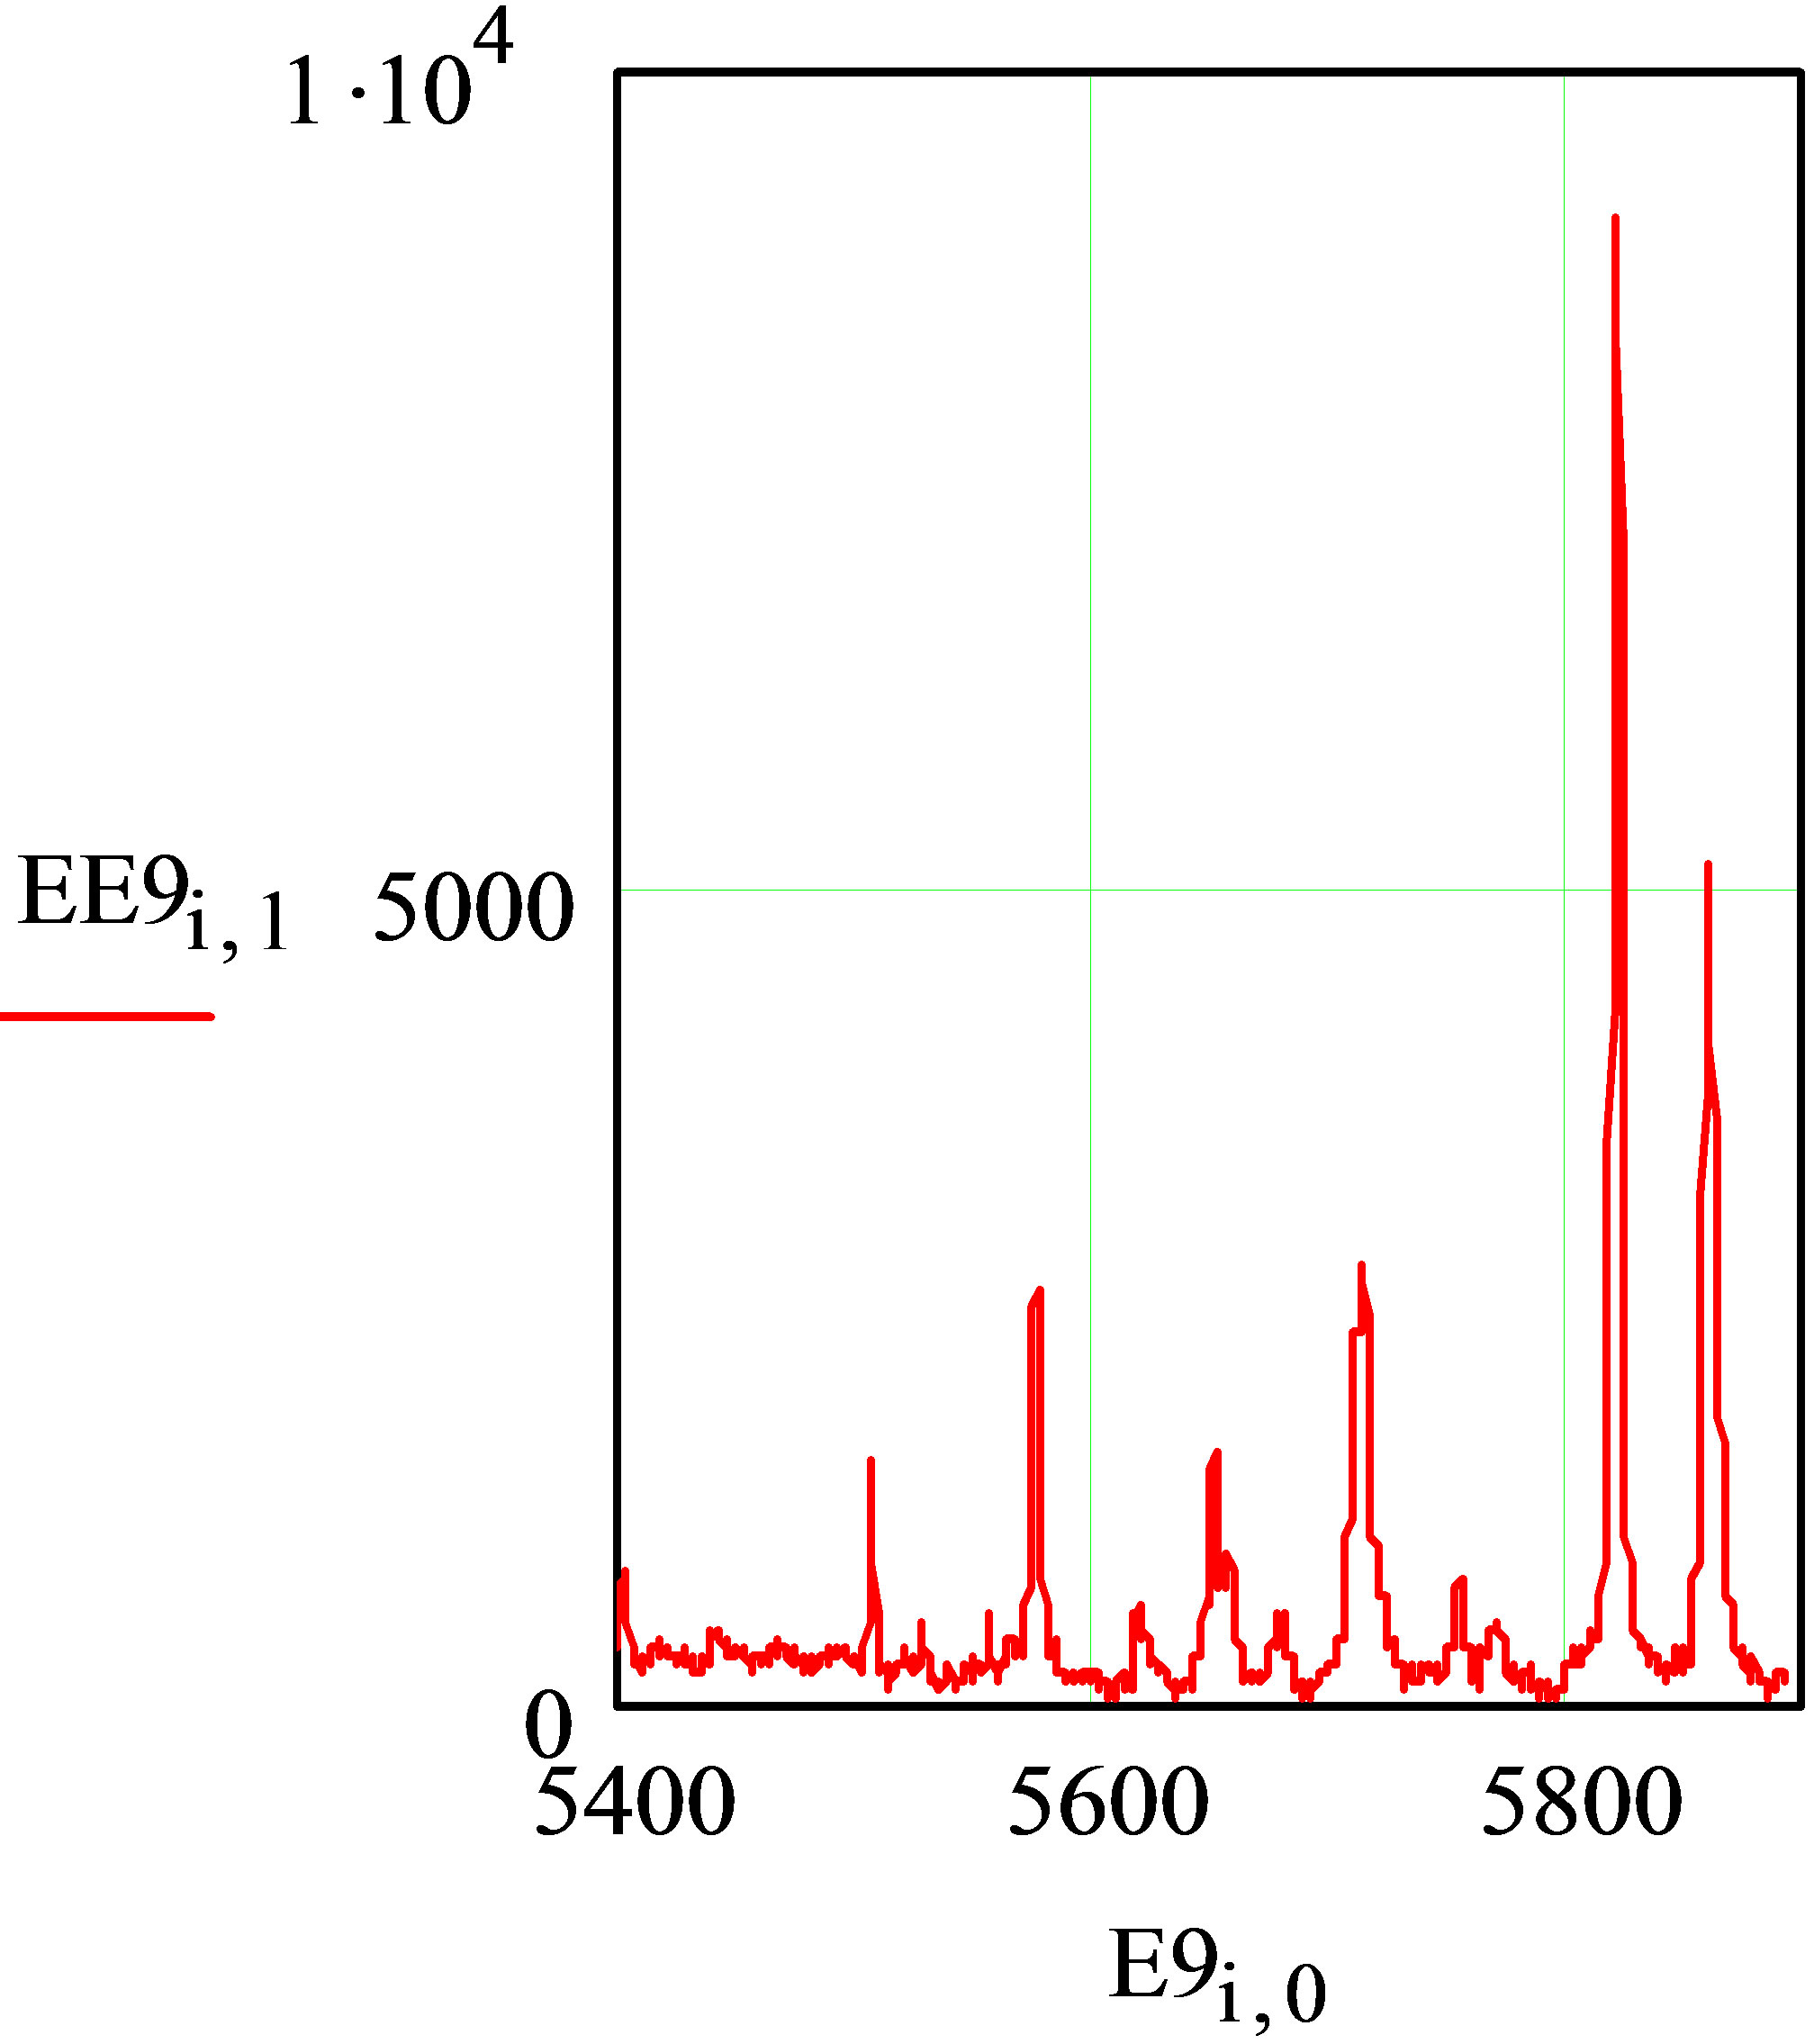 (m)
(m)
Figure 1. Spektrogram PE fibers without the background of fluorescent components: (a, b, c): Spectrogram PE fibers without silver nanoparticles; (d, e, f, g): Spectrogram PE fibers with silver nanoparticles deposited dried in natural conditions; (h, k, m): Spectrogram PE fibers deposited silver nanoparticles, dried in an oven.
Ei, 0 and the second column EEi, 1; and according to Figure 1(b): the matrix S1 with the first column E1i, 0 and the second column EE1i, 1, according to Figure 1(c): matrix S2 with the first column E2i, 0 and a second column EE2i, 1 and so on:
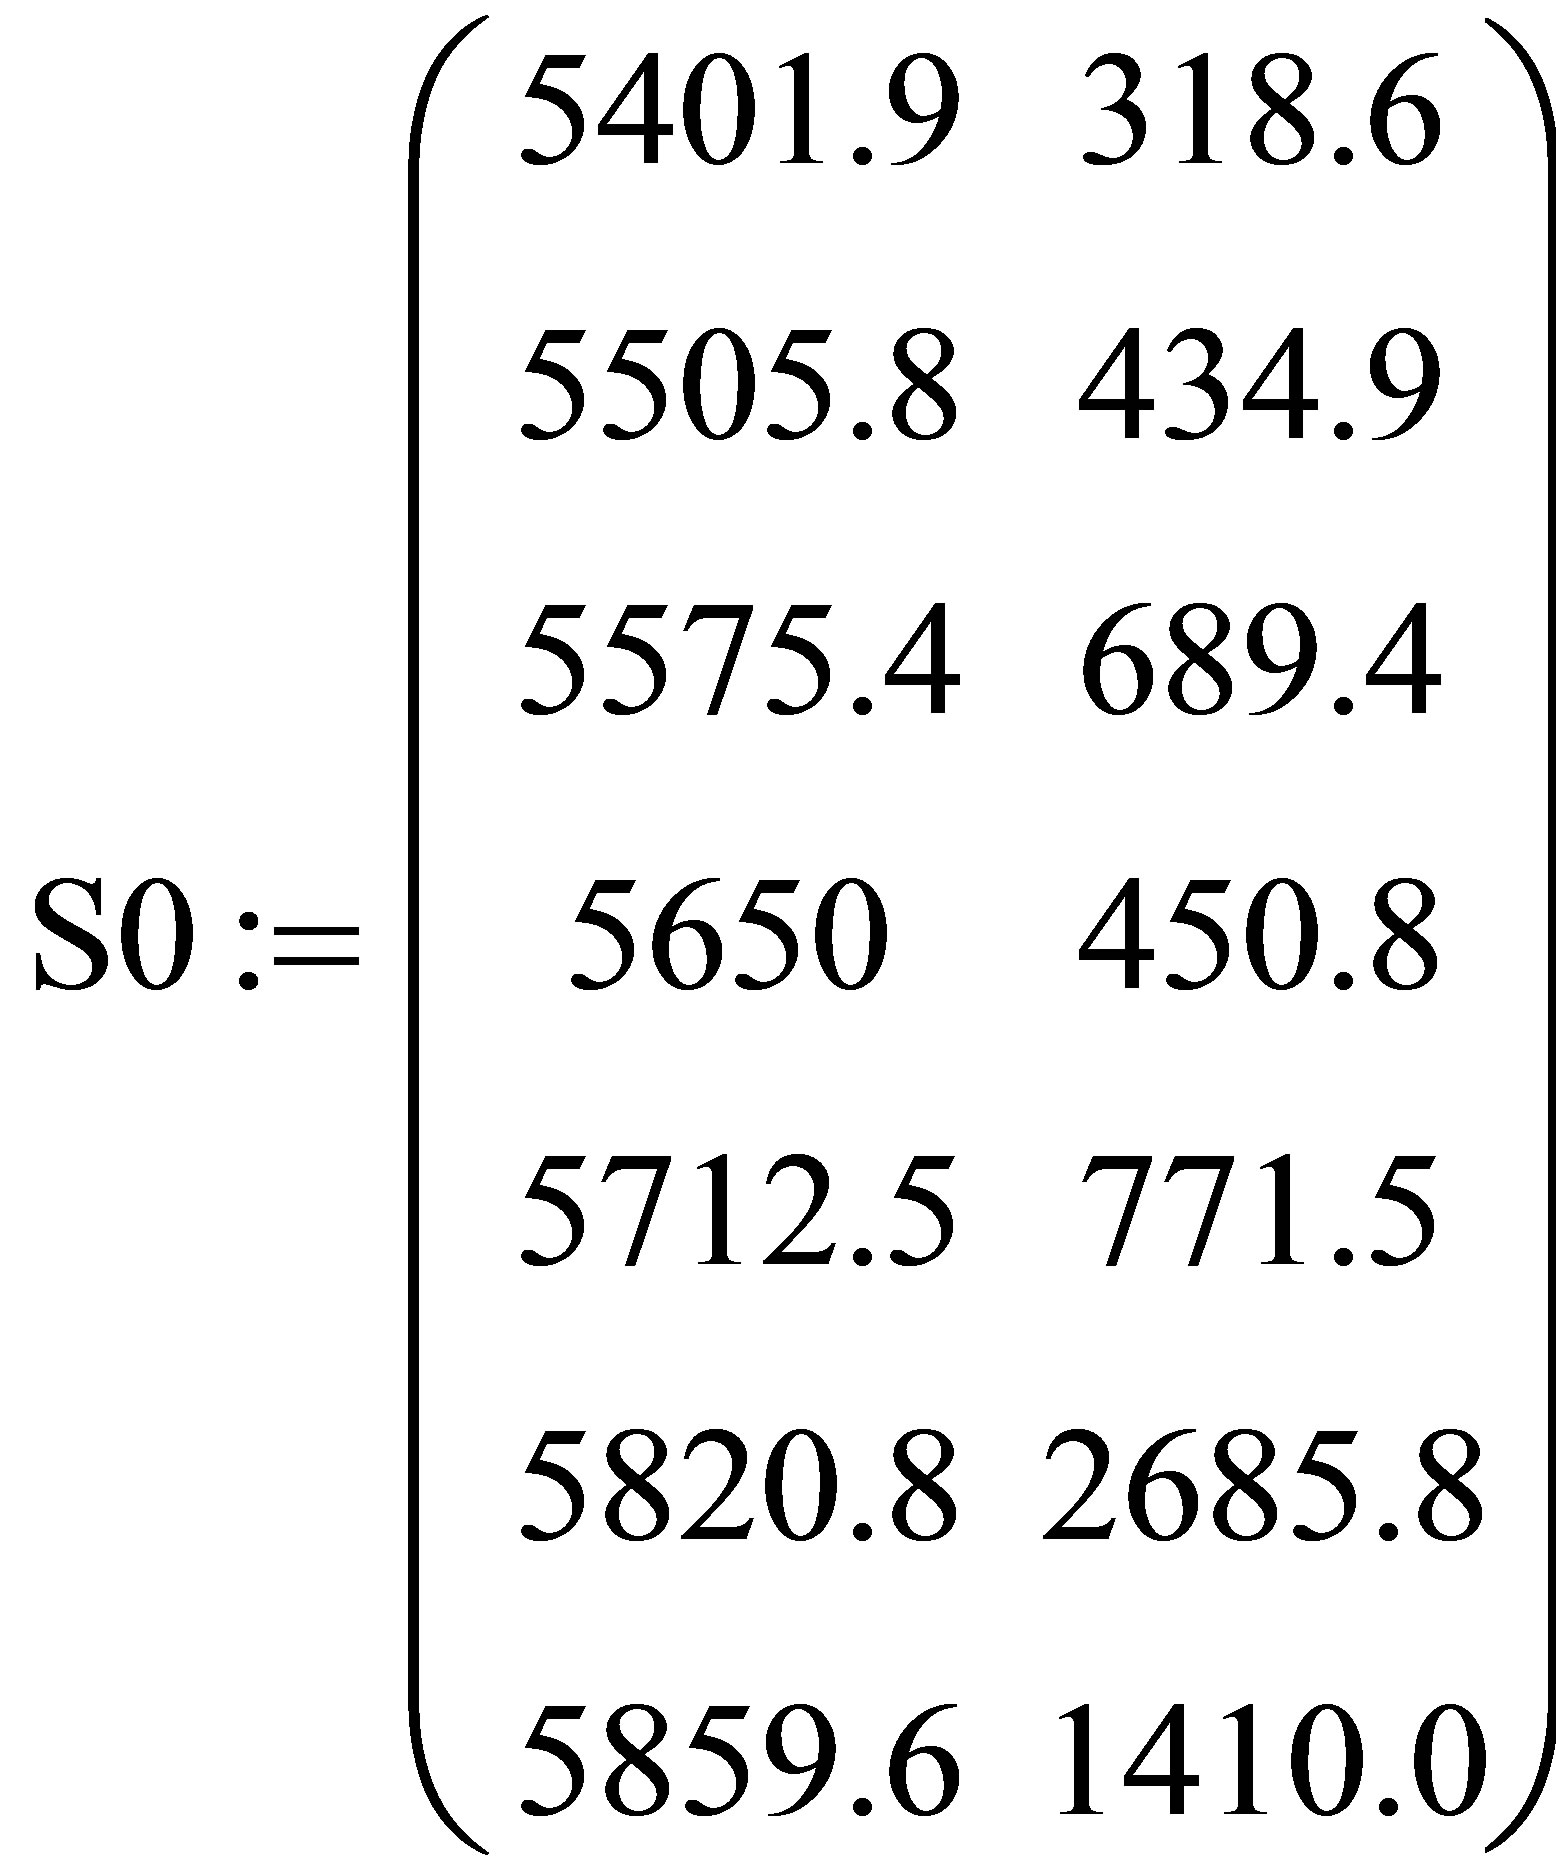
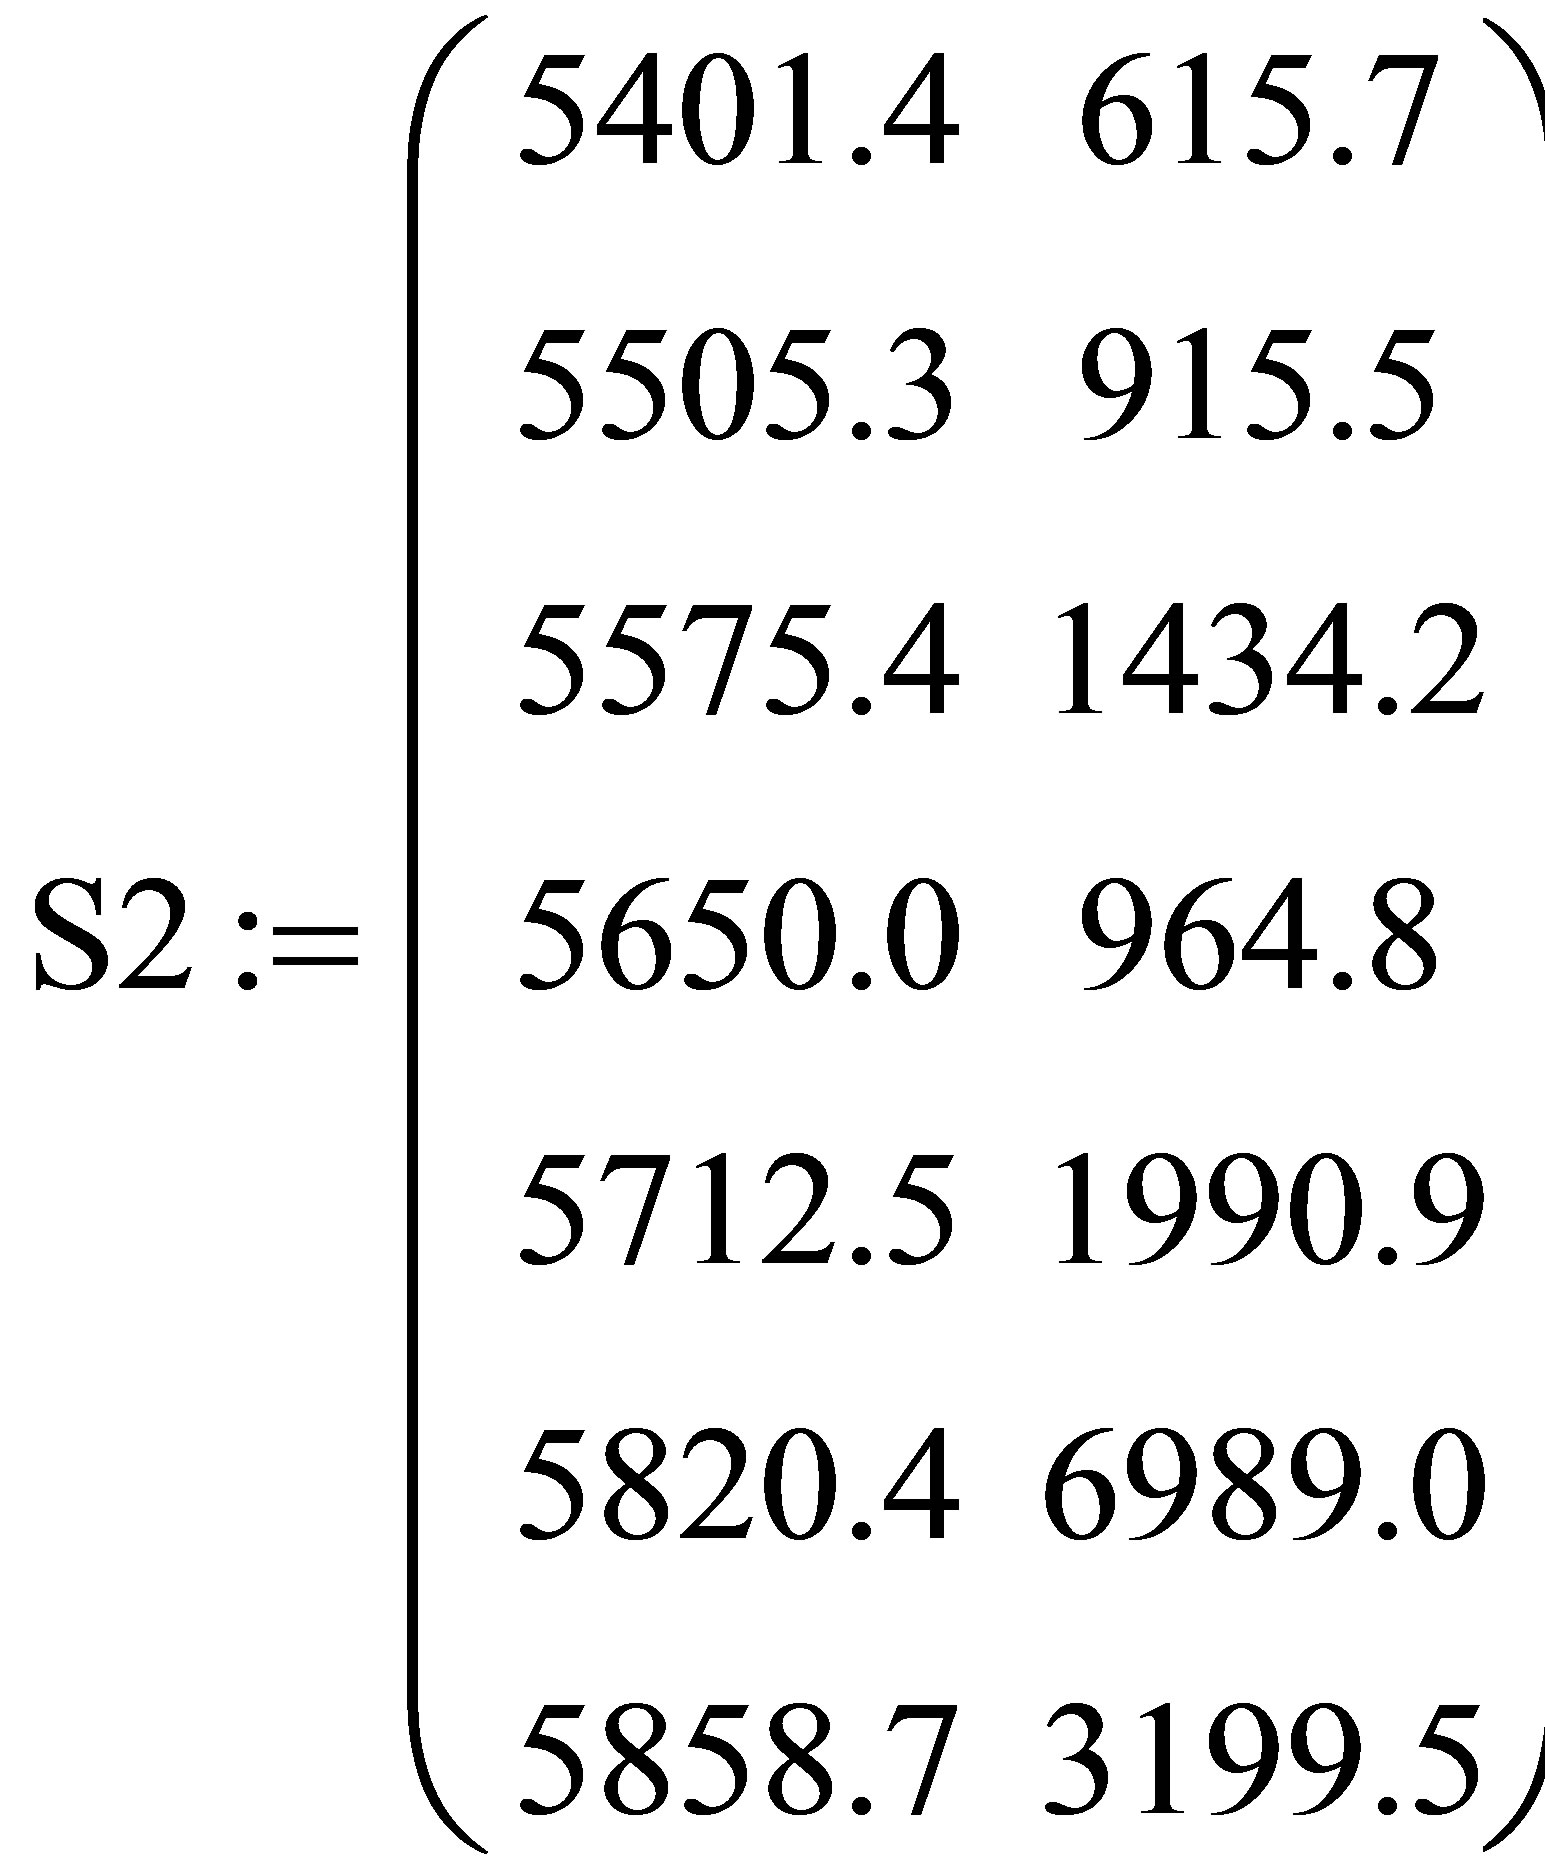
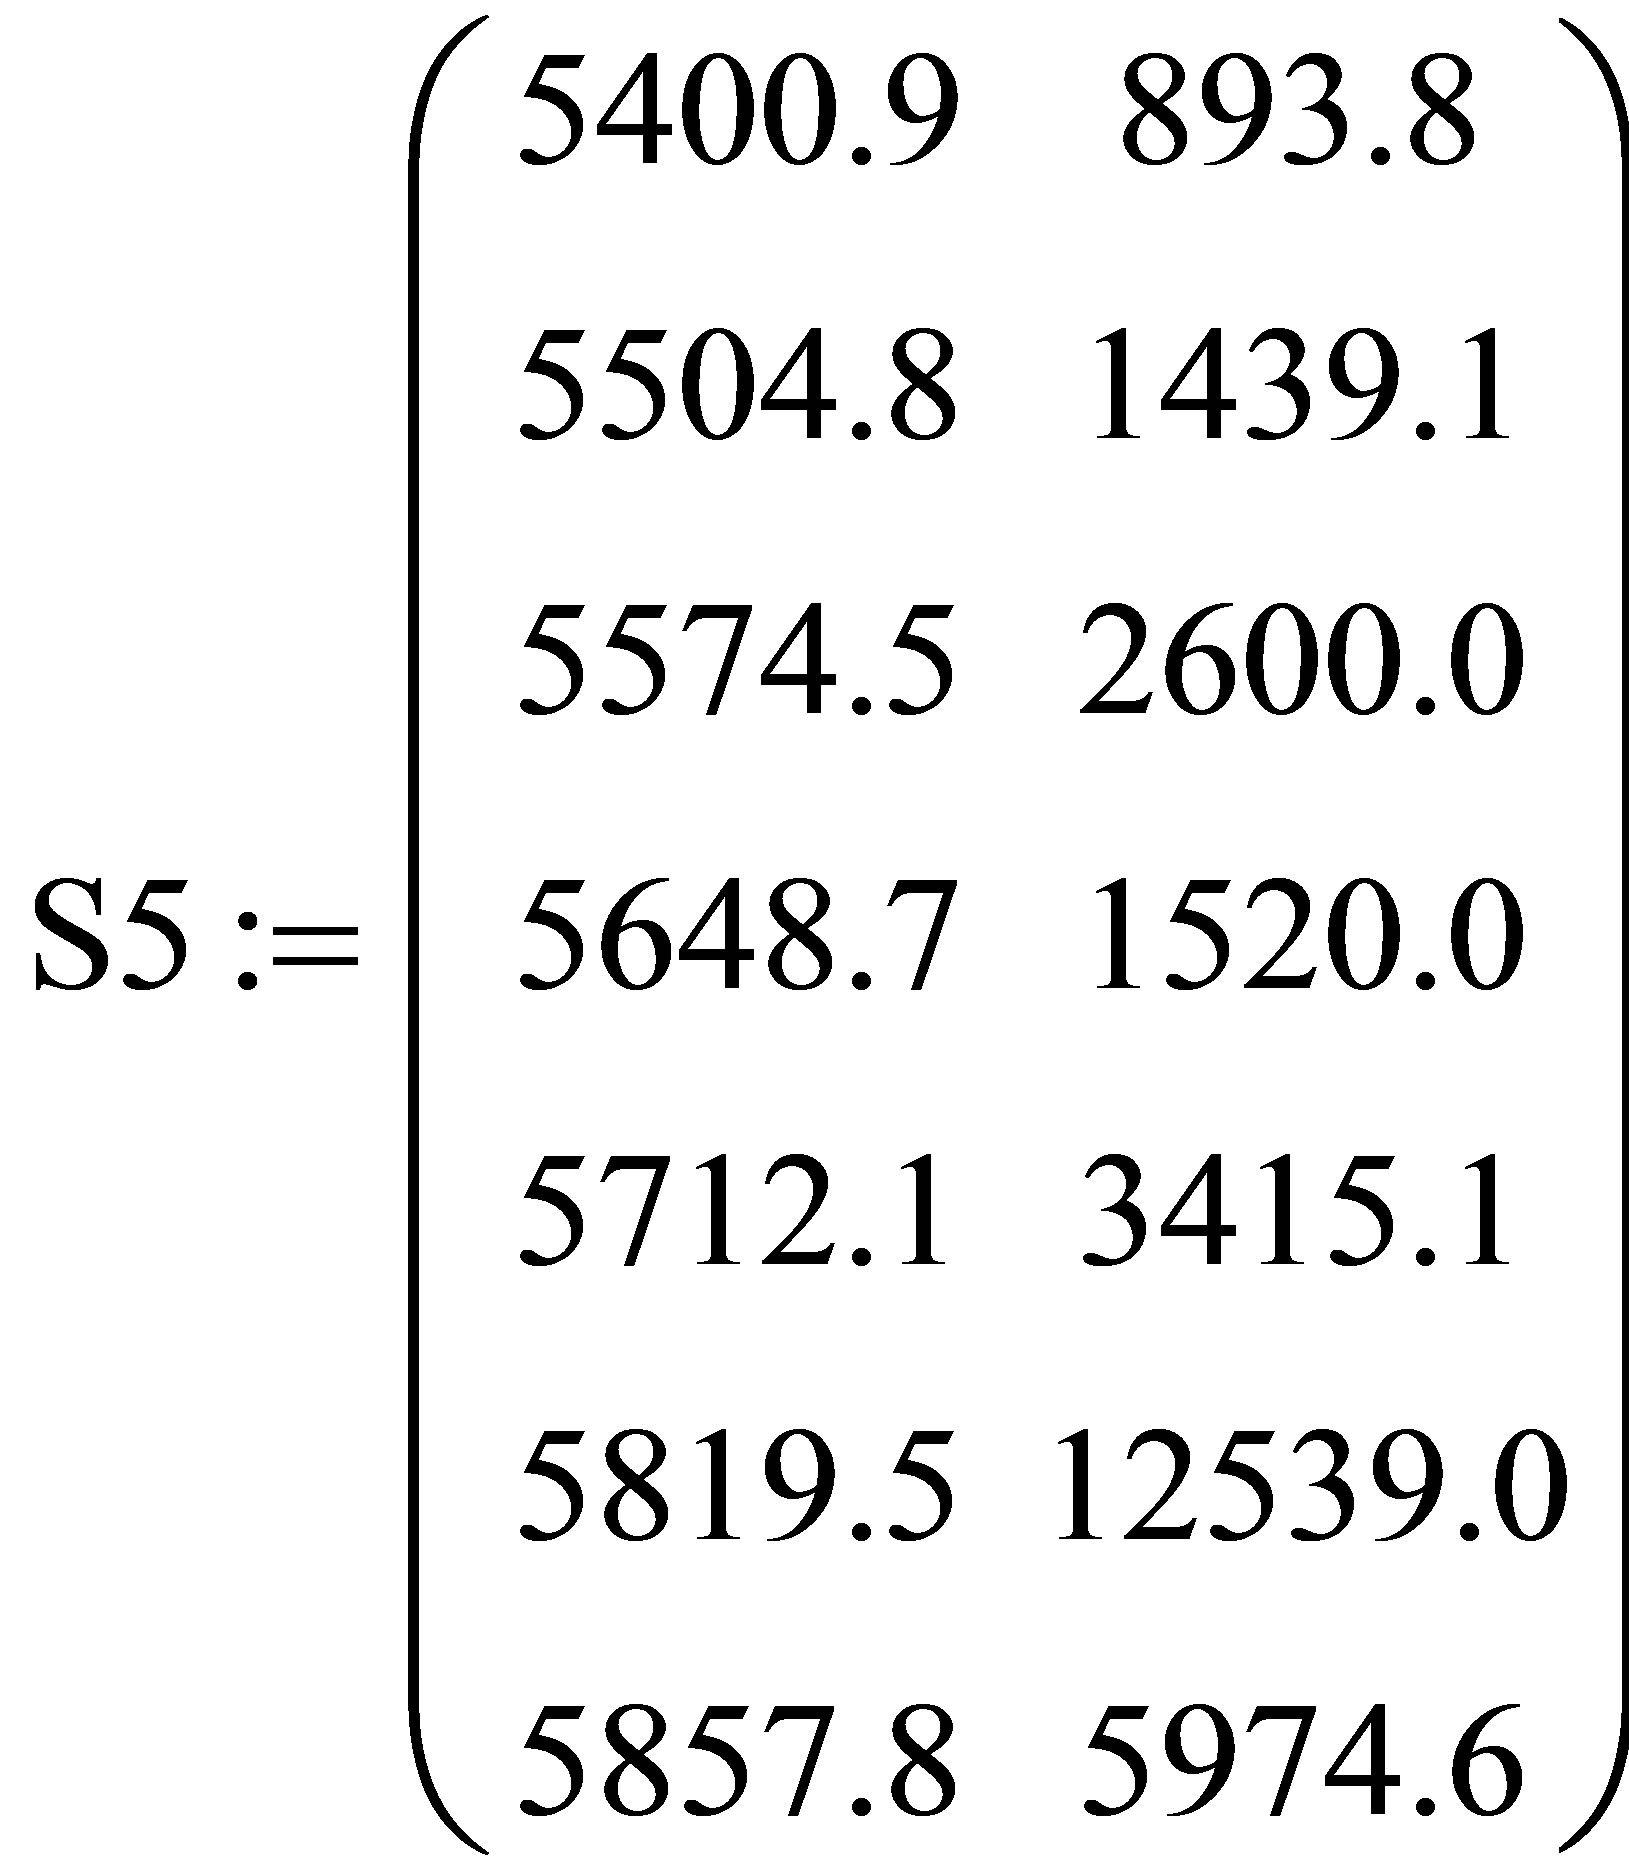
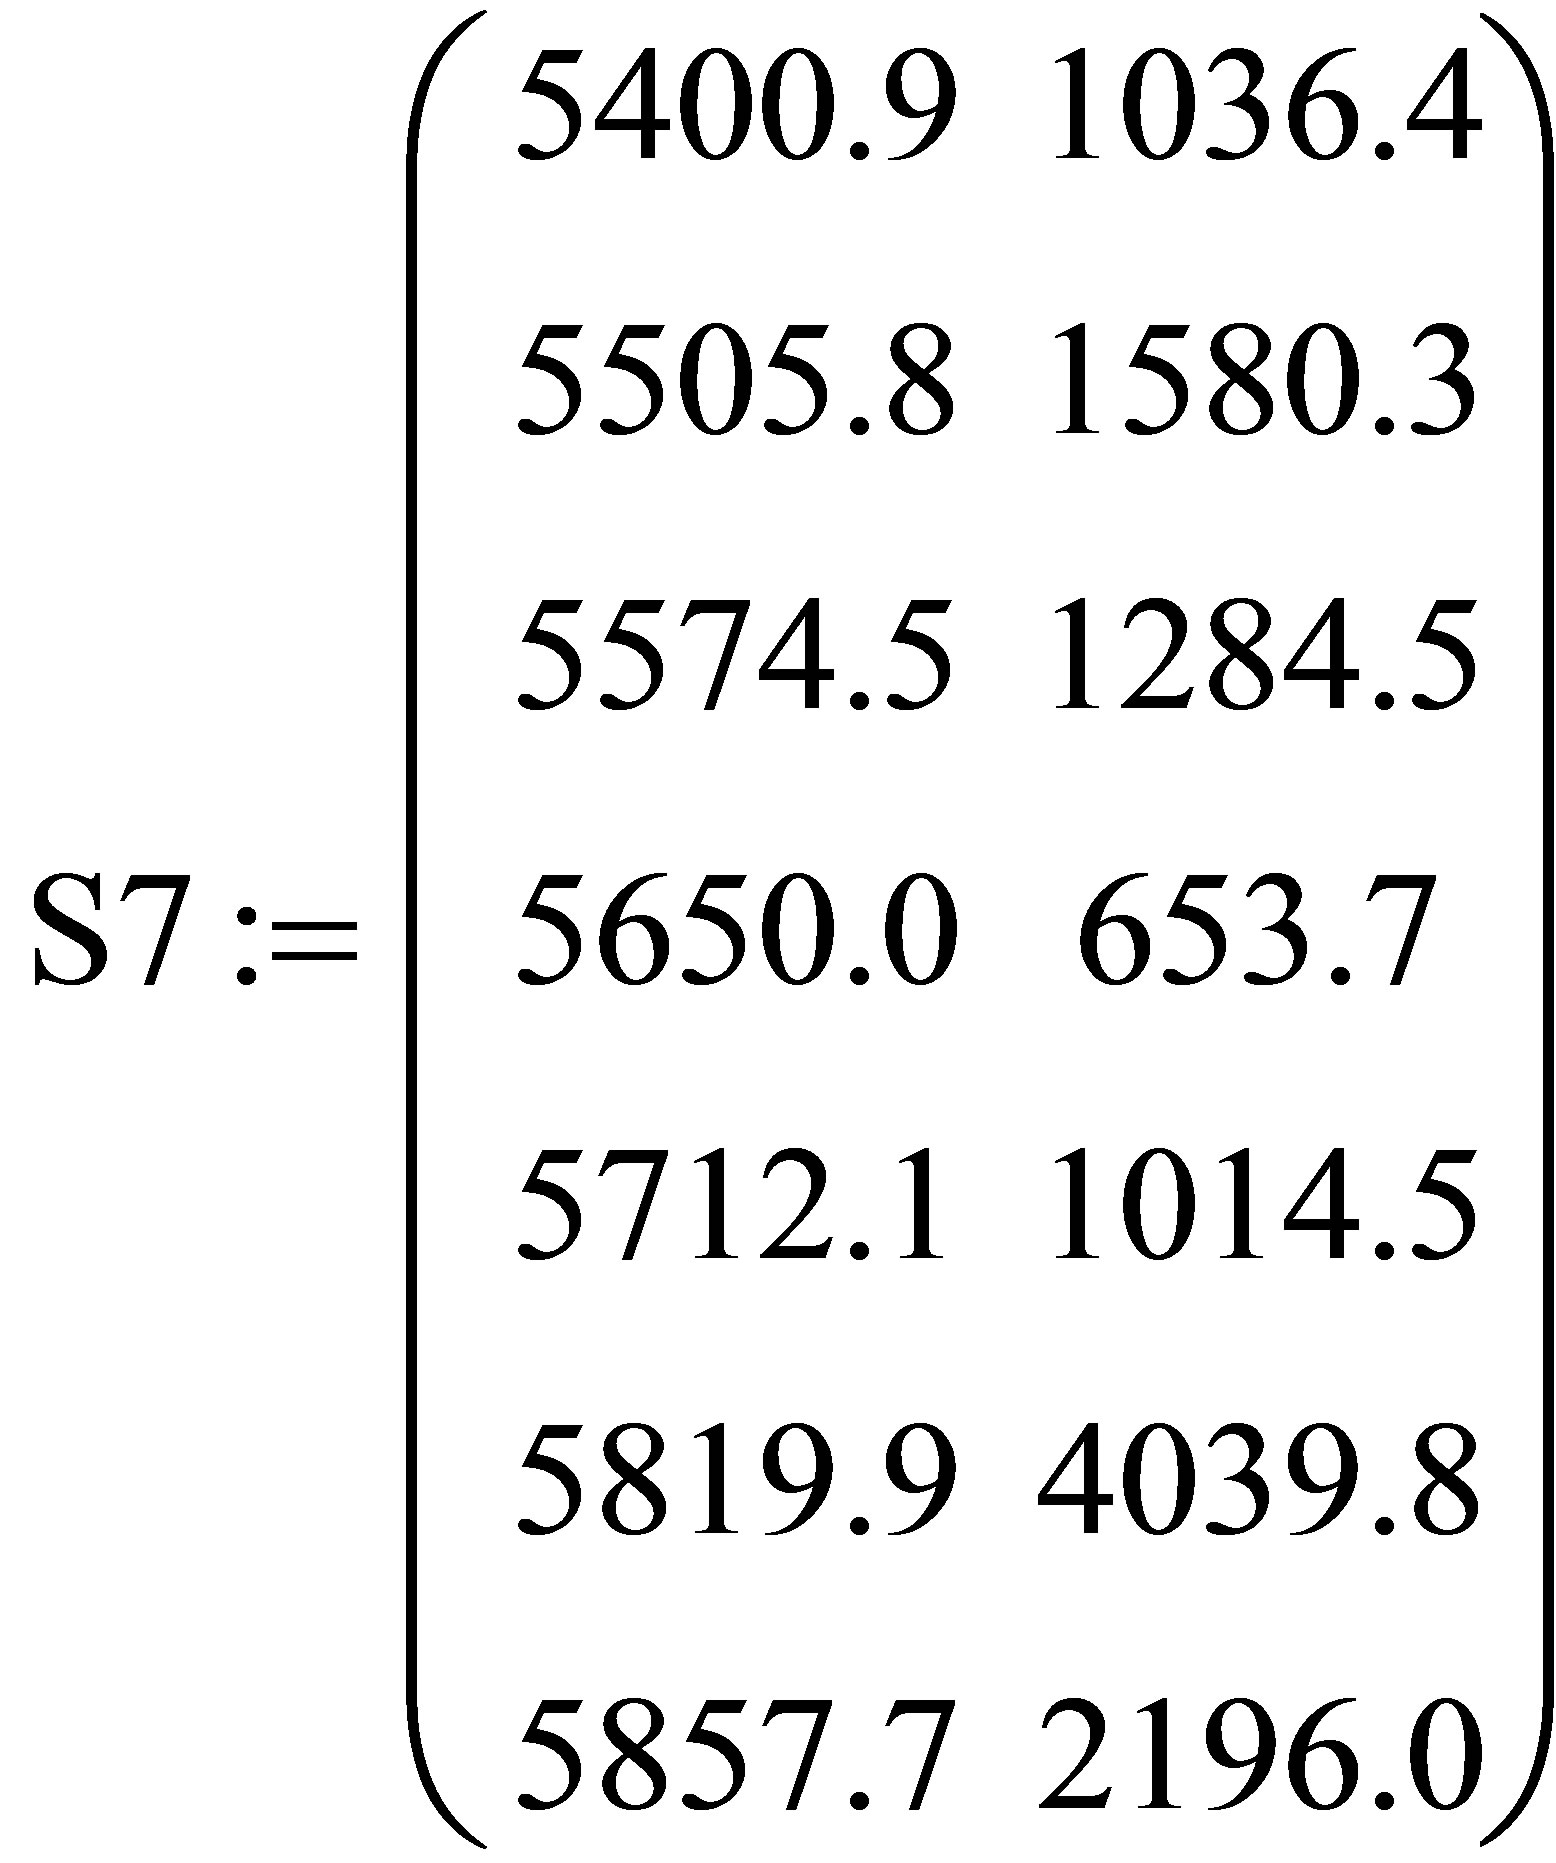
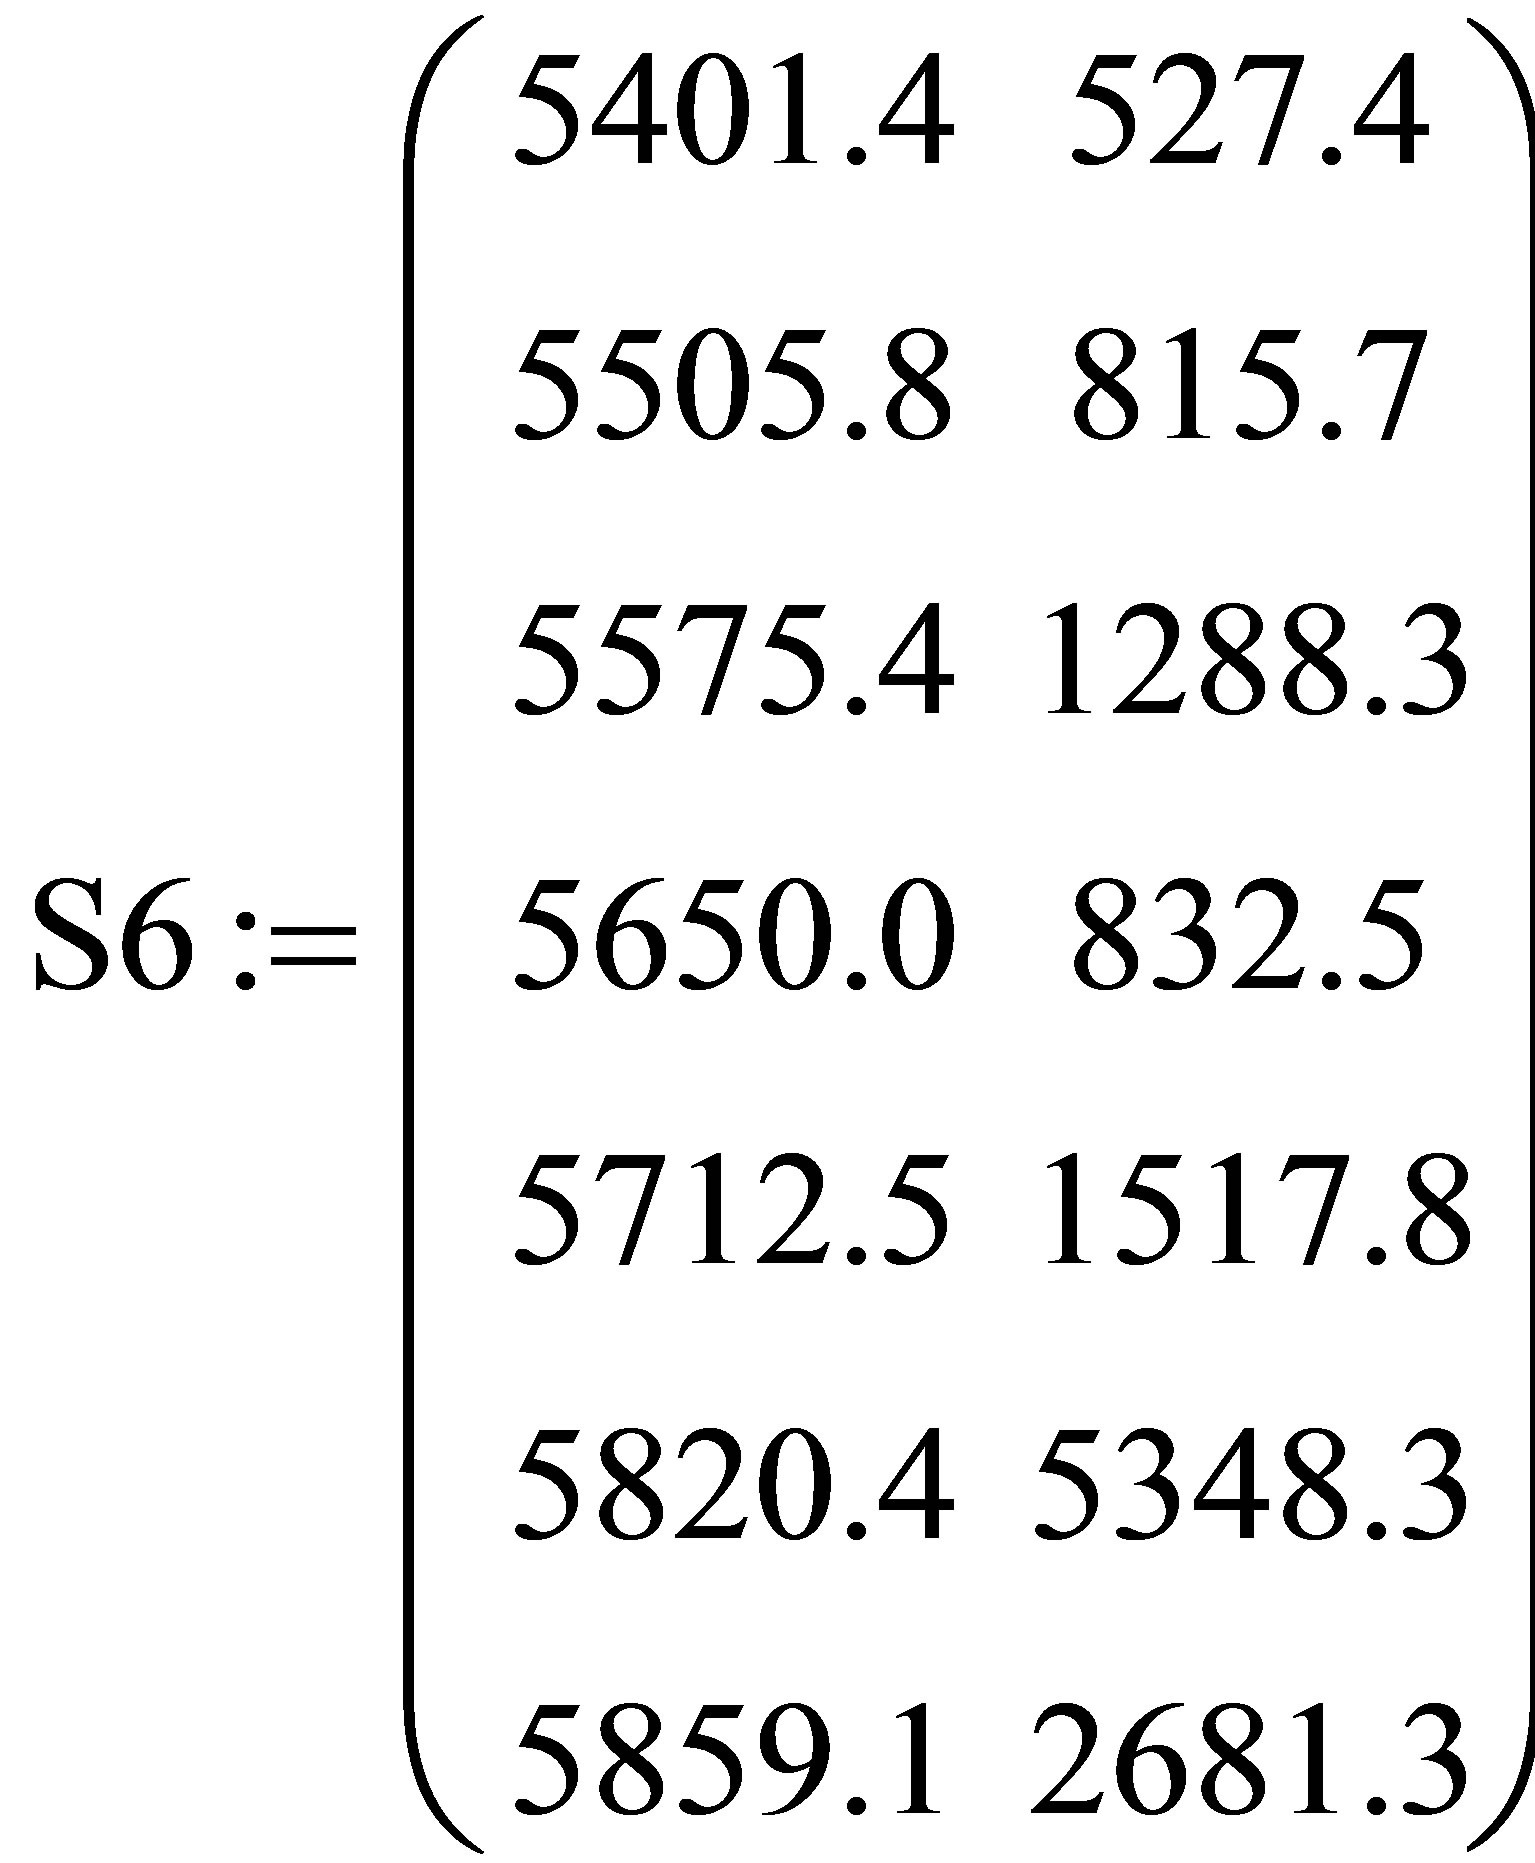
From Figure 1 and matrix S0-S9 shows the maximum peak intensity E5i,0 = 5820 cm−1 is observed in the spectrum of the fiber with silver nanoparticles dried in vivo. The intensity of the peak E5i,0 = 5819.5 cm−1 in said sam- ple is S55,1 = 12539 that 4.65 times the peak Ei,0 = 5820.8 cm−1 range of the fiber without silver nanoparticles S05,1 = 2685.8.
To eliminate uncertainty and identify patterns in the distribution of the parameters of the spectrograms spectrograms were ranked by the intensity of the peaks for the determination of the maximum, minimum and intermediate values of all the components of each of spectrogram peaks in the set of spectrograms fibers separately for fibers without nanoparticles (S0, S1, S2), with the nanoparticles in drying in vivo (S3, S4, S5, S6) and dried in oven (S7, S8, S9).
In the set of spectrograms fibers without nanoparticles S0, S1, S2 identified by rating (1)
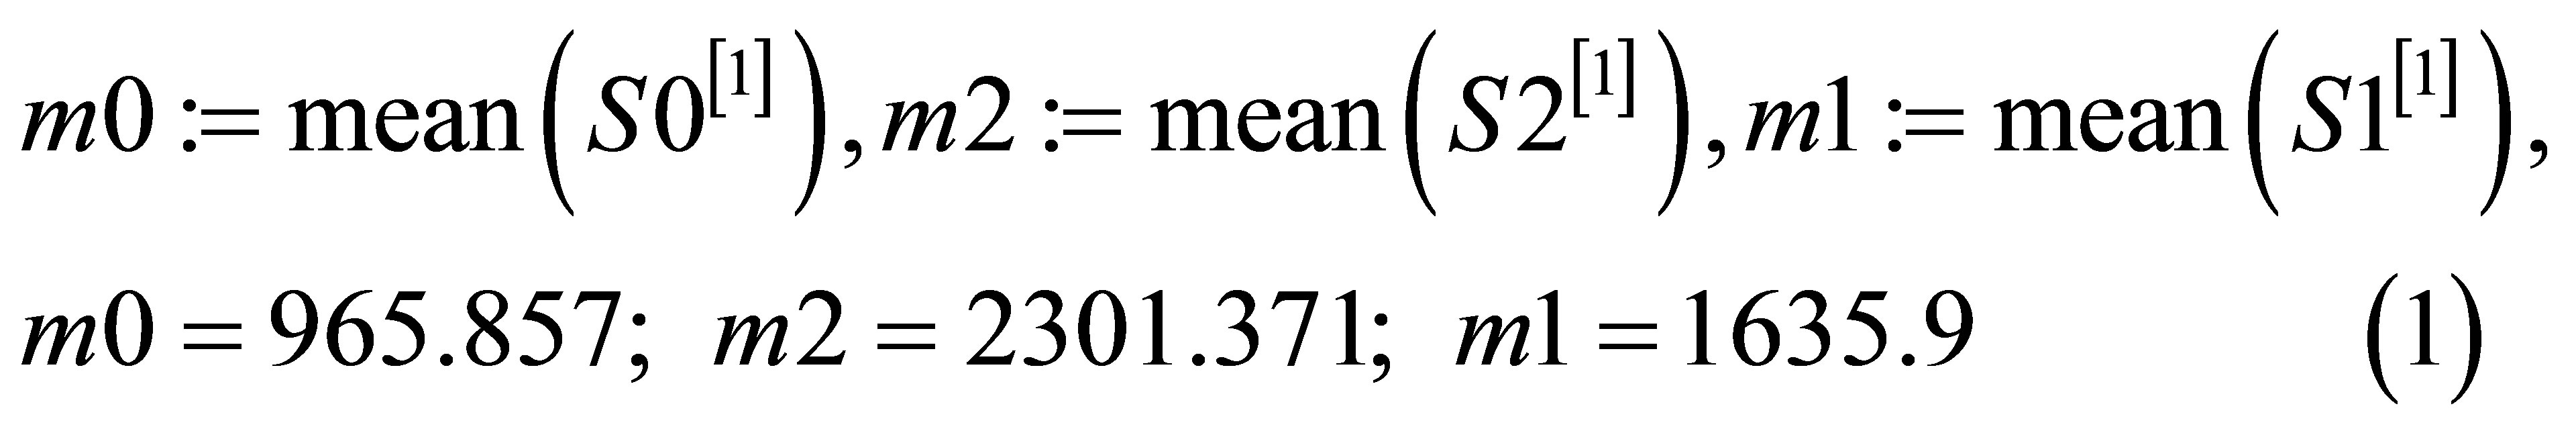
spectrogram fibers without nanoparticles: a minimum intensity peaks S0, with maximum intensity peaks S2 and intermediate intensity peaks S1.
For a variety of spectrograms fiber S3, S4, S5, S6 revealed Assessment (2)
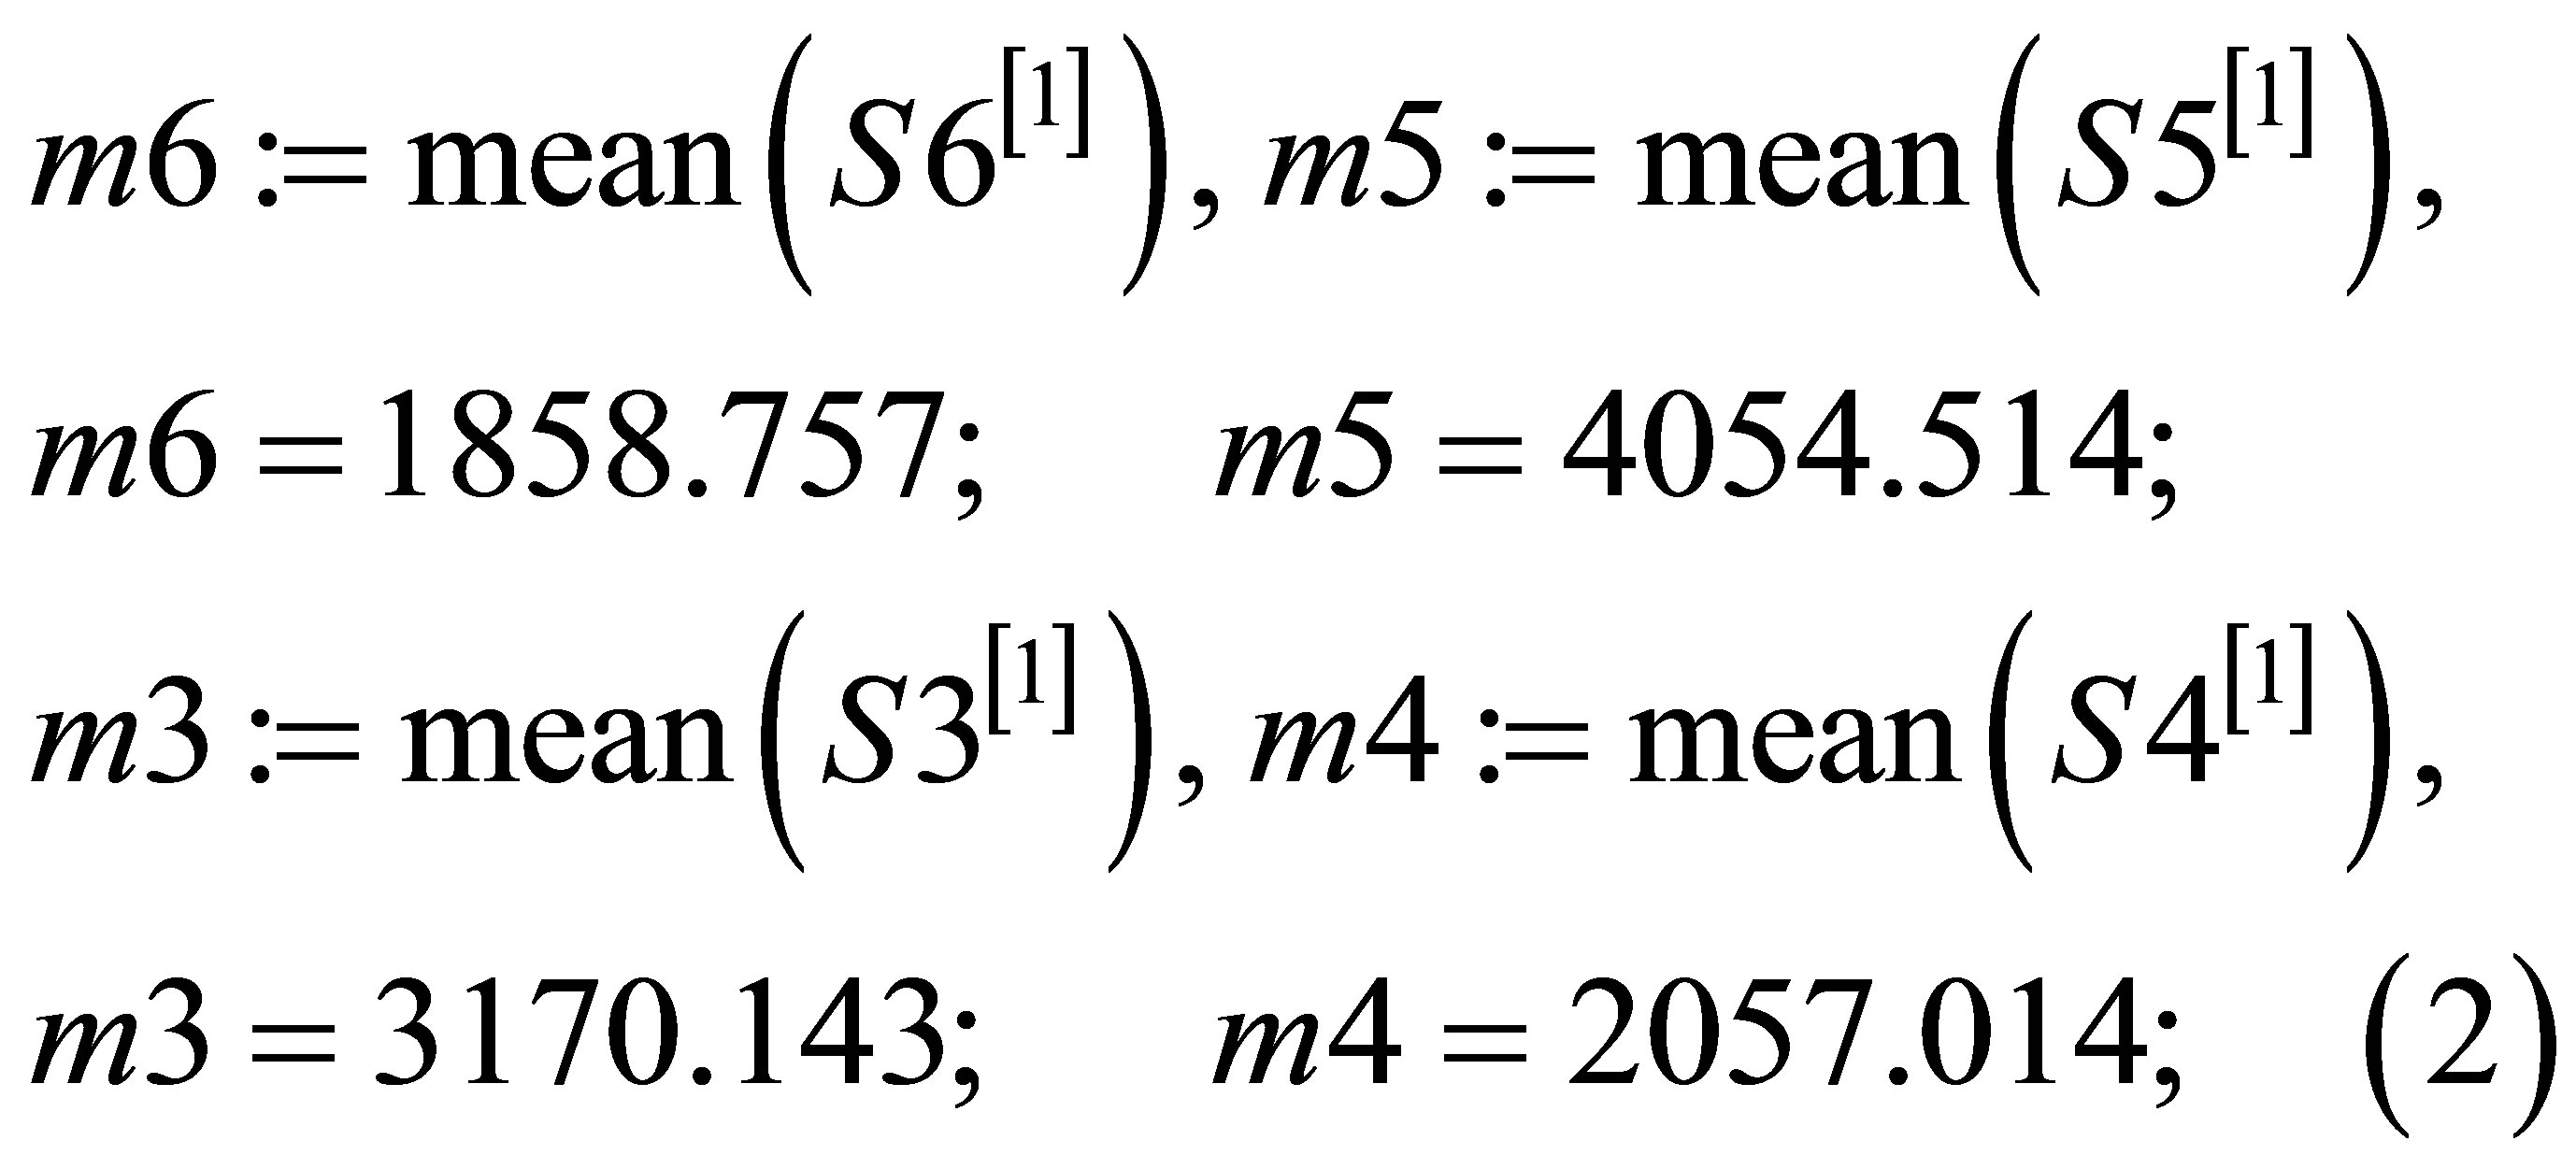
spectrogram fibers nanoparticles: a minimum intensity peaks S6, with maximum intensity peaks S5 and intermediate intensity peaks S4 and S3.
In the spectrograms fibers nanoparticles S7, S8, S9 identified assessment (3)
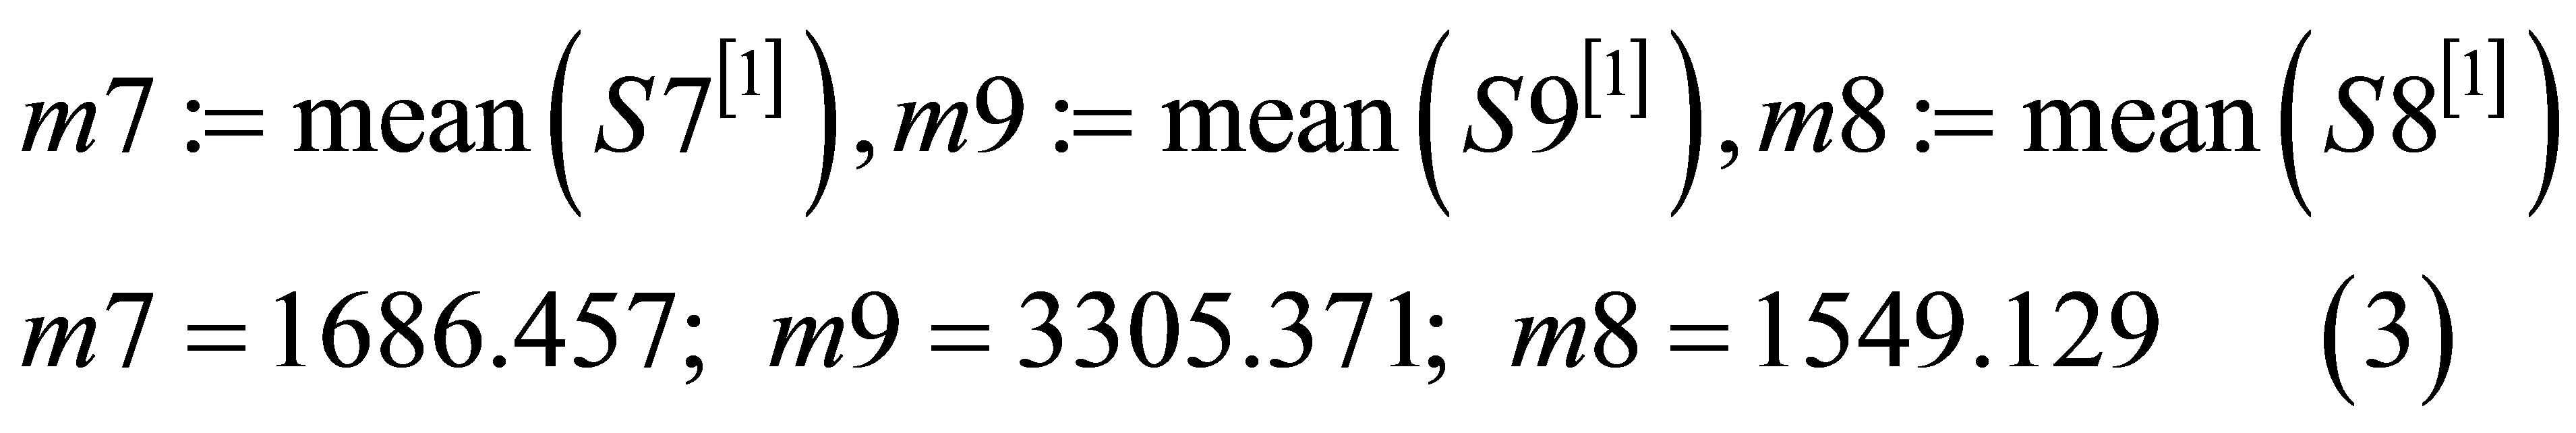
spectrogram fibers with nanoparticles: a minimum intensity peaks S8, with the maximum intensity peaks S9 and with intermediate intensity peaks S7.
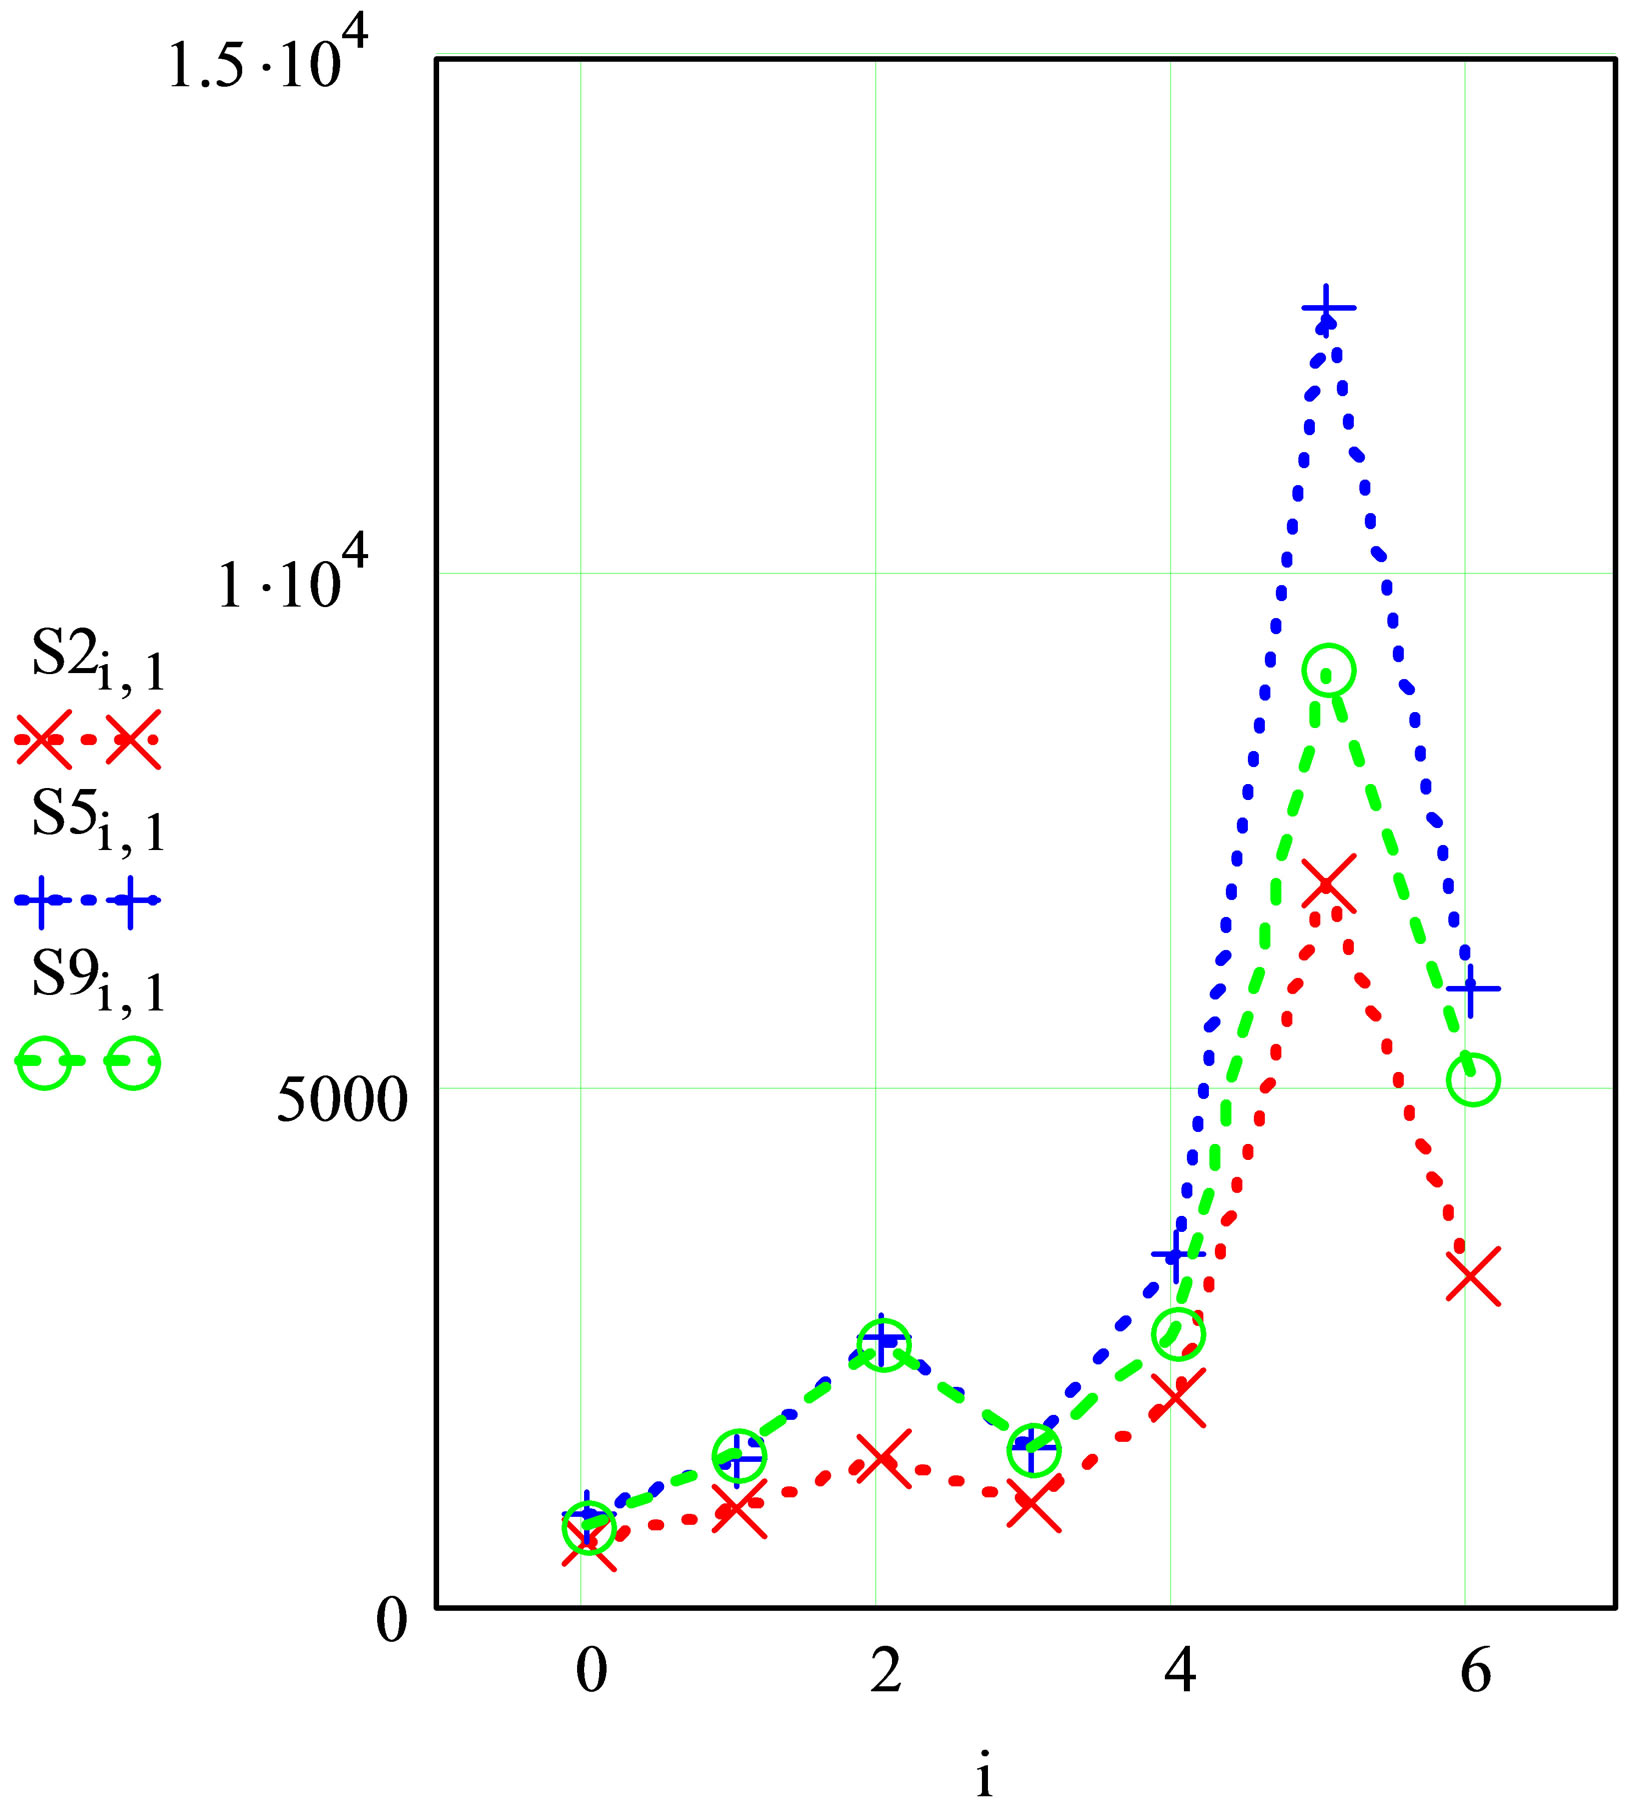
Figure 2 shows the spectrogram PE fibers with and without silver nanoparticles at different drying conditions with the combination of the samples peaks at minimum, maximum, and intermediate values of the peak intensities.
A pooled analysis of the results of modeling estimates (1-3) has shown that there is a significant difference in the intensities of the peaks of the spectrograms of PE fibers coated with silver nanoparticles and uncoated nanoparticles.
 (a)
(a)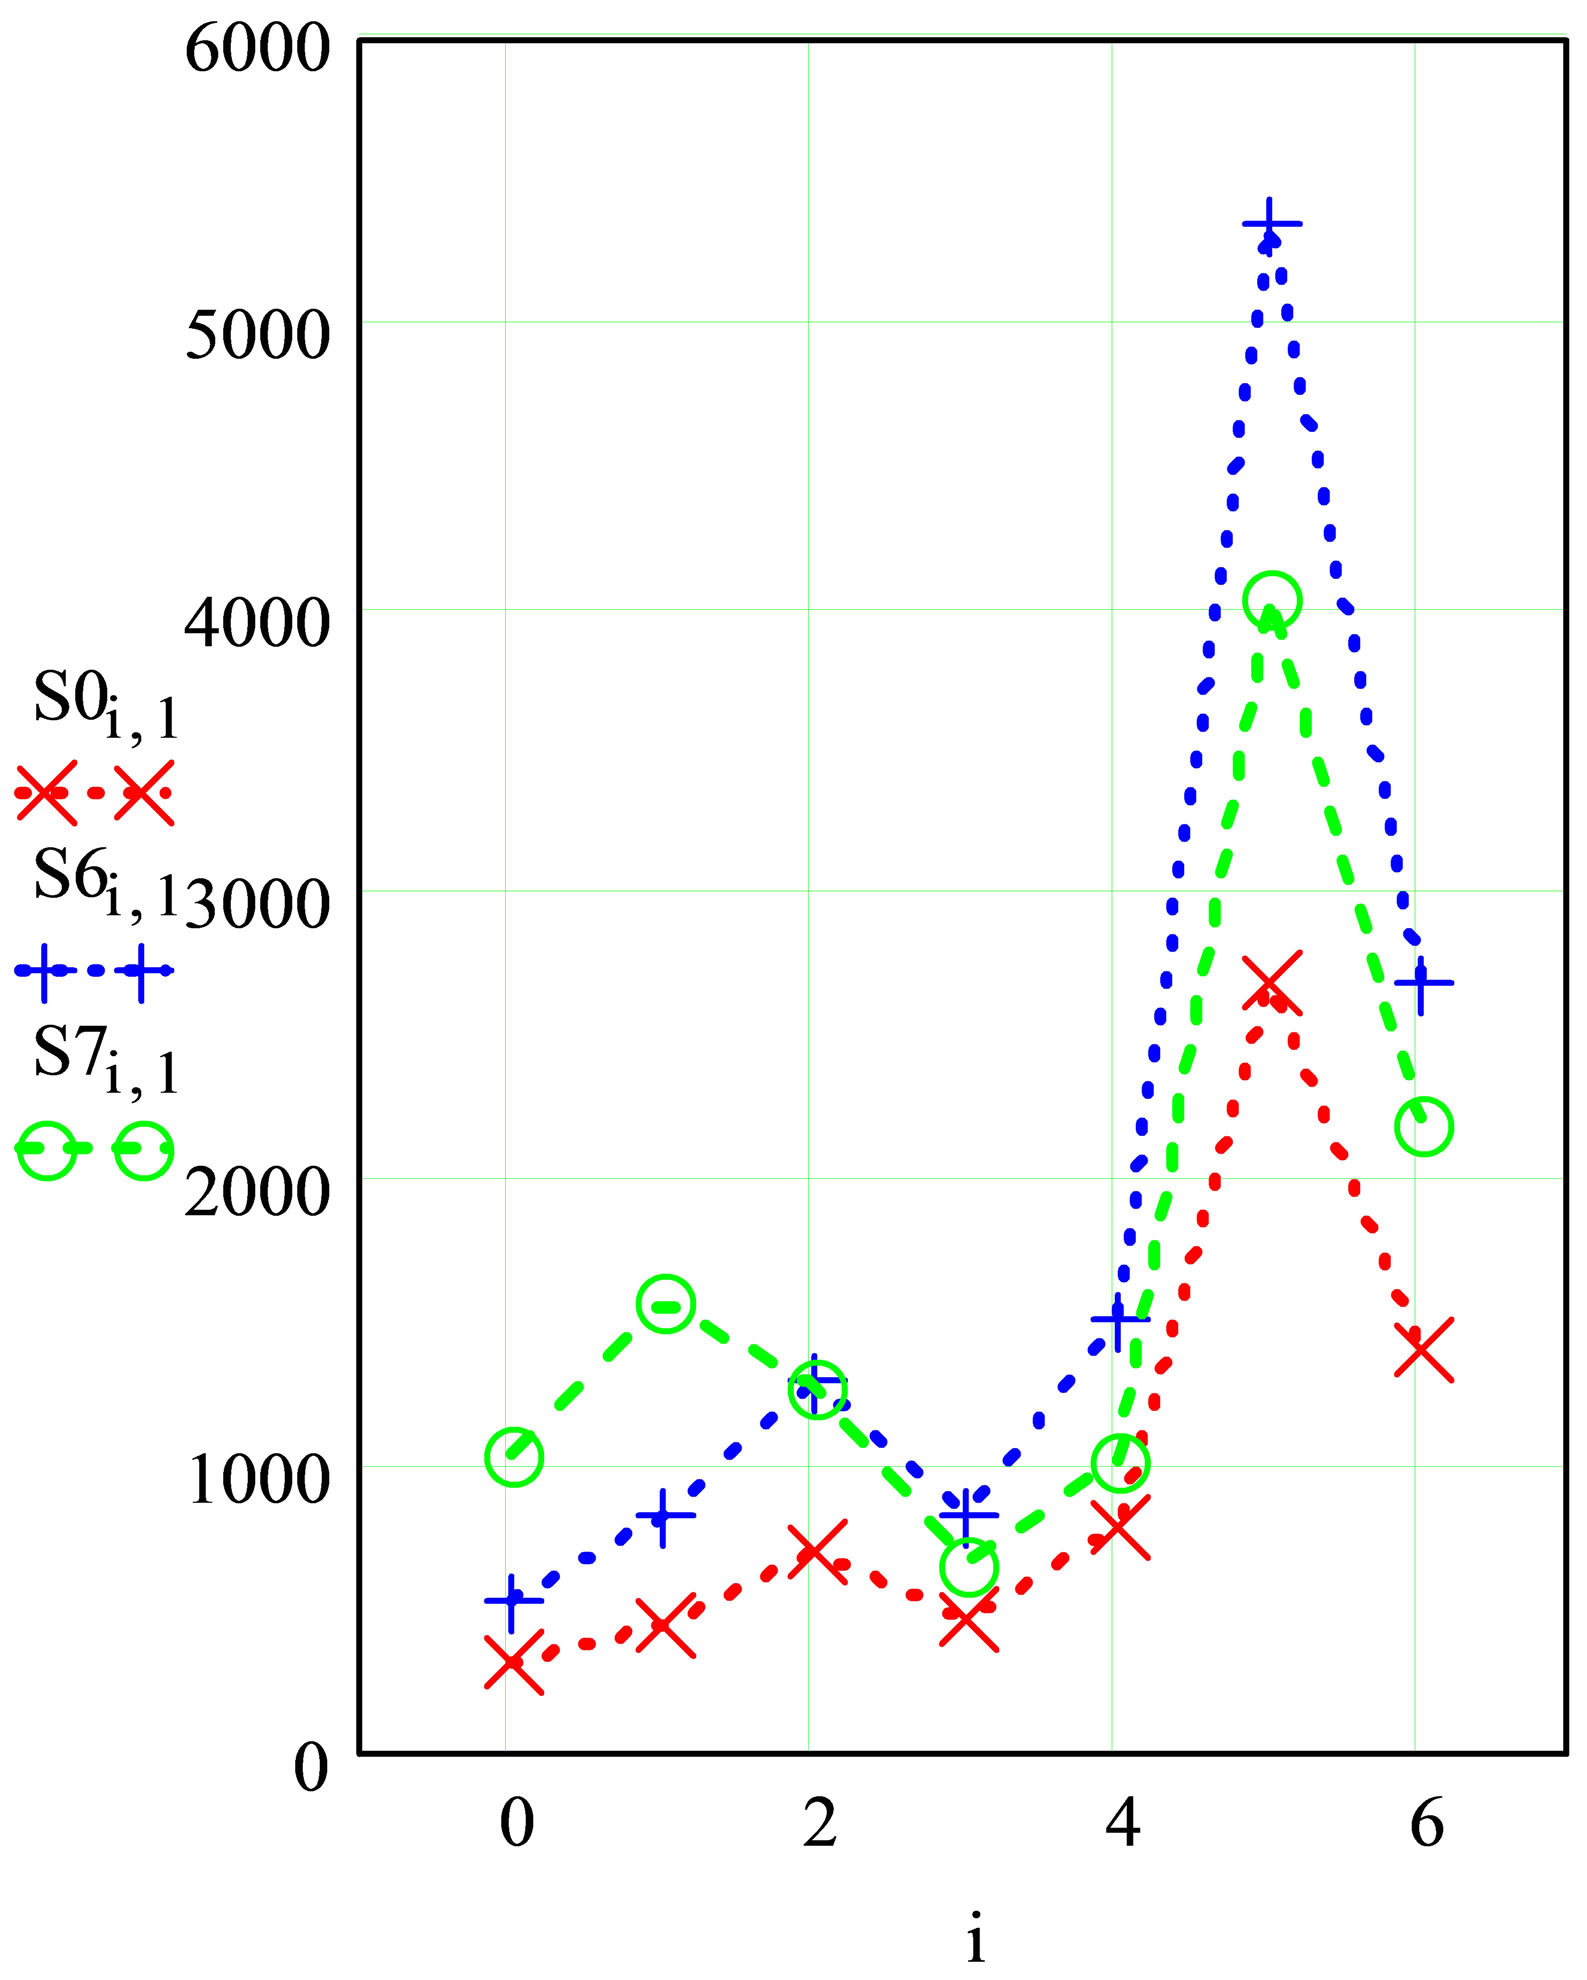 (b)
(b)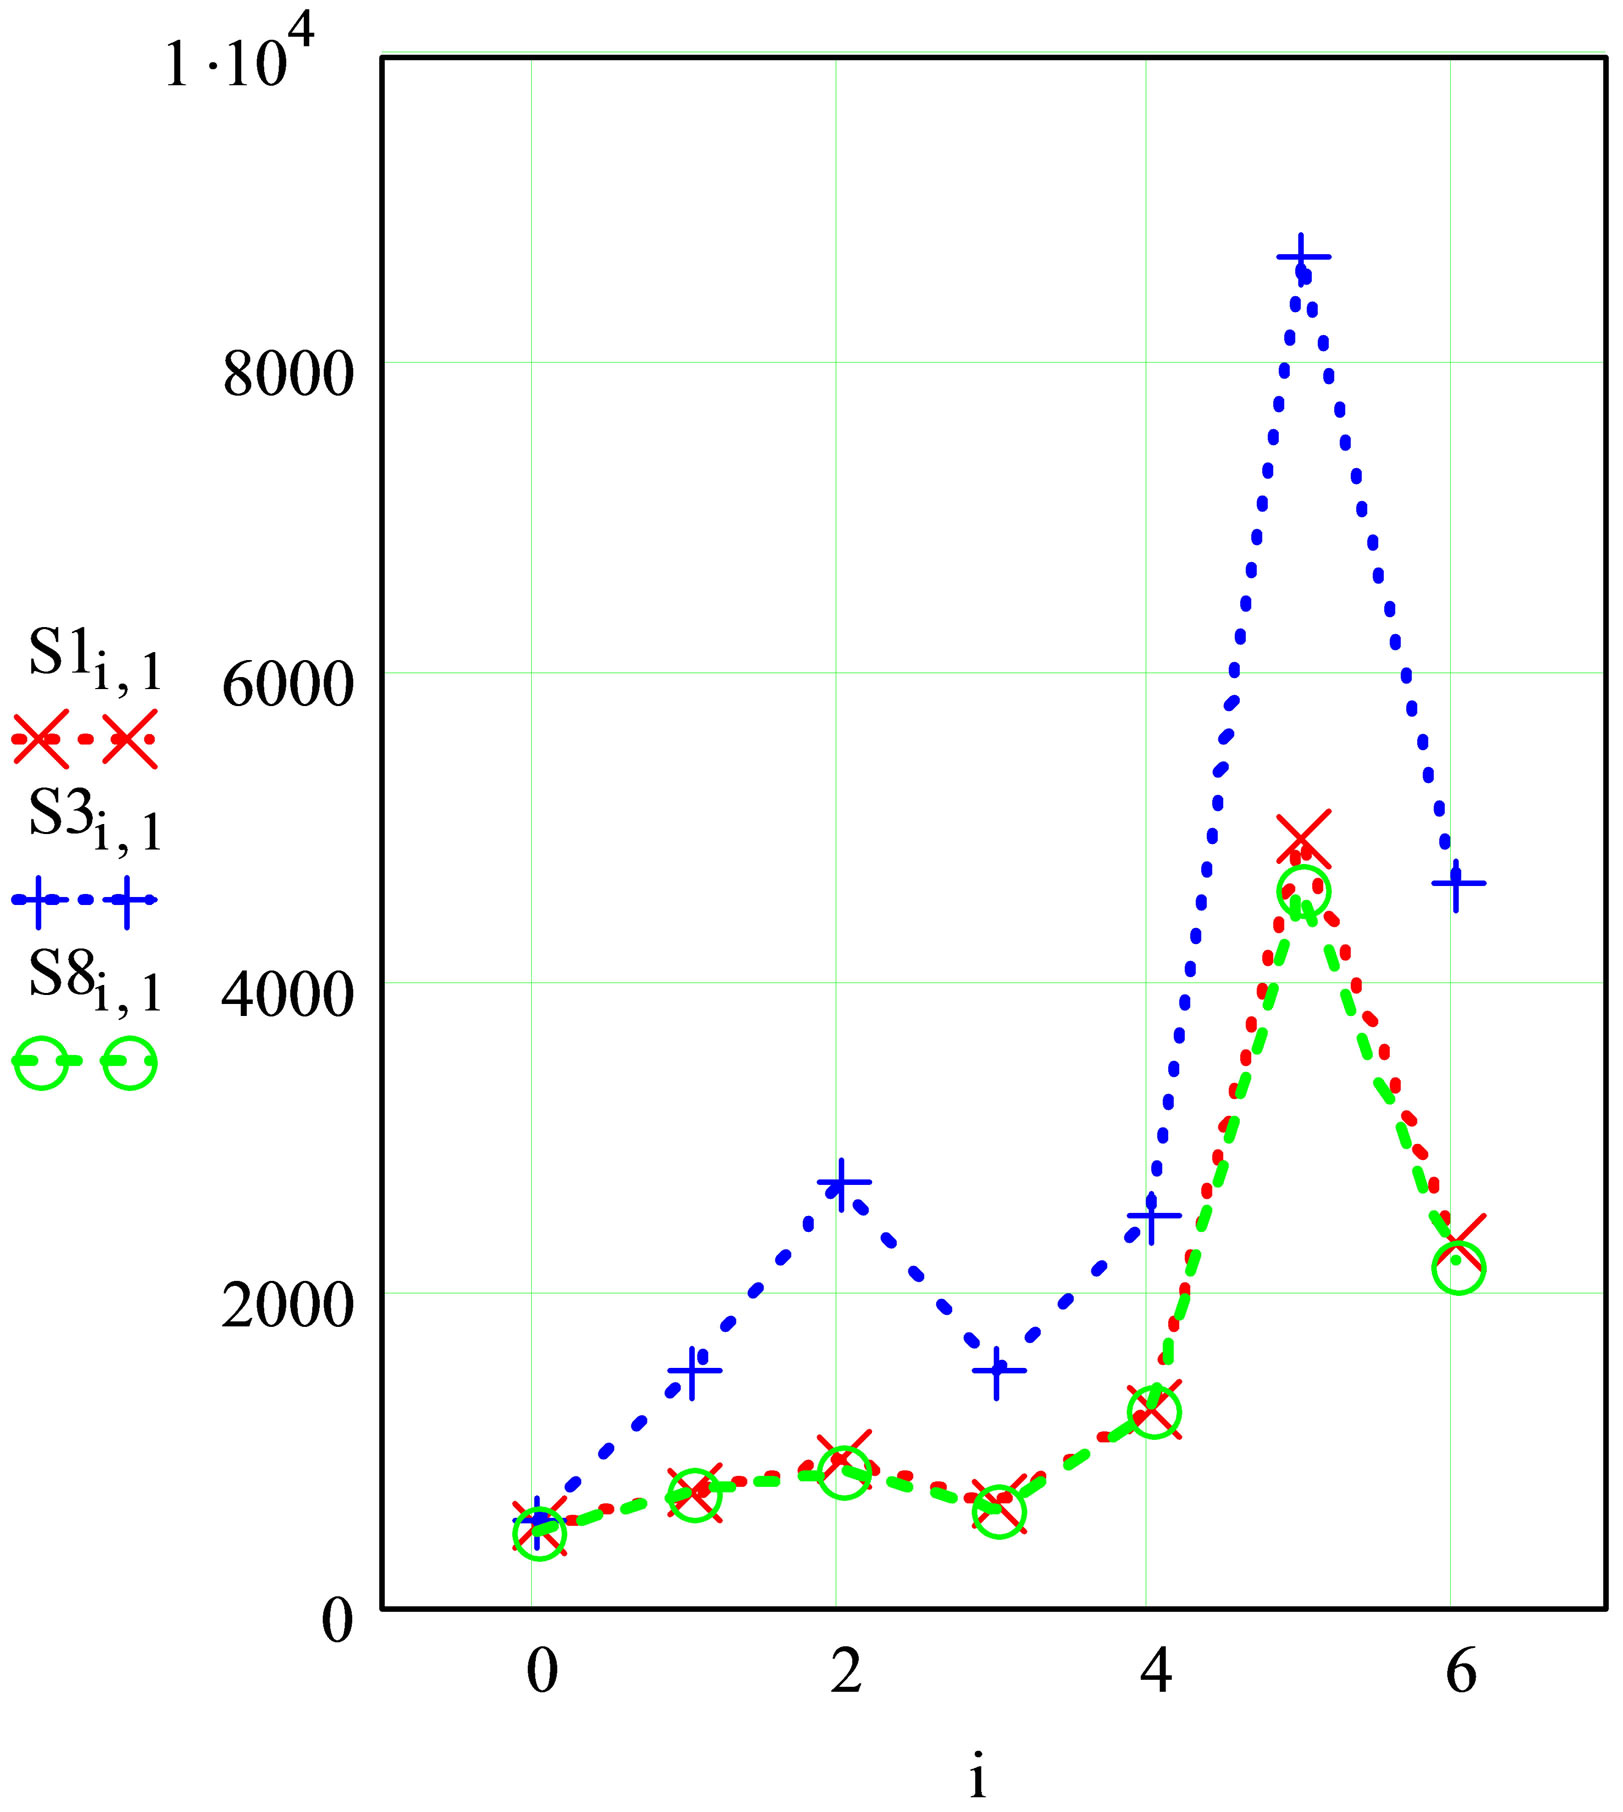 (c)
(c)
Figure 2. Ranged spectrogram largest intensities of all the peaks: (a): Spectrogram PE fibers with the lowest values of the peak intensities: S0 without nanoparticles and silver nanoparticles, S6 and S7; (b): Spectrogram PE fibers with maximum values of peak intensities: S2 without nanoparticles and silver nanoparticles, S5 and S9; (c): Spectrogram PE fibers with intermediate values of the peak intensities: not S1 nanoparticles and silver nanoparticles in vivo dried S3 and oven S8.
Thus the spectrograms with minimum values of all the peaks S0, S6, S7 in Figure 2(a) clearly differs spectrum S0 fibers without silver nanoparticles having minimum peaks compared to spectrograms S6, S7 fibers with silver nanoparticles.
In the spectrograms with the highest values of all peaks S2, S5, S9 Figure 2(b) also clearly differs spectrum S2 fibers without silver nanoparticles having minimum peaks compared to spectrograms S5, S9 fibers with silver nanoparticles.
For spectrograms with intermediate values of all the peaks S1, S3, S8 in Figure 2(c) also clearly differ spectrum S1 fibers without silver nanoparticles having minimum peaks compared to spectrograms S3, S8 fibers with silver nanoparticles.
This is illustrated by mathematical modeling parameters peaks with intensities expectation of spectrogram peaks fibers (4) without silver nanoparticles as S0, S2, S1; nanoparticle and S6, S5, S3 and S7, S9, S8.
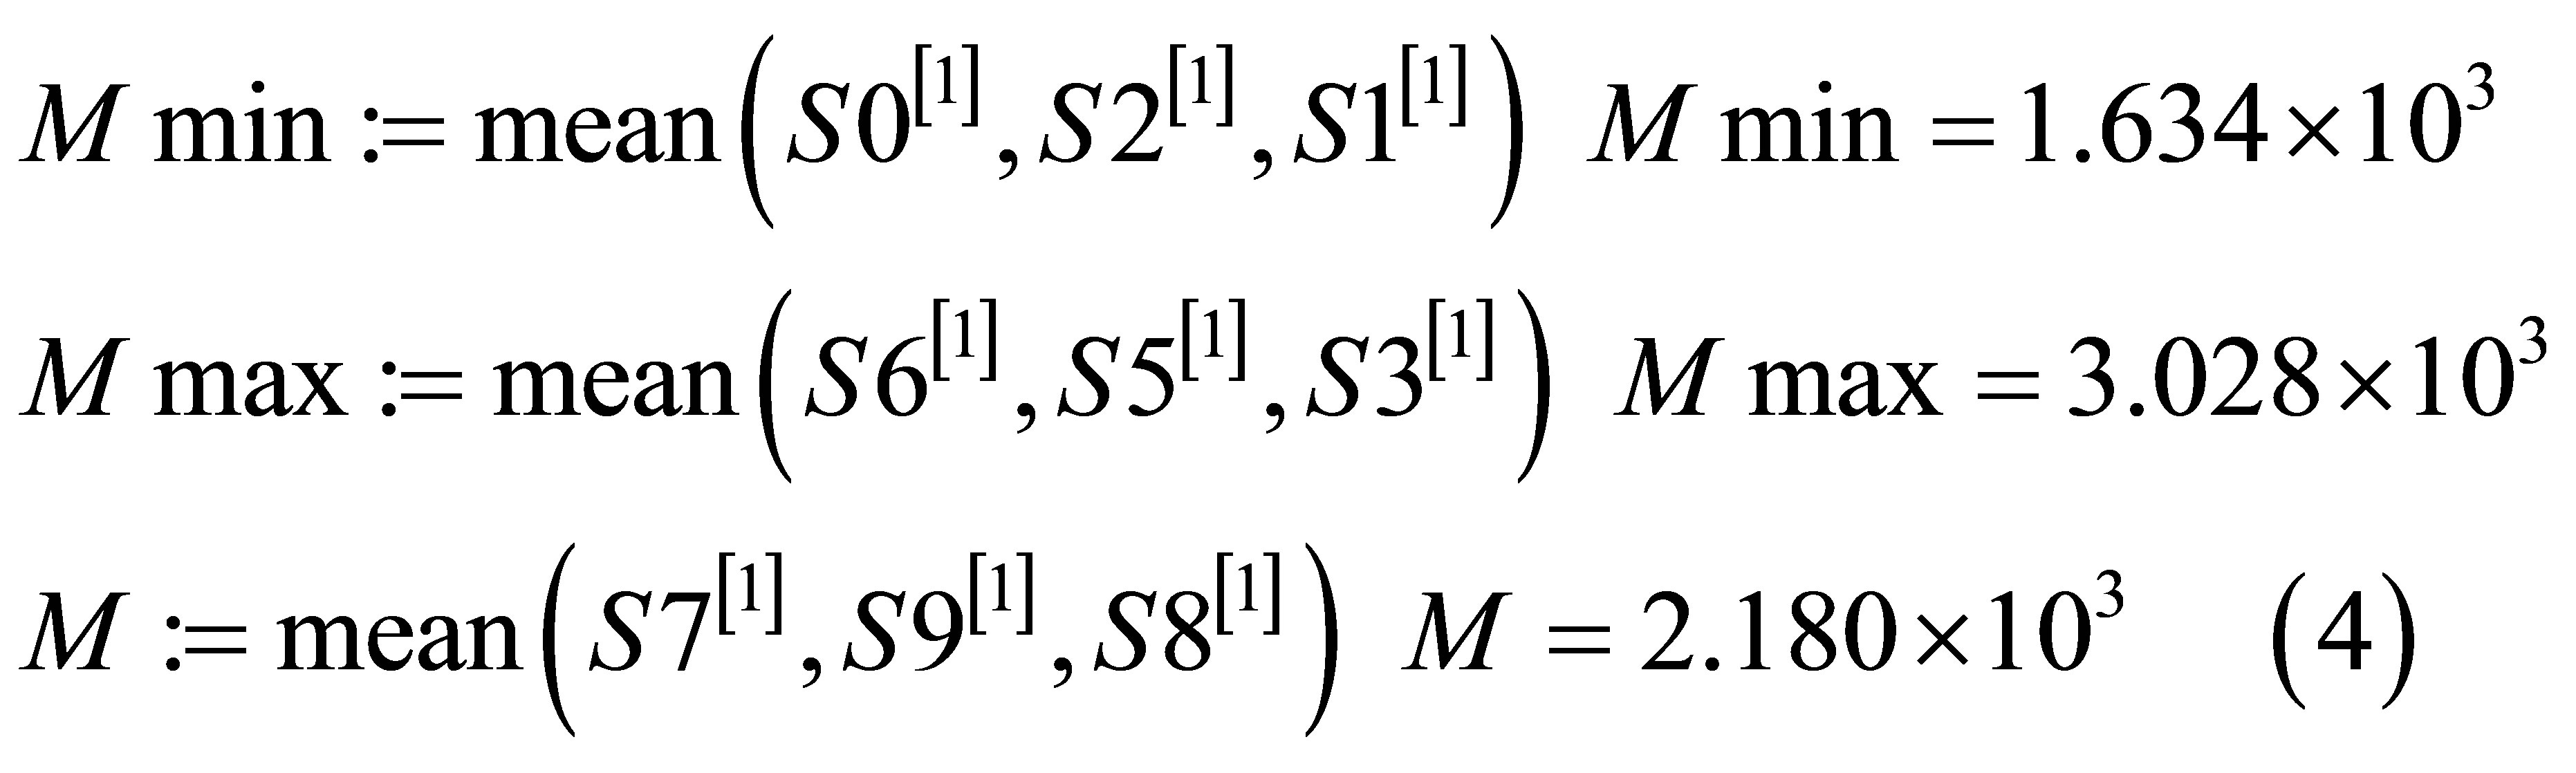
Mathematical modeling parameter M min = 1.634 × 10³ spectrograms without silver nanoparticles has a minimum value that is significantly different from M max = 3.028 × 10³ and points to the identification of differences in the generalized evaluation of spectrograms without nanoparticles and nanoparticle silver (4).
Thus, the method of the experiments and mathematical analysis of the spectrograms can be proposed as methods of control of colloidal silver nanoparticles on the surface of PE fibers.
The work was supported by the Russian Ministry of Education on the equipment Regional Center for Nanotechnology in SEC-Nanoelectronics SWSU and ISSP.
4. Conclusions
1) Due to the large scatter in the values of information parameters in the control of silver nanoparticles on polyester (PE) fibers and considerable uncertainty in the laws of their manifestation is the most suitable method of mathematical processing parameters constituting spectrograms for informational uncertainty (fuzzy logic) when deciding on the presence of nanoparticles.
2) To eliminate uncertainty and identify patterns in the distribution of the parameters of the spectrograms spectrograms were ranked by the intensity of the peaks for the determination of the maximum, minimum and intermediate values of all the components of each of spectrogram peaks in many spectrograms fibers separately for fibers without nanoparticles, the nanoparticles upon drying under natural conditions and on drying cabinet.
3) A pooled analysis of simulation results showed that revealed a significant difference in the intensities of the peaks of the spectrograms of PE fibers coated with silver nanoparticles and uncoated nanoparticles.
4) Identified in the spectrograms with the lowest values of all peaks S0, S6, S7 distinctly different spectrum S0 fibers without silver nanoparticles having a minimum peaks in comparison with the spectrograms S6, S7 fibers with silver nanoparticles.
5) In the spectrograms with the highest values of all peaks S2, S5, S9 also revealed distinctly different spectrum S2 fibers without silver nanoparticles having a minimum peak in comparison with the spectrograms S5, S9 fibers with silver nanoparticles.
6) For spectrograms with intermediate values of all the peaks S1, S3, S8 and clearly differs spectrum S1 fibers without silver nanoparticles having minimum peaks compared to spectrograms S3, S8 fibers with silver nanoparticles.
7) Visually checked difference from expectation spectrogram peak intensities of all fibers without silver nanoparticles as S0, S2, S1; nanoparticle and S6, S5, S3 and S7, S9, S8
REFERENCES
- J. Wang, L. T. Kong, Z. Guo, J. Y. Xu and J. H. Liu, “Synthesis of Novel Decorated One-Dimensional Gold Nanoparticle and Its Application in Ultrasensitive Detection of Insecticide,” Journal of Materials Chemistry, Vol. 20, 2010, pp. 5271-5279. doi:/10.1039/c0jm00040j
- U. K. Sur, “Surface-Enhanced Raman Spectroscopy,” RESONANCE, February 2010, pp. 164-164.
- F. Schedin, E. Lidorikis, A. Lombardo, V. G. Kravets, A. K. Geim, A. N. Grigorenko, K. S. Novoselov and A. C. Ferrari, “Surface Enhanced Raman Spectroscopy of Graphene”. http://www-g.eng.cam.ac.uk/nms/publications/pdf/Schedin_Arxiv_2010
- V. M. Emeljanov and I. V. Vornacheva, “Increasing the Accuracy of Mathematical Modeling Background Component of the Raman Spectra in Monitoring the Application Process Nanogold 10nm,” News SWSU, Physics and Chemistry, No. 2, 2012, pp.121-124.
- V. M. Emeljanov, T. A. Dobrovol’skaja, V. V. Emeljanov, E. J. Orlov, “Mathematical Modeling of the Components of the Raman Spectrograms in Controlling the Deposition Process of Gold Nanoparticles of 10 nm Au,” Abstracts of the IX-th Scientific Conference “NanotechnologyProduction 2013”, Moscow, 10-12 April 2013, pp. 105- 109.
NOTES
*Corresponding author.