Open Journal of Inorganic Non-metallic Materials
Vol.4 No.3(2014), Article
ID:47972,7
pages
DOI:10.4236/ojinm.2014.43004
Prediction of Particles-Air Movement in Silo during Filling Operation
Siti Ilyani Rani1,2*, Jolius Gimbun2,3, Badhrulhisham Abdul Aziz2
1Faculty of Chemical Engineering Technology, TATI University College, Kemaman, Malaysia
2Faculty of Chemical & Natural Resources Engineering, University Malaysia Pahang, Gambang, Malaysia
3Center of Excellence for Advanced Research in Fluid Flow (CARIFF), University Malaysia Pahang, Gambang, Malaysia
Email: *ilyani@tatiuc.edu.my
Copyright © 2014 by authors and Scientific Research Publishing Inc.
This work is licensed under the Creative Commons Attribution International License (CC BY).
http://creativecommons.org/licenses/by/4.0/
![]()


Received 16 May 2014; revised 16 June 2014; accepted 15 July 2014
ABSTRACT
Awareness of dust explosion hazards during silo filling operation is important for safety measures. Thus, information on particles-air flow field is required to assess the likelihood of the hazard. Flow field visualization via experimental investigation associated with difficulties and risks. Hence, in the present study, a modeling formulation using commercial computational fluid dynamics (CFD) code, FLUENT software was employed to predict an insight of flow field distribution, in terms of mean and root mean square (RMS) velocities vectors in cylindrical silo during axial filling. According to the simulation results, predicted flow field has a great influence to the silo height and distance to the silo wall due to gravitational force and movement of fugitive dust and re-circulation of air. The results showed that the predicted data were in very good agreement with experimental data obtained from the literature. The maximum error was around 10%. The study has gone some way towards enhancing our understanding of the particles-air behavior inside industrial equipments during filling operation.
Keywords:Particles-Air, Flow Field, CFD, Filling, Silo

1. Introduction
Knowledge of flow field distribution in particles-air flow is important for an understanding of dust cloud formation inside industrial equipments. In industry, silo is the most common equipment used for storing bulk powder. Indeed, about 80% of bulk powders handled in industries is combustible, which include solid organic materials, metal dusts, chemical dusts, plastic dusts and inorganic non-metallic materials. Moreover, handling bulk powder during filling operation is always accompanied by dust emission to the atmosphere. In unconfined space, generation of fine dust can cause several of problems such as health risks and slippery floor. In partially and confined space, such as in silo, the dust emissions have a tendency to form explosive dust cloud which is the potential hazard for fire and explosion. The consequences of fire and explosion in silo are always severe owing to the large masses and volume. According to an investigation by US Chemical Safety Board (CSB), 13 inorganic combustible dust incidents were identified from 1982 to 2005 that killed 31 workers and injured five. CSB also discovered 281 combustible dust incidents between 1980 and 2005 in various dust type, equipments, facilities and work activities triggered by various ignition sources that caused fatalities of 119 workers, 718 injuries and severe damage to industrial facilities [1] .
Cyclone, pneumatic transport pipe, mixer, bucket elevator or mill is commonly used for filling process in silo. This process involved free falling bulk powder that can generate a lot of dust emissions from the main stream and become suspended in air. The chaotic movement of fine dust in air produced flow field distribution that may influence the dust concentration distribution. Numerous studies have attempted to explain the phenomena during powder handlings [2] -[4] . However, so far, there has been little discussion about gas-solid flow field during silo filling which can exemplify real dust cloud formation inside process equipments. Efforts made by Hauert and Vogl [5] provide extremely important contribution to this area. Experimental investigation is not practically feasible for this study since it contains many obvious shortcomings such as high cost, time consuming and risky. Alternatively, computational fluid dynamics (CFD) is chosen in this work because it is relatively low cost, require shorter time period, provides the ability to simulate real condition with explicit phenomena, capable to simulate ideal condition at any physical condition, and competent to generate inclusive information of the process. An earlier attempt to formulate suitable modeling strategy using Standard k-ε (SKE), Renormalization Group k-ε (RNG) and Realizable k-ε (RKE) has been reported [6] . In that study, the modeling strategy using RNG has shown the best prediction for gas-solid flow in silo. In [7] , this modeling strategy has been successful in predicting the profiles of mean and RMS velocity for 80 cm from the silo wall at five axial locations. This paper is an extension of the author’s previous work [7] , where the objective was to visualize the pattern of particles-air movement from top to bottom of the silo during this operation.
2. Modeling Approach
2.1. Case Problem Description
The particles-air flows inside a 5 m height and 1.6 m diameter silo were analyzed and solved iteratively in three-dimensional (3D) environment consists of high quality 100% hexahedral grid. A model of the cylindrical silo was built and meshed in Gambit version 2.4. The grid created must be fined enough to provide a tolerable resolution of the geometrical features, as well as important flow features. Total number of cells of the grid used for simulation is 362,557 with the total number of nodes equal 379,008. Minimum and maximum volume of the cell is about 2.543435 × 10⁻⁷ (m3) and 1.018982 × 10⁻⁴ (m3), respectively. Meshed cylindrical silo is shown on Figure 1.
The particles with mean diameter of 15 µm are injected through the dust inlet. The initial condition for this injection is shown in Table1 Total number of particles tracked depends on number of tries of the discrete walk random model. It was assumed that five tries gives a statistically independent solution, which gives 8000 particles tracked during the simulations. Ten various diameters from the range described by Rosin-Rammler logarithm distribution are released from each cell of the injection surface.
2.2. The Flow of the Continuous Phase
Turbulence model plays an important role in predicting accurately both the air and particle flows. Filling process in silo induced an initial turbulence which caused the fluctuation in velocity fields. In present study, the continuous phase was modeled using RNG  model which is based on Reynolds Average Navier-Stokes (RANS) equations. The transport equation for turbulence kinetic energy
  and dissipation rate
  can be expressed by:
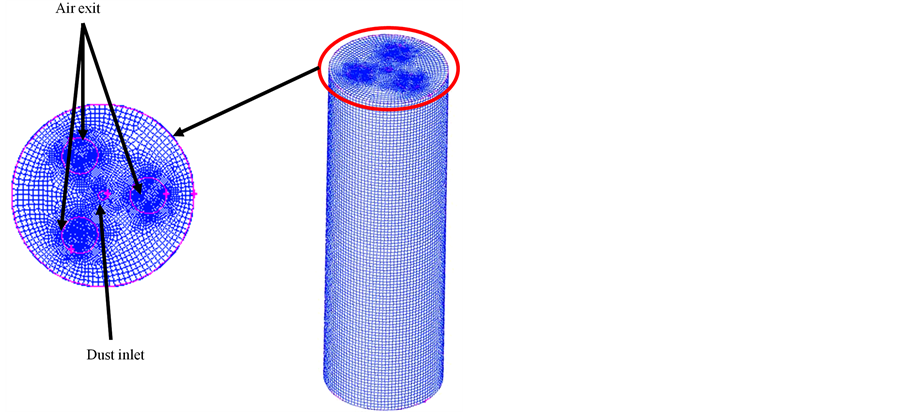
Figure 1. Final mesh of the cylindrical silo.

Table 1. The inlet conditions of raw meal injection.
 (1)
(1)
 (2)
(2)
where  is the density,
  is the velocity component,
  is the viscosity,
  is the turbulent viscosity,
  is the production term.
  and
and  are the turbulent Prandtl numbers for
  and
and , respectively.
  is user-defined source term.
Equations (3) to (5) describe the eddy viscosity , production term
  and source term
 , respectively:
 (3)
(3)
 (4)
(4)
 (5)
(5)
Equations (6) and (7) describe the inverse effective Prandtl number  and analytical value used in RNG, respectively as follows:
 (6)
(6)
 (7)
(7)
where  is effective Prandtl number and
 . In the high Reynolds number limit
 ,
, .
. ,
,  The model constants are,
 ![]() ,
,  ,
,  and
and  [8] .
[8] .
2.3. Lagrangian Disperse Phase Model
The discrete phase model (DPM) in FLUENT software solved particle equation of motion using a Lagrangian formulation. A discrete particle phase trajectory is determined by combination of the force balance on the particle. This force balance associates the particle inertia with the other appropriate forces acting on the particle. The integration of appropriate forces such as the drag and gravitational forces into the equation of motion can be written as:
 (8)
(8)
 (9)
(9)
 (10)
(10)
 (11)
(11)
where  is the drag force,
  is the gas velocity,
 ![]() is the particle velocity,
is the particle velocity,  is the gravity constant = 9.81 ms−2,
 ![]() is the particle density,
is the particle density,  is the gas density,
  is the viscosity,
 ![]() is the particle diameter,
is the particle diameter,  is the Reynolds number and
  is the drag coefficient. This present study assumed that the particles are spherical and the constant
 ,
,  and
and  [9] .
[9] .
2.4. Phase Coupling
Coupling is an important concept in characterizing gas-solid turbulence flow in silo since it can take place through momentum transfer (the result of the drag force on phases), energy transfer (heat transfer between phases) and mass transfer (the result of the change in mass of a particle). In present study, two-way coupling is utilized since the disperse phase is impacted by the continuous phase flow pattern and vice-versa. This is consistent with the work of [10] [11] .
3. Results and Discussion
3.1. Model Validation
There is a good agreement between the simulation and experimental data as shown in Figure 2. The results showed highest downward velocity (negative value) and upward velocity (positive value) for mean and RMS velocity, respectively at the center region. This is due to the chaotic movement of particles-air in the core stream during filling operation.
3.2. Prediction of Mean Velocity
Figure 3 portrays front view of mean velocity vectors from top (Z = 4750 mm) to bottom (Z = 750 mm) of the silo. In this figure, there is a clear trend of increasing upward velocity closer to the silo wall towards the bottom of the silo (at Z = 1750 mm and Z = 750 mm). Conversion of particles dynamics from potential energy to kinetic energy under gravity environment during silo filling describes this phenomenon. Consistent with findings by
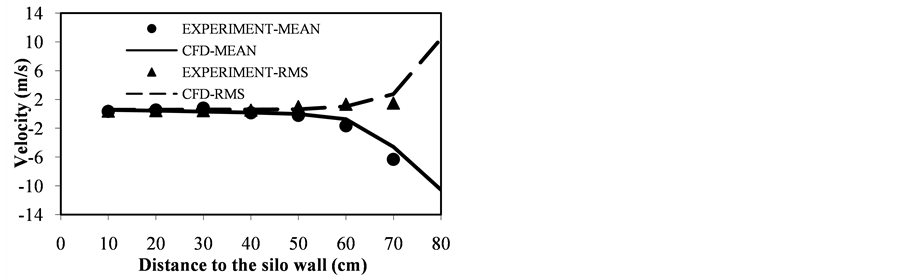
Figure 2. Comparison of predicted and experiment results of mean and RMS velocities in silo radius.
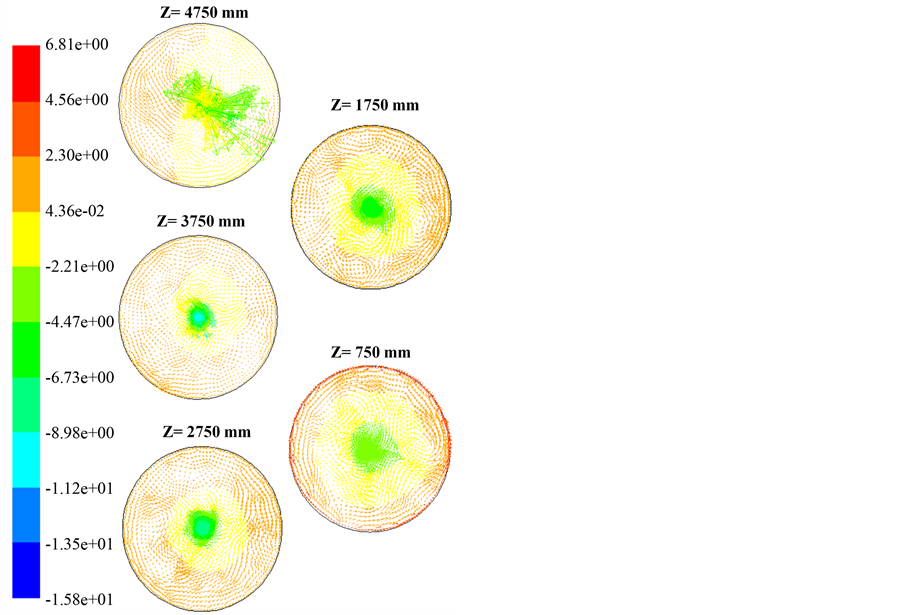
Figure 3. Front view of mean velocity vectors at five different positions in the silo.
Wypych [2] , we found that the increment of mean velocity towards the silo wall is owing to the released of entrained air from the core stream after reaching the impact zone at the bottom of the silo. The upward movement of air to air exit disturbed dust layer and induced the dust to loft in the air currents.
3.3. Prediction of RMS Velocity
The RMS velocity describes the turbulence flow. The vectors of RMS velocity from top to bottom of the silo are presented in Figure 4. At the center region, it is apparent that RMS velocity (turbulence flow) is decreases with decreasing silo height and increases closer to the silo wall. The highest turbulence value (red color bar) was found at the center of Z = 4750 mm, which is close to the filling inlet. Far away from the center, only low turbulence value with upward movement is found. This is due to movement of particles in the core stream, movement
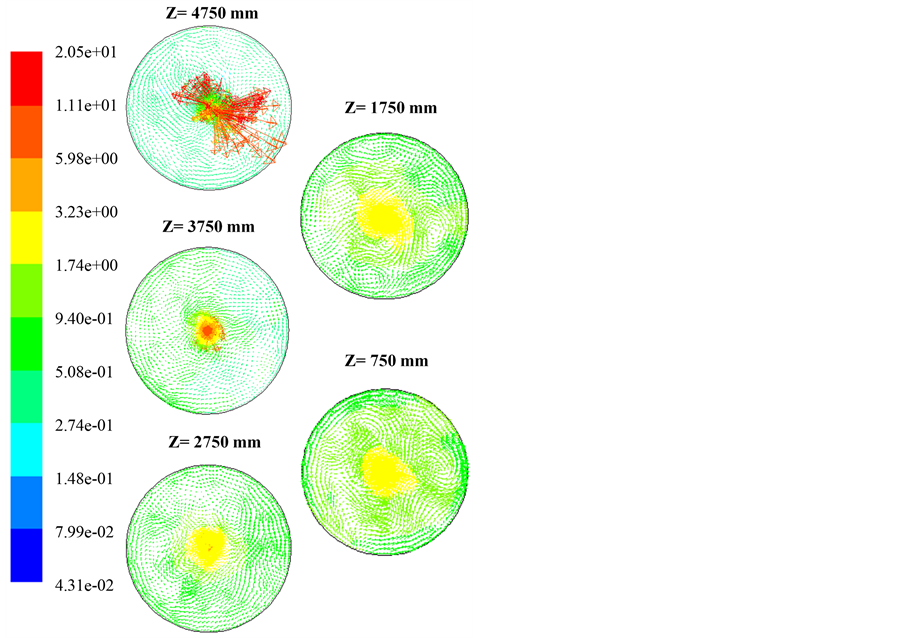
Figure 4. Front view of RMS velocity vectors at five different positions in the silo.
of induced air from surrounding into the stream and movement of fine dust and ejected air from the stream to the surrounding during filling operation. The RMS velocity value at the center region of Z = 3750 mm is progressively reduced.
Closer to the silo wall, the present findings also revealed that the turbulence region increases at the bottom of the silo (e.g. Z = 1750 mm and Z = 750 mm) due to the continuous ejection of entrainment air from the falling stream to the surrounding after high velocity impact at the bottom of the silo. Movements of ejected air at high velocity stimulate random movement of fine particles, which caused the turbulence flow in the silo. This would suggest that the concentration of dust in air is in the explosible range and explosion might be possible during loading.
4. Conclusion
The purpose of this study was to provide a deeper insight into the particles-gas behavior during filling process in silo. These findings suggest that in general, filling operation in silo is always associated with dust cloud generation since free falling bulk powder has been distinguished to produce disperse fine dust and air movement that influenced the flow field distribution. Mean velocity increases with increasing distance from the inlet (at the bottom of the silo and closer to the wall). At the main flow (center of the silo), the turbulence decreases with decreasing silo height. The RMS velocity increases with decreasing silo height and closer to the silo wall. These findings enhance our understanding on gas-solid turbulence flow, which is difficult to assess in the real practice. Further research might investigate the influence of flow field on dust concentration distribution. Indeed, the knowledge provides better understanding of the particles-air behavior inside industrial equipments.
Acknowledgements
Siti Ilyani Rani thanks TATI University College for the scholarship and University Malaysia Pahang for the financial support (GRS 120338). The author also wishes to express her sincere thanks to Dr. Ahmed H. A. Dabwan for help with proofreading and for various valuable suggestions to improvement the text.
References
- CSB (2006) Investigation Report: Combustible Dust Hazard Study. Report No. 2006-H-1.
- Wypych, P., Cook, D. and Cooper, P. (2005) Controlling Dust Emissions and Explosion Hazards in Powder Handling Plants. Chemical Engineering and Processing: Process Intensification, 44, 323-326. http://dx.doi.org/10.1016/j.cep.2004.02.026
- Wardjiman, C., Lee, A., Sheehan, M., and Rhodes, M. (2009) Shape of a Particle Curtain Falling in Stagnant Air. Powder Technology, 192, 384-388. http://dx.doi.org/10.1016/j.powtec.2009.01.009
- Ansart, R., De Ryck, A., Dodds, J. A., Roudet, M., Fabre, D. and Charru, F. (2009) Dust Emission by Powder Handling: Comparison between Numerical Analysis and Experimental Results. Powder Technology, 190, 274-281. http://dx.doi.org/10.1016/j.powtec.2008.04.053
- Hauert, F. and Vogl, A. (1995) Measurement of Dust Cloud Characteristics in Industrial Plants, Final Technical Report: Protecting People, Equipment, Buildings and Environment Against Dust Explosion-CREDIT Project. PL 910695.
- Rani, S.I., Gimbun, J. and Aziz, B.A. (2013) Modeling of Gas-Solid Turbulence Flow in Silo. Proceedings of the 6th International Conference on Process Systems Engineering (PSE ASIA 2013), Kuala Lumpur, 25-27 June 2013, 784- 789.
- Rani, S.I., Gimbun, J. and Aziz, B.A. (2014) CFD Simulation of Dust Cloud Formation in Silo. Australian Journal of Basic and Applied Sciences, 8, 521-527.
- Yakhot, V. and Orszag, S. (1986) Renormalization Group Analysis of Turbulence. I. Basic Theory. Journal of Scientific Computing, 1, 3-51. http://dx.doi.org/10.1007/BF01061452
- Morsi, A.J. and Alexander, S.A. (1972) An Investigation of Particle Trajectories in Two-Phase Flow System. Journal of Fluid Mechanics, 55, 193-208. http://dx.doi.org/10.1017/S0022112072001806
- Ilea, C.G., Kosinski, P. and Hoffmann, A.C. (2008) Three-Dimensional Simulation of a Dust Lifting Process with Varying Parameters. International Journal of Multiphase Flow, 34, 869-878. http://dx.doi.org/10.1016/j.ijmultiphaseflow.2008.02.007
- Kosinski, P., Hoffmann, A.C. and Klemens, R. (2005) Dust Lifting behind Shock Waves: Comparison of Two Modelling Techniques. Chemical Engineering Science, 60, 5219-5230. http://dx.doi.org/10.1016/j.ces.2005.04.035
NOTES

*Corresponding author.