Open Journal of Inorganic Non-metallic Materials
Vol. 2 No. 4 (2012) , Article ID: 23426 , 8 pages DOI:10.4236/ojinm.2012.24005
Synthesis, IR and Raman Spectroscopic Studies of (Ba,Sr)TiO3 Borosilicate Glasses with Addition of La2O3
1Department of Physics University of Lucknow, Lucknow, India
2Department of Physics, Banaras Hindu University, Varanasi, India
Email: *gautam_ceramic@yahoo.com
Received July 1, 2012; revised August 6, 2012; accepted September 1, 2012
Keywords: Glasses; X-Ray Diffraction; Inferared Spectroscopy and Raman Spectroscopy
ABSTRACT
A series of glasses were prepared by rapid melt quench method in the glass system (65 − x)[(Ba0.6Sr0.4)TiO3]- 30[2SiO2-B2O3]-5[K2O]-x[La2O3] (x = 0, 1, 2, 5 and 10). X-ray diffraction of glass samples were carried to check its amorphousity. Density of glass samples were measured using Archimedes principle. The refractive index of these glass samples lies between 2.39 to 2.80. Optical properties of these glass samples were studied using Infrared (IR) and Raman spectroscopic techniques. IR measurements were done over a continous spectral range 450 - 4000 cm–1 to study their stucture networking systematically while Raman spectra were recorded over a continous spectral range 200 - 2000 cm–1. IR spectra of all glass samples showed number of absorption peaks. These absorption peaks occurs due to asymetric vibrational streching of borate by relaxation of the bond B-O of trigonal BO3. The Raman spectra of all glass samples exhibited different spectral bands and intensity of these bands changes drastically. The network structure of these glass samples is mainly based on BO3 and BO4 units placed in different structural groups.
1. Introduction
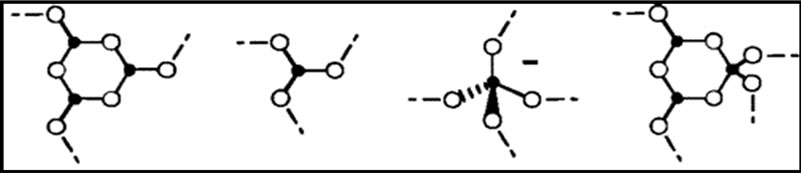
Glasses in the system PbO-B2O3-SiO2 and PbO-Al2O3- B2O3-SiO2 have different applications, such as thick film technology ink constituents, mixed oxide dielectrics (MODs) and host for fluorescence centers in optical devices. These glasses are chemically stable over a wide composition range and have a desirable electrical resistivity. The lead borosilicate glasses are used as radiation hard glasses [1]. Vibrational spectroscopy has been used for long time to investigate the structure of glasses and the identification of the main structural groups [2-4]. Infrared spectroscopy has very useful technique because it provides a means to determine local structure of building units which constitutes the glassy network [5]. Borates and borosilicate glasses containing boron oxide have been widely used for optical lenses with high refractive index and low dispersion characteristics [6]. The oxide glasses have wide applications in the fields of electronics, nuclear and solar energy technologies and acoustic-optic devices [7-11]. Glasses based on boron oxide exhibit structural chemistry of structure. Boron is commonly found in the glasses in the form of triborate and tetraborate units [12]. Alkali borate glasses are best glass forming systems for demonstrating the effectiveness of the spectroscopic technique in the glass science [13]. IR spectra of (Pb,Sr)TiO3 borosilicate glass system show sharp and diffuse absorption peaks. These peaks occur due to different vibrational mode of the borate network and asymmetric stretching relaxation of the B-O bond of trigonal BO3 units. Vibrational spectra of PbOBi2O3-B2O3 glasses show the formation of broad bands. IR studies of ZnO-PbO-B2O3-SiO2 glasses shows absorption bands due to bond breaking between the trigonal elements BO3 and allowing the formation of BO4 units. The structure of Zn-doped borate glass consists of randomly connected BO3 and BO4 groups. The IR spectra of ZnO-PbO-B2O3 glasses show eight to nine absorption peaks [14,15]. Low frequency bands in the IR spectra of these glasses can be attributed to vibration of metal cation such as Pb2+. The broad bands are exhibited in the oxide spectra due to the combination of high degeneracy of vibrational states [16,17]. IR spectra of lead silicate glasses were exhibited due to bending modes Si-O-Si and O-Si-O as well as symmetric stretching of bridging oxygen between tetrahedra [18]. IR study of lithium borate glasses show cleared and disappearance of boroxol rings with the formation of BO4 groups [19]. Recently, IR studies of B2O3-ZnO-TeO2 glass system gives absorption bands due to vibrational Te-O bond stretching. B-O linkages in the borate network of B-O-B bending vibrations in BO4 units and H-O-H or water groups are present in these glasses [20]. Raman spectroscopy is a very useful tool to provide valuable information about impurities, internal stress, crystal symmetry and bond nature [21-26]. IR and Raman studies on lithium-potassium-borate glasses exhibited due to vibrational stretching of borate network of the BO3 and BO4 units placed in different structural groups [27]. The various structural groups of borate network are shown in Figure 1 [27,28].
Raman spectroscopy of epitaxial barium titanate, BT, thin film shows both paraelectric to ferroelectric phase transformations. The diffuse phase transition is confirmed by the gradual decrease of the intensities of the overdamped soft mode and the tetragonal Raman shift [29]. Raman spectra of hetero-epitaxial BST prepared on MgO substrates were obtained in side-view backscattering geometry and causes local distortions of the Ti-O-Ti chains [30]. Vibrational spectra of BT single crystals have been studied and give displacive orderdisorder crossover [31-36]. Recently, IR and Raman spectroscopic studies have been done on alkaline-earth silicate glasses by Angelos G Kalampounias [37]. This study shows the vibrational spectra due to vibrational stretching of Si-O in (Si-OH) silanol groups. BST borosilicate glasses have potential applications in making high refractive index glasses for optical devices and their glass ceramics are used for making electronic devices, such as barrier layer capacitor. In this research paper we are reporting our results on optical properties of BST borosilicate glasses with doping effect of La2O3.
2. Experimental Procedure
The high purity of AR grade chemicals BaCO3 (Himedia 99%), SrCO3 (Himedia 99%), TiO2 (Himedia 99%), SiO2 (Himedia 99.5%), H3BO3 (Himedia 99.8%), K2CO3 (Himedia 99.9%) and La2O3 (Himedia 99.9%) were mixed for 1.0 hour in acetone media using mortar and pestle.
 (a)
(a)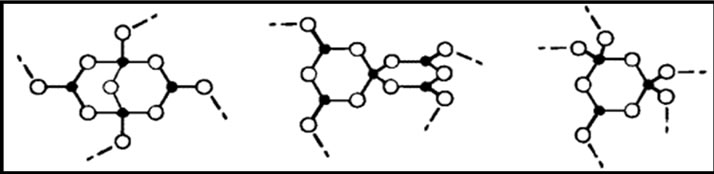 (b)
(b)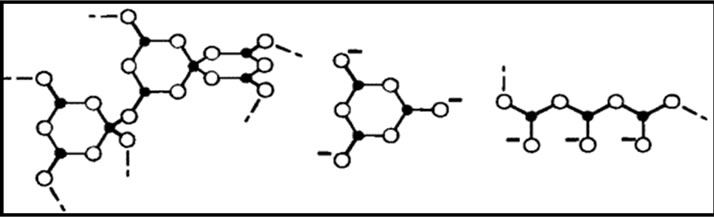 (c)
(c)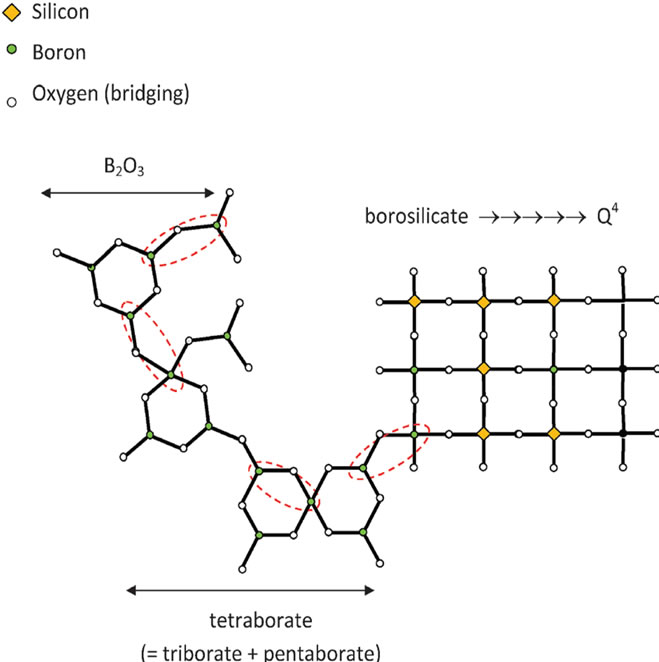 (d)
(d)
Figure 1. Structural groups found in glassy and crystalline potassium borates: (a) boroxol ring; (b) nonring BO3; (c) nonring ; (d) triborate; (e) diborate; (f) pentaborate; (g) di-triborate; (h) tetraborate; (i) ring-type metaborate; (j) chain-type metaborate (k) combination of triborate and pentaborate units. Filled circles and open circles represent boron and oxygen atoms, respectively. Dashed lines in the structures denote connections to the network, and chargesare shown for the nonbridging oxygen (NBO) in the metaborate groups [27,28].
The well mixed and dried powder were transfered in to a high alumina content crucible and then crucible is replaced inside the high temperature SiC electric furnace in the temperature range 1200˚C - 1350˚C. The melt was poured into an aluminum mould and pressed by a thick aluminum plate then immediately transferred in to a preheated muffle furnace for annealing at temperature 450˚C up to 3 hours. XRD patterns of glass samples were recorded using a Rigaku Miniflex-II X-ray diffractometer using Cu-Ka radiation for checking amorphous nature glass samples. The glass samples were prepared for measurement of refractive index. The five glass samples were designed of having equal thickness (0.7 mm) along with equal area (25 mm2). These samples were polished with different mesh of SiC powder to get the smooth surfaces. Electroding has been done on the both polished surfaces of all glass samples with silver palladium paste and then electroded samples were dried in a preheated oven at 200˚C. Finally, well dried glass samples were carried out for their capacitance measurement at room temperature. The density of glass samples depends upon doping concentration of La2O3. Therefore, it is worth-while to calculate the density of the prepared glass samples. The density of all glass samples were calculated by using Archimedes Principle [40]. Distilled water was used as the liquid medium. The density of these glass samples were listed in Table 1. The following formula was used for determination of the density of glass samples.
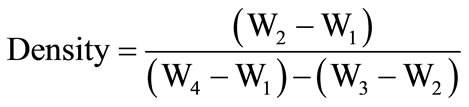 (1)
(1)
where, W1 = weight of empty specific gravity bottle (in gram);
W2 = weight of specific gravity bottle with sample (in gram);
W3 = weight of specific gravity of bottle with sample and distilled water (in gram);
W4 = weight of specific gravity bottle with distilled water (in gram).
Density of distilled water = 1.0 gm/cm3
The powdered glass samples were mixed with KBr powder and pressed as pellets. These pellets are carried out for the recording of IR spectra using JASCO FT/ IR-5300 in the wave number range 450 - 4000 cm–1 at room temperature. Micro Raman setup, Renishaw, UK, equipped with a grating of 1800 lines/ mm and Olymapus (model MX-50) A/T was attached with spectrometer which focuses laser light into sample and collect the scattered at 180˚ by scattering geometry. The 15.4 nm Ar+ laser was used as an excitation source and GRAM-32 software for data collection. Raman spectra of powdered glass samples were also recorded in the wave number range 200 - 2000 cm–1.
3. Results and Discussion
3.1. X-Ray Diffraction Analysis
The XRD patterns of all glass samples are shown in Figure 2. These figures exhibit a broad diffuse scattering at different angles instead of crystalline peaks, confirming a long range structural disorder characteristic of amorphous network.
3.2. Density Analysis of Glass Samples
The density of BST borosilicate glass samples doped with La2O3 is listed in Table 1. The variation of density Vs doping concentration of La2O3 is shown in Figure 3. With increasing doping concentration of La2O3 increases the density of the glass samples. The density of BST borosilicate glass without doping of La2O3 was calculated 2.67 gm/cc. This is because of high density of La is 6.17 gm/cc whereas density of Ba and Sr are 3.5 and 2.6 gm/cc.
3.3. Dielectric Constant and Refractive Index
The dielectric constant for all glass samples are measured, by measuring their capacitance measurement at room temperature and 50 Hz frequency, using the relation
C = εoA/d (2)
where “εo” denotes the permittivity in air, “A” denotes the area of samples and “d” denotes the thickness of samples.
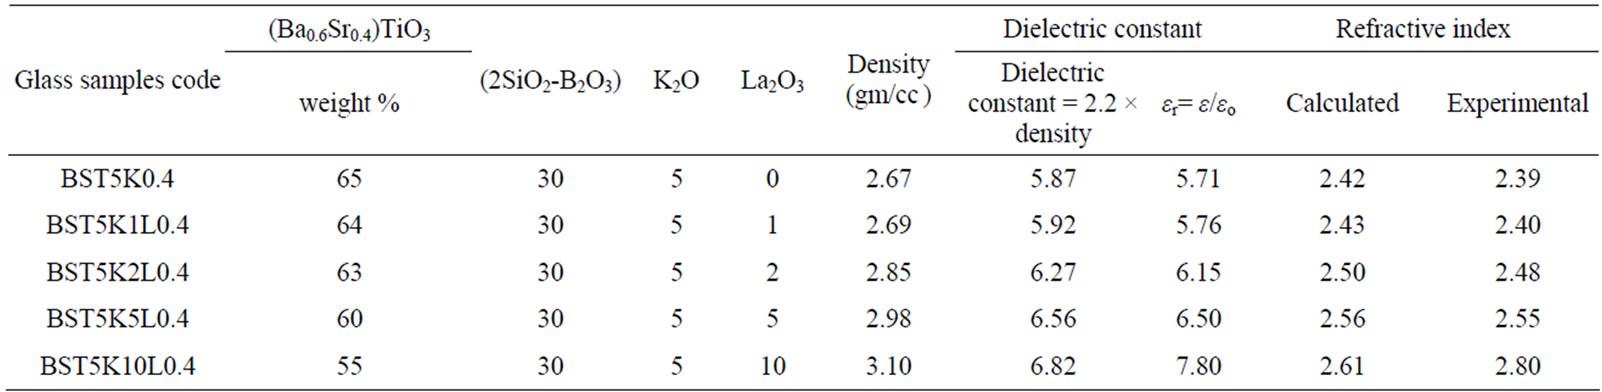
Table 1. Glass samples code, compositional distribution of different constituents, density, dielectric constant and refractive index of glass samples.
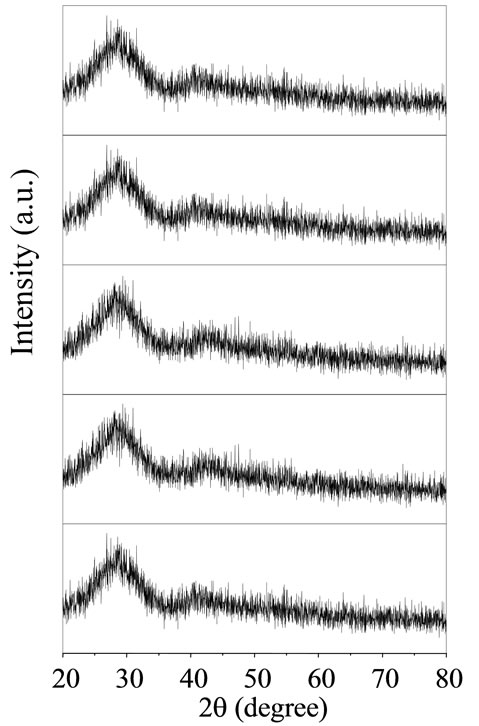
Figure 2. XRD pattern of BST borosilicate glass samples.
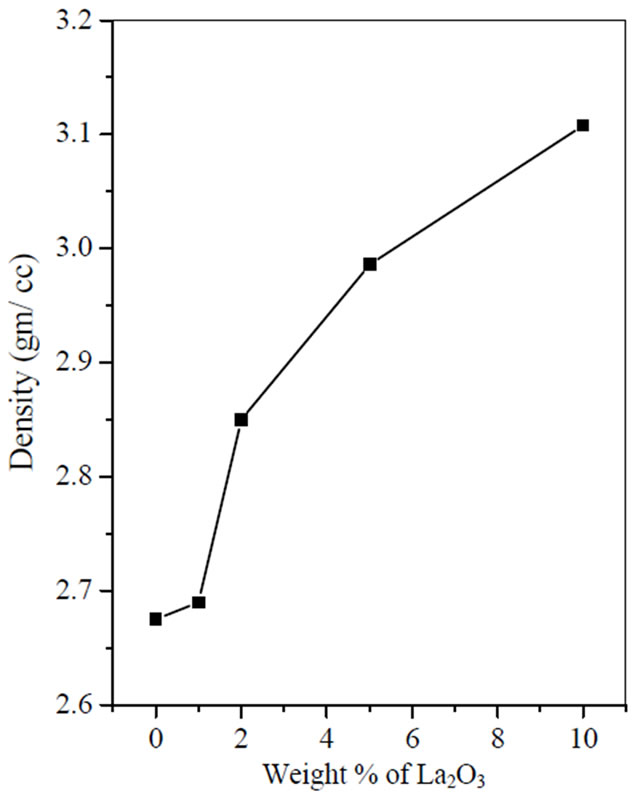
Figure 3. Density of glass samples vs doping concentration of La2O3.
The numerical value of dielectric constant can be estimated for most industrial glasses by using the empirical formula [38]:
Dielectric constant = 2.2 × density (3)
The dielectric constants calculated by both methods are comparable which are listed in Table 1. The refractive index of BST borosilicate glass samples were calculated by using the relation between refractive index and dielectric constant.
n = (εr)1/2(4)
where n is the refractive index of the material and εr is the relative dielectric constant.
The refractive index of these glass samples are listed in Table 1. The measured refractive indices are of same order, which are calculated by two methods. The refractive of glass sample BST5K1L0.4 is found to be 2.43 whereas for glass sample BST5K2L0.4 is 2.50. It is observed from Table 1 the refractive index of glass samples are increases with increasing the concentration of La2O3. It is because of the refractive index of La2O3 is very high. The refractive indices of all glass samples were found to be more than 2. Therefore, these glass samples are useful for making lenses application in small optical devices such as smart phones with a digital camera, endoscopes, and next-generation optical disk systems [39]. These results indicate that the La2O3 doped BST borosilicate glass system would be useful for optical applications in the visible to infrared region.
3.4. Infrared Spectroscopy
The IR absorption spectra gives significant information about molecular vibrations as well as rotation associated with a covalent bond. The IR spectra occur due to change in the dipole moment of the molecule. It involves the twisting, bending, rotating and vibrational motions in a molecule. IR spectra of various BST borosilicate glasses doped with La2O3 are shown in Figure 4. IR spectra of all glass samples consist of broad and sharp bands in different regions lies between wavenumbers 450 - 4000 cm–1. These bands are strongly influenced by doping of La2O3. Wavenumbers of different absorption peaks for all the glass samples are listed in Table 2. All the absorption peaks have been marked as numbered 1, 2, 3,…, 8 starting from high wave number side to low wave number side. The broad bands are exhibited in the oxide spectra, most probably due to the combination of high degeneracy of vibrational states, thermal broadening of the lattice dispersion bands and mechanical scattering from powder samples [40]. The first absorption peak lies in the wavenumber range 3467 - 3479 cm–1. This absorption peak is sharp in glass sample BT5K10L0.4 in comparison to other glass samples. The sharpness of this peak increases by increasing the doping concentration of La2O3. This band occurs due to molecular water inside the glassy network [41]. The absorption peaks 2 and 3 were found in all glass samples and lies within wavenumber 2852 - 2925 cm–1. The absorption band of this wavenumber range occurs due to hydrogen bonding in the glassy matrix [42]. IR spectra of various glass samples show sharp and diffuse absorption peaks in wavenumbers range 2346 - 2380 cm–1 (peak no. 4 a, b). This peak shows a splitting into two closed doublet peaks with different peak position in their IR spectra. The sharpness of the peaks decreases by increasing the doping concentration of La2O3. This absorption band attributed to O-H
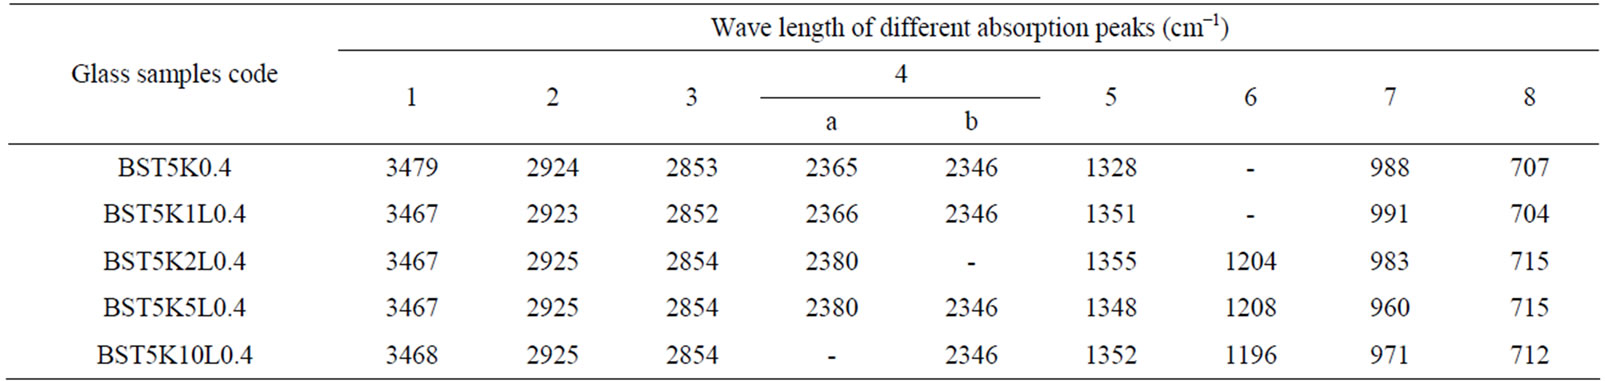
Table 2. Peak positions in IR spectra of glass samples in the system (65 − x)[(Ba0.6Sr0.4)TiO3]-30[2SiO2.B2O3]-5[K2O]-x[La2O3].
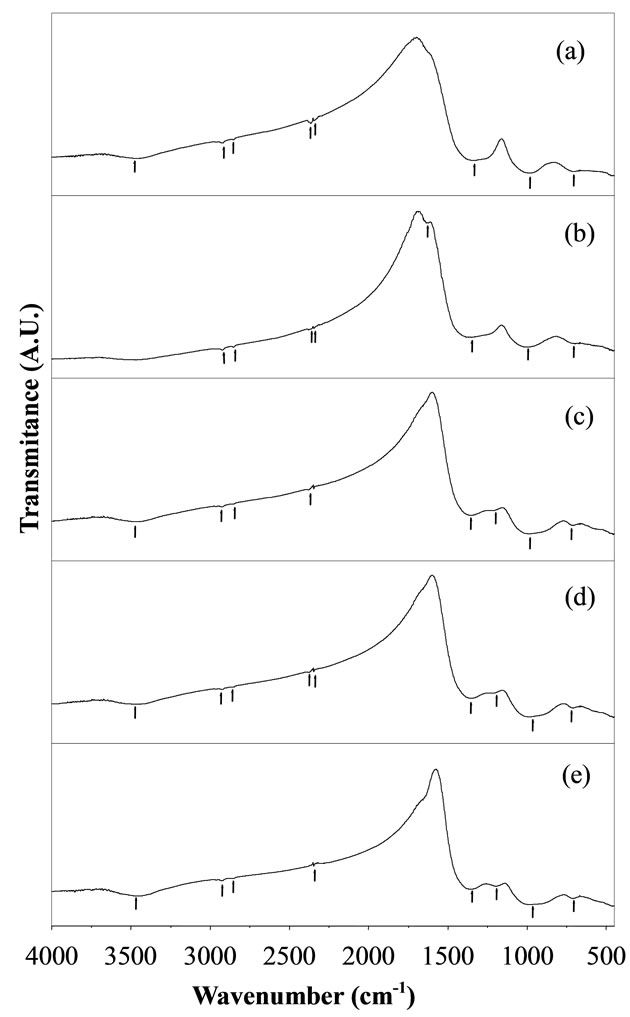
Figure 4. IR spectra of BST borosilicate glass samples (a) BST5K0.4; (b) BST5K1L0.4; (c) BST5K2L0.4; (d) BST5K- 5L0.4 and (e) BST5K10L0.4.
bond groups. These O-H bond groups are formed at nonbridging oxygen sites. A broad peak no. 5 is observed with wavenumbers range 1196 - 1296 cm–1 in the IR spectra of glass samples containing amount of La2O3 (x = 2, 5 and 10) while this peak is absent for glass samples BST5K0.4 and BST5K1L0.4. Generally absorption bands occur due to the vibrational mode of the borate network in such type glass system. The vibrational modes of the borate network are mainly due to the asymmetric stretching relaxation of the B-O bonds of trigonal BO3 units. Such type of vibrational modes occurs within the wavenumbers range 1200 - 1750 cm–1 [43,44]. The broad absorption band around wavenumbers, 960 - 991 cm–1 (peak no. 6) is attributed to stretching vibrations of BO-Si linkage [45]. An absorption peak no.8 is observed with wavenumber range 704-715 cm–1 in the IR spectra of all glass samples. This peak was present due to the diborate linkage of B-O-B, in the borate glassy network. In this linkage both boron atoms are tetrahedrally coordinated with triborate superstructural units [46]. Assignment of Infrared bands in the spectra of different glass samples is listed in Table 3. The addition of La2O3 increases the sharpness of the absorption peaks and decreases the broadness of absorption peaks.
3.5. Raman Spectroscopy
Raman spectroscopy is one of the powerful techniques to investigate the structure of a material. Raman spectra of various BST borosilicate glass samples doped with La2O3 are shown in Figures 5(a)-(e). Raman spectra of these glasses indicate two peaks at different position. Figure 5(a) shows Raman spectra of glass sample BST5K0.4 (x = 0) without doping of La2O3. In this spectral pattern, two separate peaks were observed at wavenumbers 675 and 820 cm–1. The peak at 675 cm–1 was attributed to metaborate groups while peak at wavenumber 820 cm–1 occurs due to symmetric breathing vibrations of sixmember rings with one or two BO3 triangles replaced by BO4 tetrahedra [47]. The Raman spectra of glass sample BST5K1L0.4 doped with 1 wt% of La2O3 is shown in Figure 5(b). Raman spectra of glass sample BST5K2L0.4 doped with 2 wt % La2O3 depict three peaks at wavenumbers 283, 708 and 830 cm–1 respectively (Figure 5(c)). The peak at 708 cm–1 is the characteristic of Symmetric breathing vibrations BO3 triangles replaced by BO4 tetrahedra. An extra peak at low wavenumber, 283 cm–1 was also observed. This peak occurs due to La-O and K-O (metalic cations) bonding vibrations. Figure 5(d) shows Raman spectra of glass sample BST5K5L0.4 doped with 5 wt% of La2O3. This spectra represents three peaks at wavenumbers 288, 697 and 841 cm–1 respectively. A shifting in the peak was also observed due to increase in doping concentration of La2O3. Raman spectra of glass sample BST5K10L0.4 doped with 10 wt % of La2O3 are shown in Figure 5(e). Three peaks were also
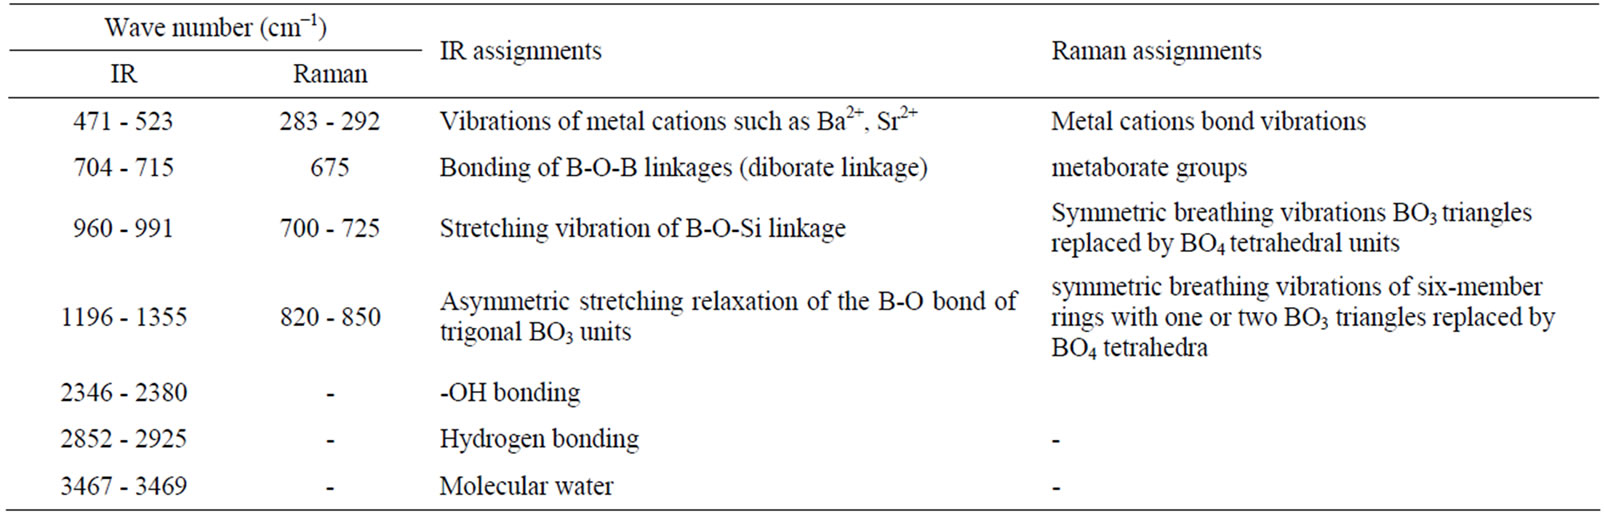
Table 3. Assignment of Infrared and Raman bands in the spectra of different glass samples.
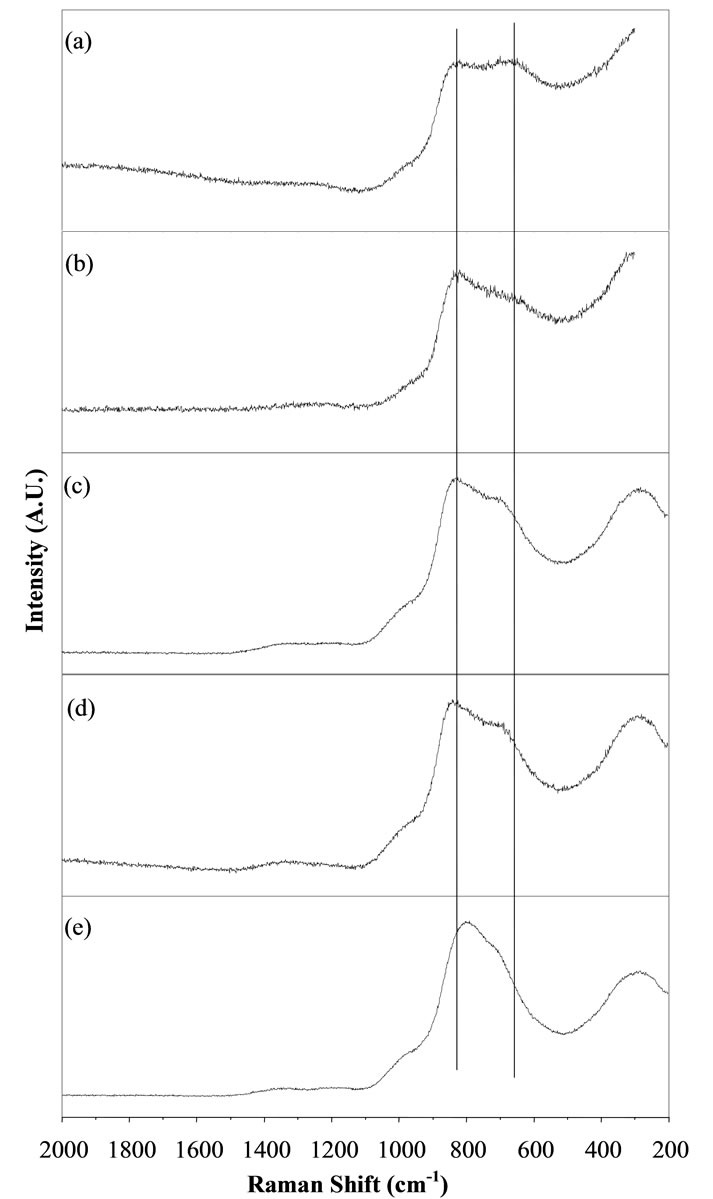
Figure 5. Raman spectra of BST borosilicate glass samples (a) BST5K0.4; (b) BST5K1L0.4; (c) BST5K2L0.4; (d) BST- 5K5L0.4 and (e) BST5K10L0.4.
observed at different wavenumbers, 292, 720 and 796 cm–1 in the Raman spectra of this glass sample. The se- cond peak is closed to the first peak (796 cm–1). In other words, we can say that this peak is shifted towards higher wavenumber side because of high doping concentration
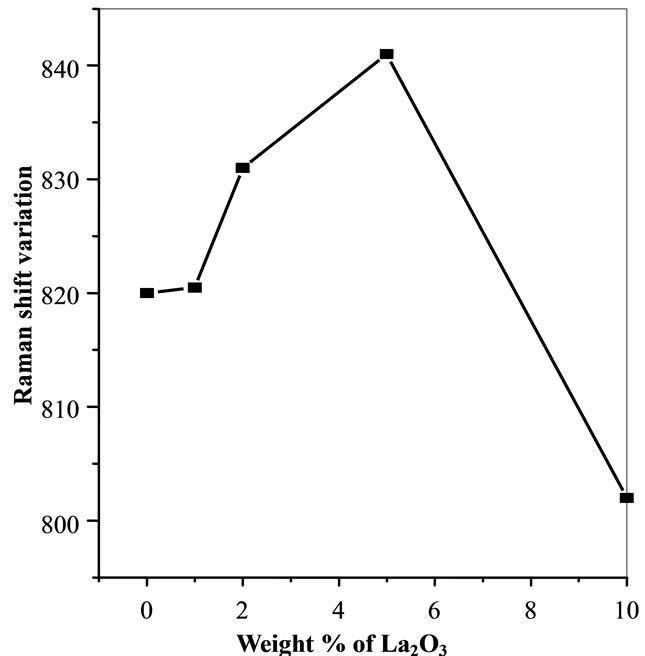
Figure 6. Variation of raman shift with respect to doping concentration of La2O3.
of La2O3. The Raman shifting was observed with increasing the doping concentration of La2O3 which is shown by the two parallel lines in Figure 5. The variation of the peak position in Raman spectra was observed with varying concentration of La2O3. Variation of Raman shift with respect to doping concentration of La2O3 is shown in Figure 6. Assignment of Raman bands in the spectra of different glass samples is also listed in Table 3. Raman spectra show a shifting in the peaks towards high wavenumber side from 0 to 5 wt% of La2O3 while this shifting is going towards low wavenumber side for 10 wt% of La2O3.
4. Conclusion
Bulk transparent glasses were prepared successfully in the BST borosilicate glass system with and without doping of La2O3. The absorption peaks occur in IR spectra is due to different vibrational modes of the borate network and asymmetric stretching relaxation of the B-O bond of BO3 units. The addition of La2O3 decreases the sharpness of peaks and increases the broadness of absorption peaks in their IR spectra because La2O3 acts as network modifier for this glass system. Raman spectra of all BST glass samples are observed in several spectral bands. These bands are attributed to symmetric breathing vibrations of six-member rings with one or two BO3 triangles replaced by BO4 tetrahedra, La-O and K-O bonding vibrations. As increasing the doping concentration of La2O3 the intensity of the peaks are also increases. These results indicate that the La doped BST borosilicate glass system may be useful for optical applications in the visible to IR region.
5. Acknowledgements
The authors are gratefully acknowledged to the University Grant Commission (UGC), New Delhi, (India) for financial support under the major research project F. No. 37-439/2009 (SR).
REFERENCES
- M. J. Plodinec, “Borosilicate Glasses for nuclear waste imobilisation,” Glass Technology, Vol. 41, No. 6, 2000, pp. 186-192.
- E. I. Kamitsos, M. A. Karakassides and G. D. Chryssikos, “Vibrational Spectra of Magnesium-Sodium-Borate Glasses: Raman and Mid-Infrared Investigation of the Network Structure,” Journal of Physical Chemistry, Vol. 91, No. 5, 1987, pp. 1073-1079. doi:10.1021/j100289a014
- E. I. Kamitsos, “Infrared Studies of Borate Glasses,” Journal of Physical Chemistry of Glasses, Vol. 44, No. 2, 2003, pp. 79-87.
- A. M. Efimov, “Vibrational Spectra, Related Properties, and Structure of Inorganic Glasses,” Journal of Non-Crystalline Solids, Vol. 253, No. 1, 1999, pp. 95-118. doi:10.1016/S0022-3093(99)00409-3
- G. J. Exarhos, “Structure and Bonding in Non-Crystalline Solids,” Plenum, New York, 1986, p. 203. doi:10.1007/978-1-4615-9477-2_11
- N. A. EI-Alaily and R. M. Mohamed, “Effect of Irradiation on Some Optical Properties and Density of Lithium Borate Glass,” Materials Science and Engineering Bulletin, Vol. 98, No. 9, 2003, pp. 193-203.
- H. Hirashima, D. Arai and T. Yoshida, “Electrical Conductivity of PbO-P2O5V2O5 Glasses,” Journal of the American Ceramic Society, Vol. 68, No. 9, 1985, pp. 486-489. doi:10.1111/j.1151-2916.1985.tb15814.x
- V. Rajendaran, N. Palanivelu, H. A. EI-Batal, F. A. Khalifa and N. A. Shafi, “Effect of Al2O3 Addition on the Acoustical Properties of Lithium Borate Glasses,” Acoustics Research Letters, Vol. 23, No. 6, 1999, pp. 113-121.
- K. Singh, H. Singh, V. Sharma, R. Nathuram, A. Khanna, R. Kumar, S. S. Bhatti and H. S. Sahota, “Gamma-Ray Attenuation Coefficients in Bismuth Borate Glasses,” Nuclear Instruments and Methods in Physics Research Section B, Vol. 194, No. 1, 2002, pp. 1-6. doi:10.1016/S0168-583X(02)00498-6
- A. Khanna, S. S. Bhatti, K. J. Singh and K. S. Thind, “Gamma-Ray Attenuation Coefficients in Some Heavy Metal Oxide Borate Glasses at 662 keV,” Nuclear Instruments and Methods in Physics Research Section B, Vol. 114, No. 3,1996, pp. 217-220. doi:10.1016/0168-583X(96)00196-6
- H. Singh, K. Singh, G. Sharma, R. Nathuram and H. S. Sahota, “ZnO-PbO-B2O3 Glasses as Gamma-Ray Shielding Materials,” Nuclear Science and Engineering, Vol. 142, No. 3, 2002, pp. 342-348.
- M. K. Takayama and S. Sakka, “Electrical Conductivities of Mixed Cation Glasses,” Journal of Non-Crystalline Solids, Vol. 40, No. 1-3, 1980, pp. 149-158. doi:10.1016/0022-3093(80)90099-X
- J. Wang, C. A. Agell, “Glass Structure by Spectroscopy Ch.7,” Dekker, New York, 1976.
- D. Singh, K. Singh, G. Singh, M. Priya, S. Mohan, M. Arora and G. Sharma, “Optical and Structural Properties of ZnO-PbO-B2O3 and ZnO-PbO-B2O3-SiO2 Glasses,” Journal of Physics: Condensed Matter, Vol. 20, No. 7, 2008, pp. 75228-75233. doi:10.1088/0953-8984/20/7/075228
- S. G. Motke, S. P. Yawale and S. S. Yawale, “Infrared Spectra of Zinc Doped Lead Borate Glasses,” Bulletin of Materials Science, Vol. 25, No. 1, 2002, pp. 75-78. doi:10.1007/BF02704599
- Z. Peng, Y. Xi and Z. Liangying, “Preparation of Sol-Gel Derived Glass-Ceramics with Pure Nano-Sized Barium Titanate Crystals,” Ferroelectrics, Vol. 264, No. 1, 2001, pp. 99-104. doi:10.1080/00150190108008553
- M. Arora, S. Baccaro, G. Sharma, D. Singh, K. S. Thind and D. P. Singh, “Radiation Effects on PbO-Al2O3-B2O3- SiO2 Glasses by FTIR Spectroscopy,” Nuclear Instruments and Methods in Physics Research Section B, Vol. 267, No. 5, 2009, pp. 817-820. doi:10.1016/j.nimb.2009.01.003
- A. M. Abdelghany, “The Elusory Role of Low Level Doping Transition Metals in Lead Silicate Glasses,” Silicon, Vol. 2, No. 3, 2010, pp. 179-184. doi:10.1007/s12633-010-9053-8
- K. S. Oo, M. Lwin, P. Kaung and S. Htoon, “Infrared Spectroscopy and Raman Scattering Studies on the Structure of Lithium Borate Glass,” Journal of Myan Acadmic Arts Science, Vol. 4, 2006, pp. 277-281.
- P. G. Pavani, K. Sadhana and V. C. Mouli, “Optical, Physical and Structural Studies of Boro-Zinc Tellurite Glasses,” Physica B: Condensed Matter, Vol. 406, No. 6-7, 2011, pp. 1242-1247. doi:10.1016/j.physb.2011.01.006
- Yu. I. Yuzyuk, R. Farhi, V. L. Lorman, L. M. Rabkin, L. A. Sapozhnikov, E. V. Sviridov and I. N. Zakharchenko, “A Comparative Raman Study of Ferroelectric PbTiO3 Single Crystal and Thin Film Prepared on MgO Substrate,” Journal of Applied Physics, Vol. 84, No. 1, 1998, pp. 452-457. doi:10.1063/1.368048
- I. Taguchi, A. Pignolet, L. Wang, M. Proctor, F. Levy and P. E. Schmid, “Raman Scattering from PbTiO3 Thin Films Prepared on Silicon Substrates by Radio Frequency Sputtering and Thermal Treatment”, Journal of Applied Physics, Vol. 73, No. 1, 1993, pp. 394-399. doi:10.1063/1.353862
- L. H. Robins, D. L. Kaiser, L. D. Rotter, P. K. Schenck, G. T. Stauf and D. Ritz, “Investigation of the Structure of Barium Titanate Thin Films by Raman Spectroscopy,” Journal of Applied Physics, Vol. 76, No. 11, 1994, pp. 7487-7498. doi:10.1063/1.357978
- A. A. Sirenko, I. A. Akimov, J. R. Fox, A. M. Clark, H. C. Li and W. Si, X. X. Xi, “Observation of the First-Order Raman Scattering in SrTiO3 Thin Films,” Physical Review Letters, Vol. 82, No. 22, 1999, pp. 4500-4503. doi:10.1103/PhysRevLett.82.4500
- P. S. Dobal, S. Bhaskar, S. B. Majumder and R. S. Katiyar, “Micro-Raman Investigation of Stress Variations in Lead Titanate Films on Sapphire,” Journal of Applied Physics, Vol. 86, No. 2, 1999, pp. 828-834. doi:10.1063/1.370810
- R. Naik, J. J. Nazarko, C. S. Flattery, U. D. Venkateswaran, V. M. Naik, M. S. Mohammed, G. W. Auner, J. V. Mantese, N. W. Schubring, A. L. Micheli and A. B. Catalan, “Temperature Dependence of the Raman Spectra of Polycrystalline Ba1-xSixTiO3,” Physical Review B, Vol. 61, No. 17, 2000, pp. 11367-11372. doi:10.1103/PhysRevB.61.11367
- G. Padmaja and P. Kistaiah, “Infrared and Raman Spectroscopic Studies on Alkali Borate Glasses: Evidence of Mixed Alkali Effect,” Journal of Physical Chemistry A, Vol. 113, No. 11, 2009, pp. 2397-2404. doi:10.1021/jp809318e
- A. P. Howes, N. M. Vedishcheva, A. Samoson, J. V. Hanna, M. E. Smith, D. Holland and R. Dupree, “Boron Environments in Pyrex® Glass: A High Resolution, Double-Rotation NMR and Thermodynamic Modelling Study,” Physical Chemistry Chemical Physics, Vol. 13, No. 25, 2011, pp. 11919-11928. doi:10.1039/c1cp20771g
- M. El Marssi, F. Le Marrec, I. A. Lukyanchuk and M. G. Karkut, “Ferroelectric Transition in an Epitaxial Barium Titanate Thin Film: Raman Spectroscopy and X-Ray Diffraction Study,” Journal of Applied Physics, Vol. 94, No. 5, 2003, pp. 3307-3312. doi:10.1063/1.1596720
- Yu. I. Yuzyuk, V. A. Alyoshin, I. N. Zakharchenko, E. V. Sviridov, A. Almeida and M. R. Chaves, “PolarizationDependent Raman Spectra of Heteroepitaxial (Ba,Sr) TiO3/MgO thin films,” Physical Review B, Vol. 65, No. 13, 2002, pp. 134107-134116. doi:10.1103/PhysRevB.65.134107
- M. P. Fontana and M. Lambert, “Linear Disorder and Temperature Dependence of Raman Scattering in BaTiO3,” Solid State Communications, Vol. 10, No. 1, 1972, pp. 1-4. doi:10.1016/0038-1098(72)90334-1
- A. Scalabrin, A. S. Chaves, D. S. Shim and S. P. S. Porto, “Temperature Dependence of the A1 and E Optical Phonons in BaTiO3,” Physica Status Solidi (b), Vol. 79, No. 2, 1977, pp. 731-742. doi:10.1002/pssb.2220790240
- Y. Luspin, J. L. Servoin and F. Gervais, “Soft Mode Spectroscopy in Barium Titanate,” Journal of Physics C, Vol. 13, 1980, pp. 3761-3773.
- H. Vogt, J. A. Sanjurjo and G. Rossbroich, “Soft-Mode Spectroscopy in Cubic BaTiO3 by Hyper-Raman Scattering,” Physical Review B, Vol. 26, No. 10, 1982, pp. 5904-5910. doi:10.1103/PhysRevB.26.5904
- J. Petzelt, G. V. Kozlov and A. A. Volkov, “Dielectric Spectroscopy of Paraelectric Soft Modes,” Ferroelectrics, Vol. 73, No. 1, 1987, pp. 101-123. doi:10.1080/00150198708227912
- K. Laabidi, M. D. Fontana and B. Jannot, “Underdamped Soft Phonon in Orthorhombic BaTiO3,” Solid State Communication, Vol. 76, No. 6, 1990, pp. 765-768. doi:10.1016/0038-1098(90)90623-J
- A. G. Kalampounias, “IR and Raman Spectroscopic Studies of Sol-Gel Derived Alkaline-Earth Silicate Glasses,” Bulletin of Materials Science, Vol. 34, No. 2, 2011, pp. 299-303. doi:10.1007/s12034-011-0064-x
- H. W. Bernard, S. De Jong, J. W. Adams, et al., “Ullmann’s Encyclopedia of Indrustrial Chemistry,” 6th Edition, Wiley, Weinheim, 2003, p. 11094.
- A. Masuno and H. Inoue, “High Refractive Index of 0.30 La2O3-0.70Nb2O5 Glass Prepared by Containerless Processing,” Applied Physics Express, Vol. 3, 2010, p. 102601. doi:10.1143/APEX.3.102601
- C. R. Gautam, D. Kumar and O. Parkash, “IR Study of Pb-Sr Titanate Borosilicate Glasses,” Bulletin of Materials Science, Vol. 33, No. 2, 2010, pp. 145-148. doi:10.1007/s12034-010-0020-1
- F. M. Ezz Eldin, N. A. E. L. Alaily, F. A. Khalifa and H. A. E. L. Batal, “Fundamental of Glass Science and Technology,” 3rd S.G. Conference, Verlag Der Deutschen lastechnischen Gesellschaft, 1995.
- A. Venktaraman, V. A. Hiremath, S. K. Date and S. D. Kulkarni, “A New Combustion Route to γ-Fe2O3 Synthesis,” Bulletin of Materials Science, Vol. 24, No. 6, 2001, 617-621. doi:10.1007/BF02704010
- G. Sharma, K. Singh, M. Priya, S. Mohan, H. Singh and S. Bindra, “Effects of Gamma Irradiation on Optical and Structural Properties of PbO-Bi2O3-B2O3 Glasses,” Radiation Physics and Chemistry, Vol. 75, No. 9, 2006, pp. 959-966. doi:10.1016/j.radphyschem.2006.02.008
- A. S. Tenny and J. J. Wong, “Vibrational Spectra of Vapor-Deposited Binary Borosilicate Lasses,” Chemical Physics, Vol. 56, No. 11, 1972, pp. 5516-5523.
- H. Doweidar, M. A. Abou Zeid and G. M. El. Damrawy, “Effect of Gamma Radiation and Thermal Treatment on Some Physical Properties of ZnO-PbO-B2O3 Glasses,” Journal of Physics D: Applied Physics, Vol. 24, No. 12, 1991, pp. 2222-2228. doi:10.1088/0022-3727/24/12/015
- P. G. Bray, “Interaction of Radiation with Solids,” Plenum, New York, 1967.
- B. N. Meera and J. Ramakrishna, “Raman Spectral Studies of Borate Glasses,” Journal of Non-Crystalline Solids, Vol. 159, No. 1, 1993, pp. 1-21. doi:10.1016/0022-3093(93)91277-A
NOTES
*Corresponding author.