Open Journal of Inorganic Non-metallic Materials
Vol.2 No.2(2012), Article ID:18738,7 pages DOI:10.4236/ojinm.2012.22002
DC Conductivity and Dielectric Behaviour of Glassy Se100–xZnx Alloy
Department of Physics, Jamia Millia Islamia, New Delhi, India
Email: nasir_sphy@yahoo.com, mzulfe@rediffmail.com
Received December 22, 2011; revised February 3, 2012; accepted February 18, 2012
Keywords: Glass; DC Conductivity; Activation Energy; Dielectric Constant; Dielectric Loss; DC Conduction Loss
ABSTRACT
The DC conductivity and dielectric properties of glassy Se100–xZnx 2 ≤ x ≤ 20 alloys have been investigated in the temperature range 303 - 487 K with frequency range 100 Hz – 1 MHz. It is observed that DC conductivity decreases and the activation energy increases with Zn content in Se-Zn system. Dielectric dispersion is observed when Zn incorporated in Se-Zn glassy system. The results are explained on the basis of DC conduction mechanism and dipolar-type dielectric dispersion.
1. Introduction
Chalcogenide Se based is very important due to its current use as photoreceptors in TV Videocon pick-up tubes [1], conventional xerographic machine and digital X-ray imaging [2,3].These types glasses are belongs to a special group of amorphous semiconductors, which include one, two, three and more chalcogenide elements S, Se, Te from the VI group of the periodic table. From the technical point of view’s Se based glassy alloy is important because of their potential applications. To defeat the difficulties, confirm additives are used and mostly used of Se-Zn Se-Sb, Se-Te, Se-Ge, Se-Si and Se-ln is the great interest important properties such as greater hardness, higher sensitivity, higher conductivity and smaller aging effects as compared to pure a-Se. The chalcogenide glassy are useful semiconductors point of application in optics, electronics and optoelectronics like as holography, infrared lenses, ionic sensors, ultra fast optical sensors. It has been focused on chalcogenide glasses of Se-Zn system [4,5] as the materials have been found importance for their electrical, optical, dielectric and kinetics parameters Stable glasses which have good photosensitive properties have been produced and can be n or p type. In low field conduction, the mobility and free carrier concentration are considered to be constant with field. However, the application of high field to free carrier system may affect both the mobility and the number of charge carriers. These studies have been stimulated by the attractive possibilities of using the structural disorder in amorphous semiconductors for the development of better, cheaper and more reliable solid state devices [6,7]. Several band models have been proposed to explain the electronic structure of these materials [8,9]. In the present work, we have reported the electrical and dielectric properties of glassy Se100–xZnx alloys.
2. Experimental
Preparation of Glassy Alloys
Glassy alloys of Se100–xZnx, (where 2 ≤ x ≤ 20) are prepared by melt quenching method. The highly pure materials (99.999%) having the desired compositional ratio of elements (Se and Zn) are sealed in a quartz ampoules (of length 7 cm and internal diameter ~8 mm) in a vacuum of about ~10–5 Torr. The sealed ampoules are kept inside a furnace where the temperature is raised to 850˚C at a rate of 4˚C - 5˚C/min for 11 hours with frequent rocking to ensure the homogenization of the melt. After rocking the ampoules are removed from the furnace and are cooled rapidly in ice-cool water to obtain the glassy nature. This quenching is done in ice-cool water. The nature of glassy alloys is verified by X-ray diffraction. The bulk samples in the form of pellets of pellets (diameter 1.0 cm and thickness 0.2 cm) are obtained by compressing the fine powder of glassy alloys under a load of about 4.11 × 10⁴ Pa using the hydraulic pressure. The DC conductivity and dielectric measurements are maintained under a vacuum of 10–3 Torr. The temperature is measured by mounting a calibrated chromel alumel thermocouple near the sample in a specially designed metallic sample holder. The current is measured with a digital picoammeter (Model DPA-111) by applied the dc voltage 1.5 Volts across the pellet sample and resulting the temperature dependent DC conductivity is measured for the bulk samples of Se100–xZnx. For the dielectric measurements the bulk samples are mounted between two steel electrodes inside a metallic sample holder. The three terminal measurements used to avoid any stray capacitance effect. All the measurements have been made on the annealed samples in vacuum of the order of 10–3 Torr over the entire temperature range (303 K - 487 K). A Wayne Kerr LCR meter (Model-1J4300R) is used for capacitance (C) and dissipation factor (D) measurements. The temperature dependence of dielectric parameters are studied in a heating run rate of 1 K/min. The parallel capacitance and dissipation factor are measured and then dielectric constant ( ) and dielectric loss (
 ) are calculated simultaneously. We preferred to experiment on the pellet rather than the bulk as macroscopic effects (gas bubbles, etc.) may appear in the bulk during preparation. It has been shown by Goyal et al. [10], both theoretically and experimentally, that bulk ingots and compressed pellets exhibit similar dielectric behaviour in chalcogenide glasses for the suspected inhomogeneities in case of compressed pellets in these materials. In this entire process the used pellets are to be an uncoated.
3. Result and Discussions
3.1. Powder X-Ray Diffraction Analysis
X-ray diffraction patterns of all samples are recorded at room temperature by using (A Panalytical (PW 3710) X-ray powder diffractometer with Cu Kα radiation (λ = 1.5405 Å). All the samples were scanned in angular range of 5˚ - 70˚ with scan speed of 0.01˚/s under the similar conditions. From XRD pattern it was clear that all the four samples Se98Zn2, Se95Zn5, Se90Zn10 and Se80Zn20 are belongs to similar structure of polycrystalline in nature as shown in Figure 1. The crystallize size is calculated using Scherer’s formula (D = kλ/βcosθB) of all the specimens in the Se-Zn system, where, D is thickness of crystallite, k is constant dependent on crystallite shape (0.89), λ is X-ray wavelength (1.5405Å), β is FWHM (full width at half max in radian) or integral breadth and θB is Bragg angle. The crystallized is found to be increases with increasing the Zn concentration in the glassy system Se100–xZnx and the values of crystallized size are given in the Table 1.
3.2. Scanning Electron Microscope
Figure 2 Shows the Scanning electron micrographs of all the samples and confirms the polycrystalline nature of the synthesized materials. The numbers of nanocrysts are increases with increase of Zn concentration in the complete system. It is clear from SEM micrograph at highest 20% Zn content that the nanocrysts are easy to see multi structures with the thickness in the glassy alloys Se100–xZnx.
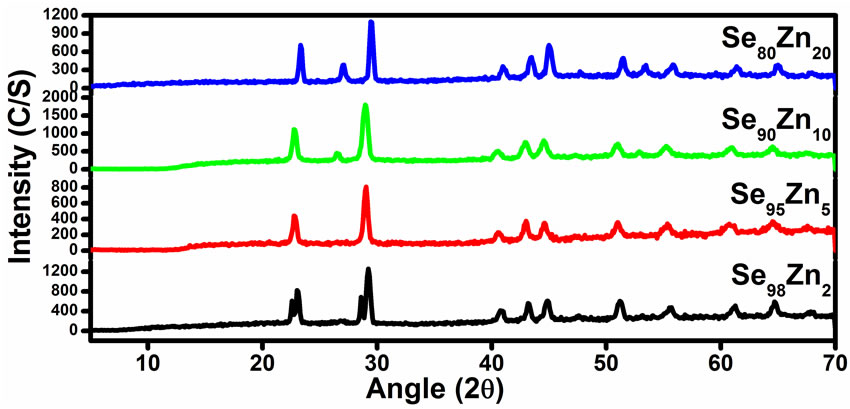
Figure 1. XRD diagrams for all the samples of Se100–xZnx.
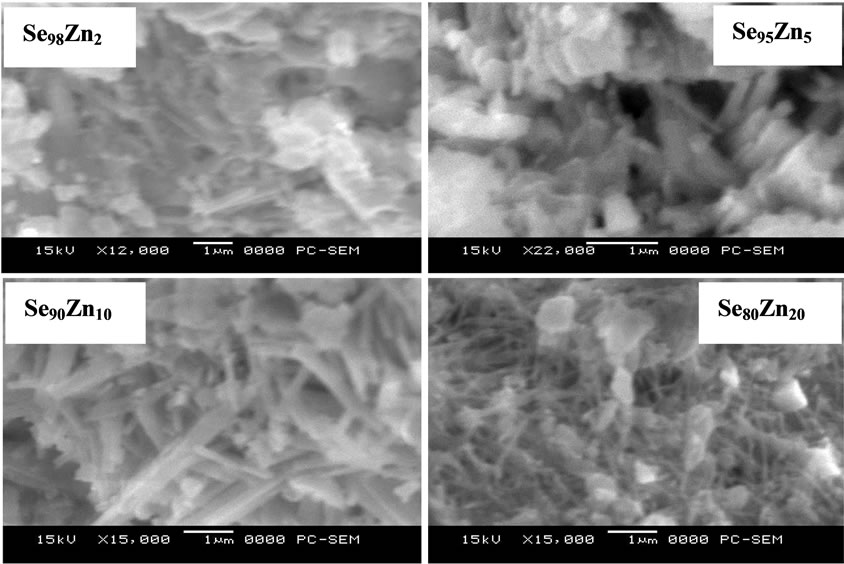
Figure 2. SEM micrograph for all the samples of Se100–xZnx glassy alloys.
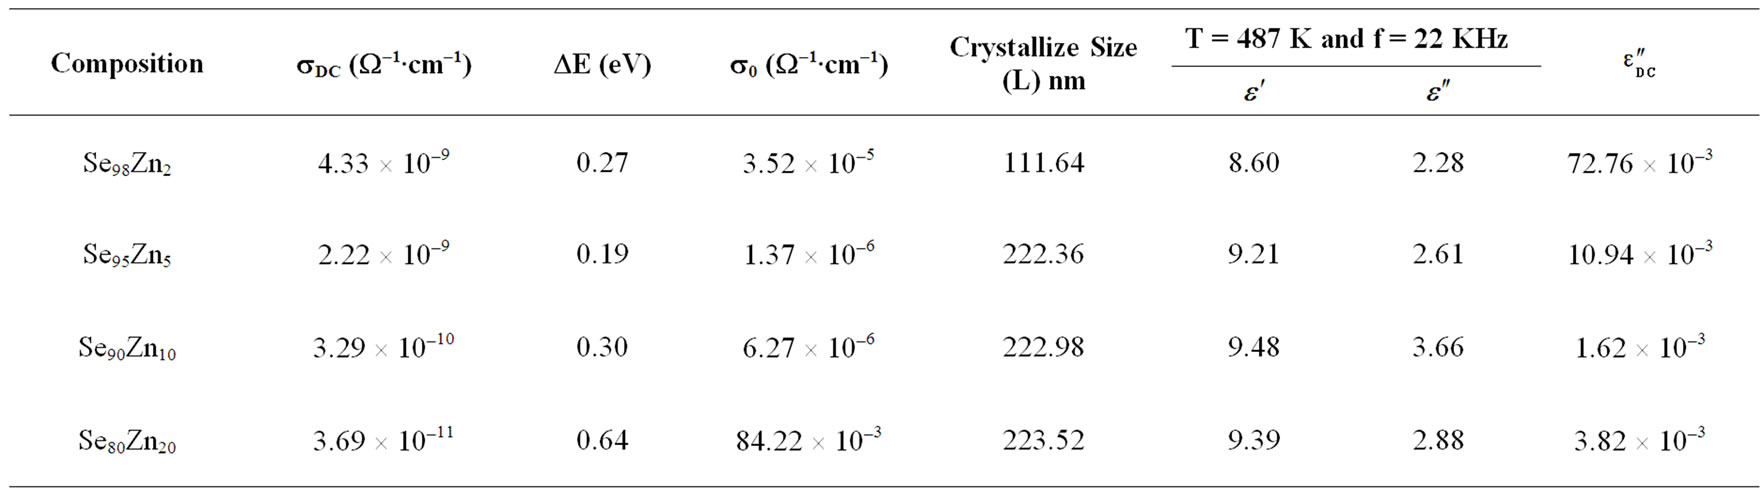
Table 1. Electrical and dielectric parameters of Se100–xZnx alloys at (340 K).
The thickness of synthesis nanocrysts are found in the range of (174 - 217 nm) in the system. The morphology of SEM micrograph is agreement with the powder XRD result because the numbers of clear sharp peaks are increases with increase of Zn concentration in the glassy system.
3.3. The Temperature Dependence of DC Conductivity
The temperature dependence of DC conductivity (sDC) in the bulk samples of Se100–xZnx 2 ≤ x ≤20 are measured. The variation of temperature dependence DC conductivity (sDC) is in the temperature range (315K - 450K) as in the Figure 3. The plot of ln(sDC) vs. 103/T represents a straight line which shows that electrical conduction is through thermally activated process with single activation energy in these glasses [11,12]. The conductivity (sDC), activation energy (DE) and the pre-exponentional factor (s0) are represented by well known relation in case of amorphous semiconductors for all samples [8].
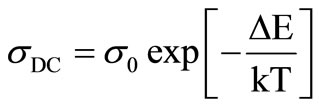 (1)
(1)
where (DE) is the activation energy for the DC conduction mechanism and “k” is the Boltzmann constant, “s0” is the pre-exponentional factor. The activation energy (DE) calculated from the slope of Figure 3 for each sample and the values are given in the Table 1, which also contains the values of sDC at 340 K. DC conductivity (sDC) are decreases with increases the composition and the activation energy (DE) are increases with increases the composition for the glassy Se100–xZnx system as shown in the Figure 4. The activation energy is found to decrease slowly at 5% of zinc content and then increases for high zinc concentration in the system. The decreasing of activation energy can be attributed to shifting of Fermi level [8]. The pre-exponentional factor (s0) are increases nonlinearly with the composition in the glassy system.
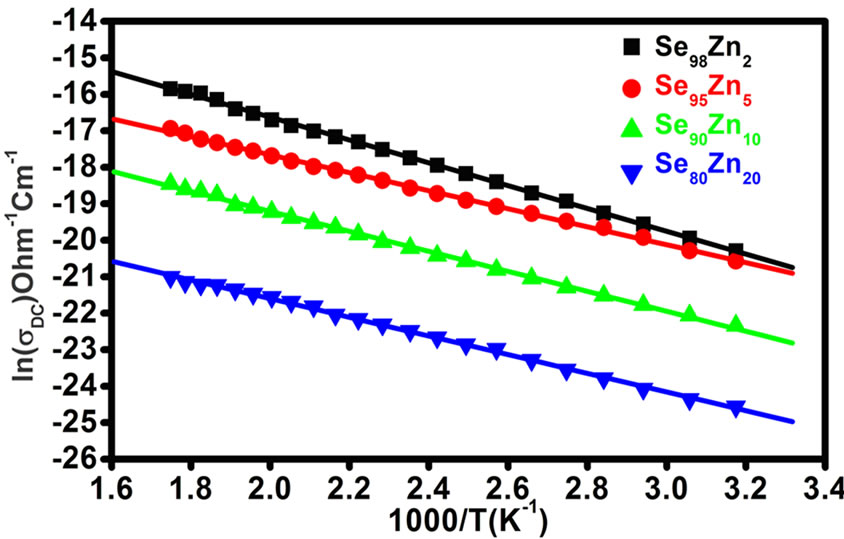
Figure 3. The plots of lnsDC vs. 103/T in the temperature range (315 K - 487 K) for all the samples of Se100–xZnx.
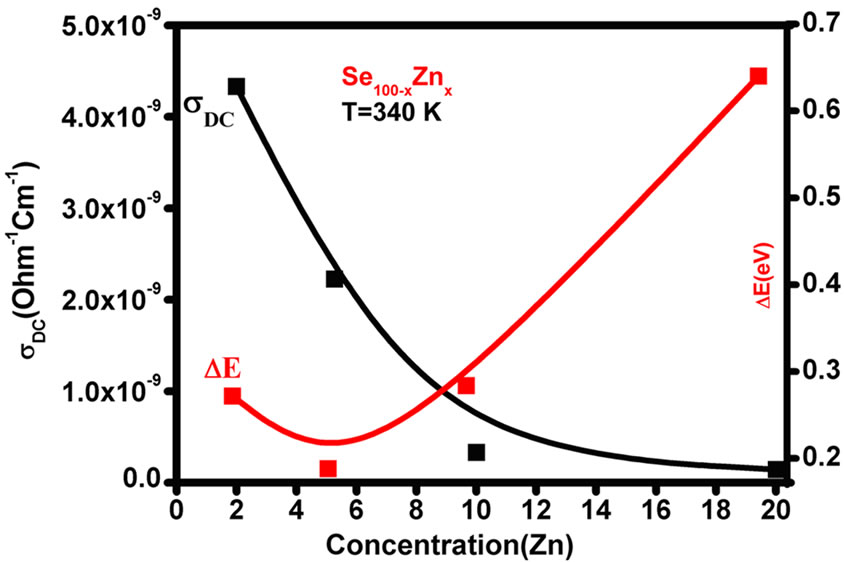
Figure 4. Conductivity (sDC) and Activation energy (DE) versus Zn content for all the samples of Se100–xZnx.
The value of activation energy (DE) and (s0) pre-exponentional is give the information about conduction through thermally assisted tunnelling of charge careers movement in the band tails of localized states. The conduction takes place either in the extended states above the mobility gap and it can be understand on the basis of the pre-exponential factor. Mott [13] has been suggested that the preexponentional factor (s0) for conduction mechanism in the localized states should be two to three orders smaller than for conduction in the extended states, and furthermore it would still become smaller for conduction in the localized states near the Fermi level. If the conduction in extended-state, the value s0, reported that for Se and other Se alloys films are of the order 104 W–1∙cm–1 [14], However, in the present case the value of s0 for Se-Zn and other films are found to be less than 104 W–1∙cm–1. The low value of s0 (10–6 - 10–3 W–1∙cm–1) shows that a wide range of localized state in the glassy system. Therefore, the possibility of localized conduction in the band tails most likely present [15] in the system Se100–xZnx. The activation energy increases with the corresponding DC conductivity decreases due to Se-Zn has blend structure both in bulk and in thin film form [15,16]. Selenium (Se) has about 40% atoms in a ring structure and 60% atoms are bonded polymeric chains with the conduction of p-type by J. Schottmiller [17]. However, the conductivity is decreases with Zn concentration that mean increase the conduction through the defect state associated with the impurity atoms [13].
3.4. Temperature and Frequency Dependent Dielectric Constant (ε') and Dielectric Loss (ε")
The temperature dependence of the dielectric constant ( ) and the dielectric loss (
 ) is studied for various frequencies (100 Hz - 1 MHz) of the glassy Se100–xZnx (2 ≤ x ≤ 20) alloys. The range of temperature is (303 - 487 K) in the glassy system. The dielectric constant (
 ) and the dielectric loss (
 ) for Se98Zn2 increases with the increasing the temperature and different for different frequencies as shown in Figure 5. The variation of the dielectric constant and the dielectric loss with temperature is large at lower frequencies. The temperature dependence of the dielectric constant (
 ) at various frequencies for the Se98Zn2 system indicates that the dispersion maybe occur above 350 K. From the Figure 6" target="_self"> Figure 6 the peaks have not been observed in the dielectric constant (
 ) and dielectric loss (
 ) vs. temperature curves for different fixed frequencies. The dielectric loss increases with temperature in the glassy system. The dielectric constant (
 ) for Se-Zn has a higher value as compared to a pure Se [18] and it has lower value as compared to a pure a-Se-Te, a-SeTe-Ga [19,20] etc. These results indicate that the concentration of Zn plays an important role in the variation of dielectric parameters with temperature and frequency. This type of behavior has also been reported by various workers in chalcogenide glasses [19,21,22].The same type of graphs are observed in other samples of Se-Zn.
The Figures 7 and 8 shows the variation of dielectric constant and dielectric loss with frequency at different fixed temperature for Se98Zn2. It is observed that the dielectric constant and the dielectric loss decrease with increase of frequency. The dielectric constant and the dielectric loss
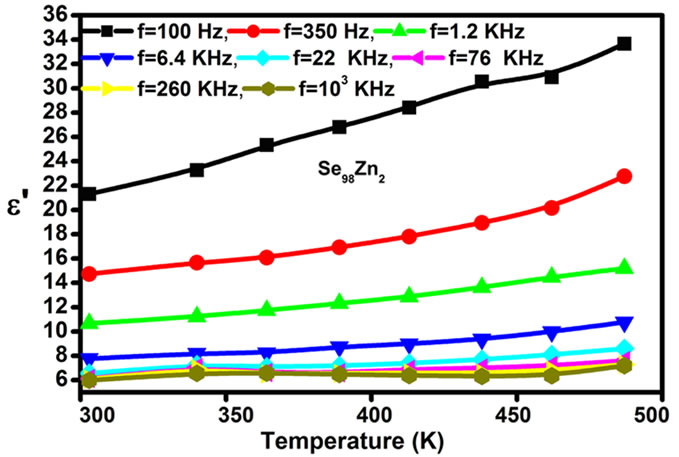
Figure 5. The plot of dielectric constant (ε') vs. Temperature at different frequency in the glassy Se98Zn2 alloy.
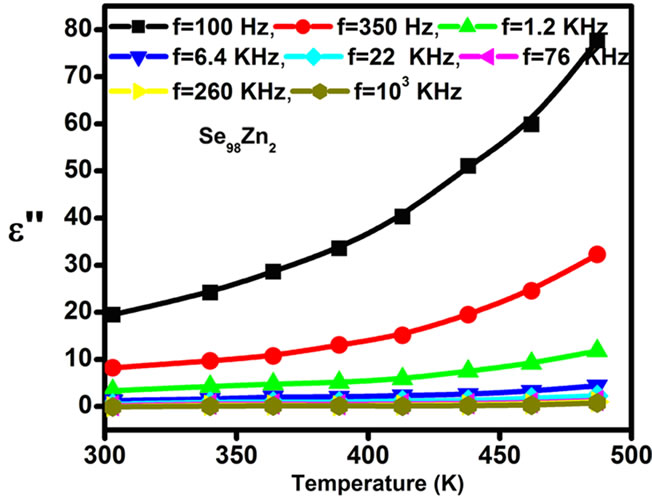
Figure 6. Dielectric loss (ε") vs. Temperature at different frequency in the glassy Se98Zn2 alloy.
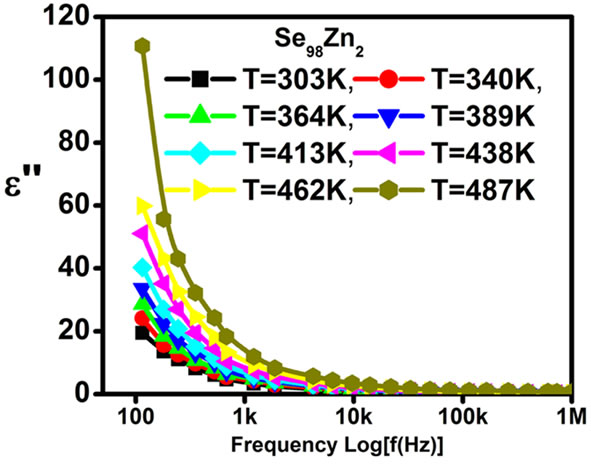
Figure 7. The plots dielectric constant (ε') and (b) dielectric loss (ε") vs. Log of frequency at different temperatures for the glassy Se98Zn2 System.
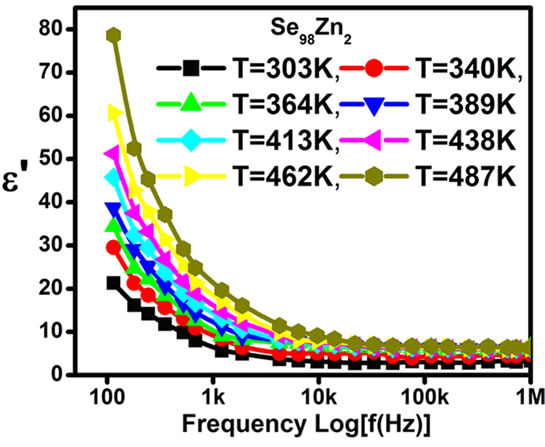
Figure 8. The plots dielectric loss (ε") vs. log of frequency at different temperatures for the Glassy Se98Zn2 System.
both increase with the increase of Zn concentration in Se100–xZnx as shown in Figure 9. The numerical values of dielectric constant and the dielectric loss are given in Table 1. The higher value of the dielectric constant and the dielectric loss are observed at 10% of Zn content. The temperature dependence of the dielectric constant ( ) at various frequencies for glassy Se100–xZnx alloys indicated that the ln
 versus 103/T plot is a straight line for all the samples as shown in Figure 10. This type of temperature dependence is generally observed in molecular solids where the Debye theory [23] for the viscosity dependence of relaxation time holds quite well. According to this theory, the dielectric constant (
 ) should increase exponentially with temperature, and such a relationship has been observed indeed for the present samples. The above discussion indicates that dipolar type dielectric dispersion is occurring in the present samples. However, no peaks have been observed in the dielectric loss (
 ) versus ln(f) curves in the present samples as expected in the case of dipolar-type relaxation. Guintini et al. [24] have proposed a dipolar model for dielectric dispersion in the glassy system. This model is based on Elliott’s idea [25] of hopping of charge carriers over a potential barrier between charged defect states D+ and D–. Each pair of sites D+ and D– is understood to form a dipole, which has a relaxation time depending on its activation energy [26,27],
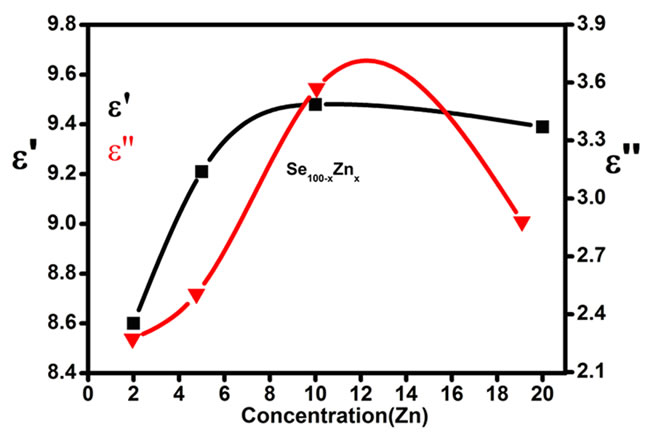
Figure 9. The variation of dielectric constant and dielectric loss with Zn concentration for Se98Zn2 system.
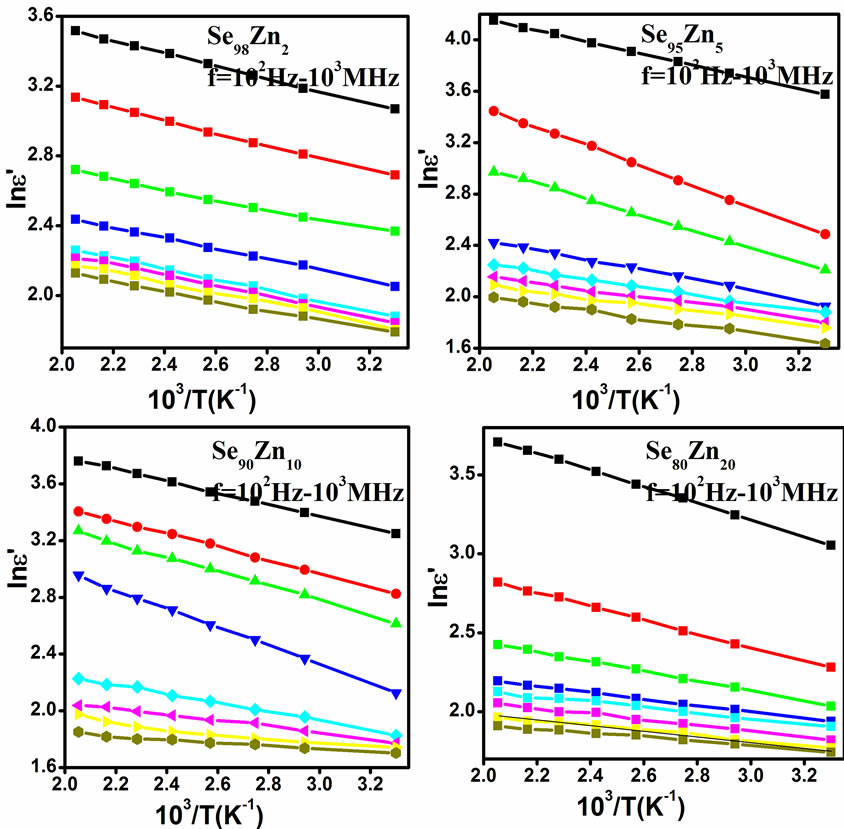
Figure 10. The plots of ln (ε") vs. 103/T at different temperature for all the samples of Se100–xZnx.
recognized to the existence of a potential barrier over which the carriers hopping occurs [28].
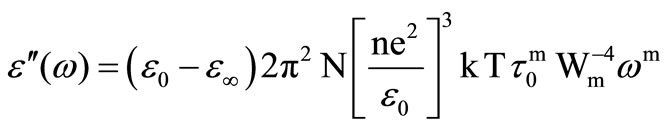
According to the above Guintini et al. [24] has also proposed a theory of dielectric loss ( ) at a particular frequency in the temperature range of the chalcogenide glasses where the dielectric dispersion occurs, leads to the relation
 (2)
(2)
Here, m is a power of angular frequency and is negative in this case and is given by
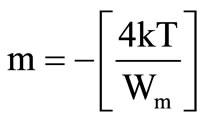 (3)
(3)
and where n is the number of electrons hop, N is the concentration of localized sites,  and
and  are the static and optical dielectric constants, respectively, Wm is the energy required to move the electron from a site to infinity. The dielectric loss in these glasses depends upon the total number of localized states. The frequency dependent of dielectric loss
  is shown in Figure 11 at different temperatures for the glassy Se100–xZnx alloy. From this figure, it is clear that
  is also found to decrease with increasing frequency and It is increases with increase the temperatures. The values of power (m) are calculated from the slopes of these straight lines from Figure 11. The values of m are negative and the magnitude of m decreases linearly with temperatures the figure is not given here. The numerical value of power (m) and energy required (Wm) are given in the Table 2 of the glassy Se100–xZnx alloy. The values of required energy (Wm) are increases with increase of temperature in the glassy .This is consistent with theory [24] of dielectric relaxation based on the hopping of charge carriers over a potential barrier as suggested by Elliott [25] is applicable in the case of the glassy Se100–xZnx alloy. Hence, the increase of the dielectric loss with the increase of zinc concentration indicates that the density of defects states decreases on addition of zinc in the Se-Zn binary system. Schottmiller et al. [13] studied the effect of various elements (S, Te, Bi, As and Ge) on the structure of glassy Se by infrared and Raman Spectroscopy. They reported that in glassy Se about 40% of the atoms have a ring structure and 60% of the atoms are bonded as polymeric chains. The conducting additive in a dielectric may have a very large effect on its electrical response. The presence of additive might increase the concentration of charge carriers and there may be a shift of the Fermi level [29,30]. It is usually assumed that the addition of zinc to the SeZn system leads to a cross linking of the Se-Zn chains, reducing the disorder in the system, which in turn may decrease the density of defect states. It has been shown by Goyal et al. [10] that spurious dielectric dispersion may appear in chalcogenide glasses, if there is a poor
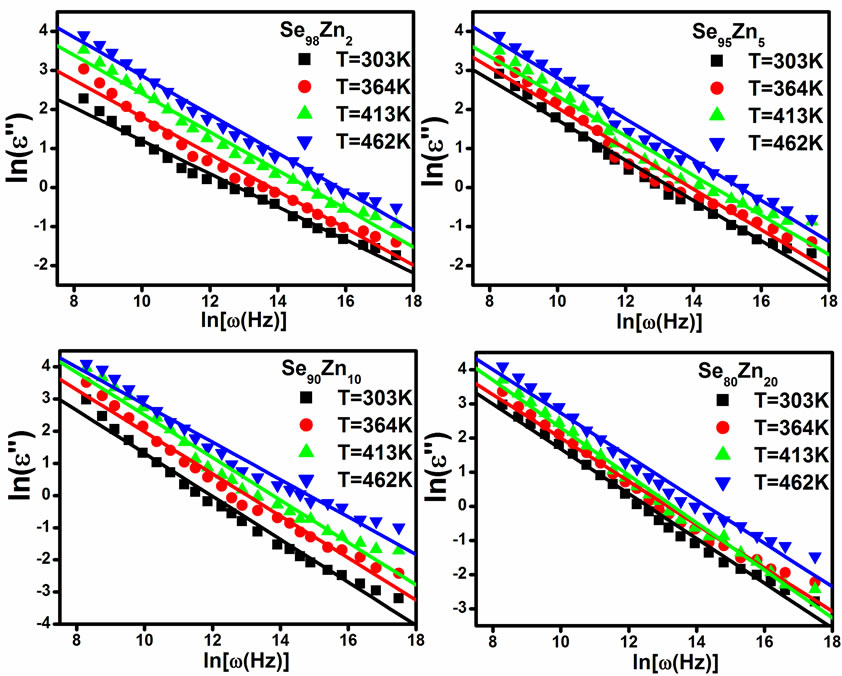
Figure 11. The plots of ln(ε") with ln(ω) at different fixed temperature for Se100–xZnx.
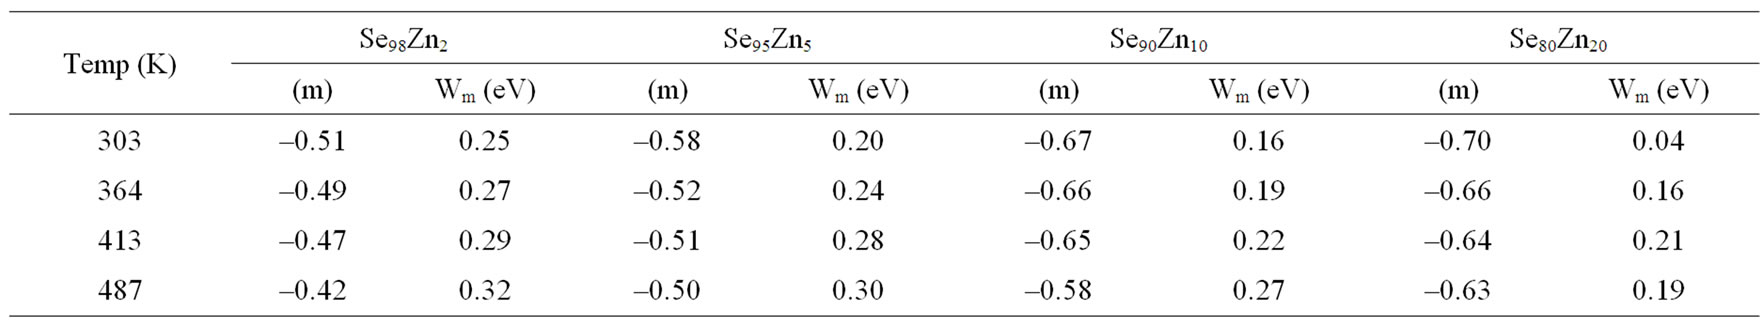
Table 2. Temperature dependence of slope (m) and (Wm) required energy for glassy Se100–xZnx alloy.
electric contact between sample and the electrodes. This is likely to occur in uncoated samples. To ensure that the measured capacitance and dissipation factor represent the values of bulk samples with different thickness. Temperature and frequency dependence of capacitance and dissipation factor have been measured simultaneously. It is found that the values of capacitance and dissipation factor are thickness dependent while the corresponding dielectric constant and dielectric loss are thickness independent. These results indicate that the electrode polarization effect does not exist in the present case. The DC conduction loss ( ) is also an important parameter to understand the dielectric dispersion in chalcogenide glasses. We have also calculated the DC conduction loss (
 ) using the following formula [20,30,31].
 (4)
(4)
where sDC is the DC conductivity. The calculated values of the DC conduction losses ( ) are shown in the Table 1. The Figure 12 shows the variation of the observed dielectric loss and the calculated DC conduction loss with temperature at fixed frequency for Se100–xZnx. The DC conduction losses are not dominated on observed dielectric loss because of the DC conduction loss is much smaller as compared to the observed dielectric loss. Hence, the dielectric loss cannot be attributed to the DC conduction in entire temperature range. However, the dielectric dispersion is due to the hopping of charge carriers over a potential barrier between the charged defect states D+ and
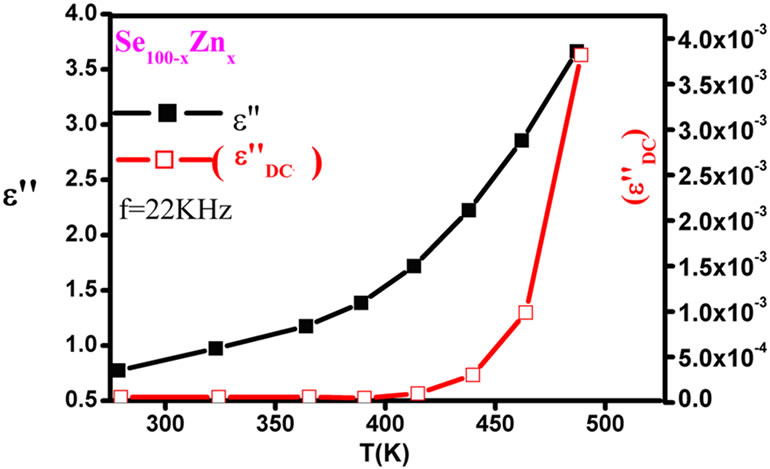
Figure 12.Variation of the observed dielectric loss (ε"), the DC conduction ( ) vs. temperatures at constant frequency 22 KHz for all the composition of ε" glassy system.
D– for Se100–xZnx sample. Thus, these results indicate that the observed dielectric dispersion is recognized mainly to dipolar type dispersion in the present Se100–xZnx system.
4. Conclusions
On the basis of XRD and SEM micrograph picture the crystallinity is increases, crystallize size and increases the numbers of nanocryst with increases of Zn concentration in Se-Zn glassy system. The DC conductivity (sDC) is decreases and activation energy (DE) are increases with increases Zn composition in the system. It may be due to incorporation of Zn concentration which decreases the defect states in the mobility gap as well as increase band gap in Se100–xZnx (2 ≤ x ≤ 20) system. The conduction is most likely in the localized state.
The dielectric dispersion is occurring as dipolar-type in present glassy alloys. Dielectric constant and dielectric loss increase with temperature and as well as increases with increase of Zn content. The dielectric parameters with Zinc can be understood in terms of decrease the density of defect states on adding Zn content and increase the band gap in Se-Zn system. A detailed analysis also suggested the possibility of dipolar type relaxation in the glassy Se100–xZnx alloy, after the incorporation of Zn. A possible explanation is given in terms of hopping of charge carriers over a potential barrier between charged defect states. The potential barrier is increases with the concentration of zinc due to increases of activation energy in the system.
REFERENCES
- E. Maruyama, “Amorphous Built-in-Field Effect Photoreceptors,” Japanese Journal of Applied Physics, Vol. 21, No. 2, 1982, pp. 213-223. doi:10.1143/JJAP.21.213
- D. C. Hunt, S. S .Kirby and J. A .Rowland, “X-Ray Imaging with Amorphous Selenium: X-Ray to Charge Conversion Gain and avalanche Multiplication Gain,” Medical Physics, Vol. 9, No. 11, 2002, pp. 2459-2464.
- S. O. Kasap, “Imaging Materials,” Marcel Dekker, New York, 1991, pp. 350-355.
- V. I. Mikla, Yu. Nagy, V. V. Mikla and A. V. Mateleshko, “The Effect of Sb Alloying on the Electro Photographic Properties of Amorphous Selenium,” Materials Science and Engineering B, Vol. 64, No.1, 1999, pp. 1-8.
- N. Chaudhary and A. Kumar, “Dielectric Relaxation in Glassy Se100–xSbx,” Turkish Journal of Physics, Vol. 29, No. 3, 2005, pp. 119-125.
- K. W. Boer and S. R. Ovshinsky, “Electrothermal Initiation of an Electronic Switching Mechanism in Semiconducting Glasses,” Journal of Applied Physics, Vol. 41, No. 6, 1970, pp. 2675-2681. doi:10.1063/1.1659281
- F. M. Collins, “Switching by Thermal Avalanche in Semiconducting Glass Film,” Journal of Non-Crystalline Solids, Vol. 2, 1970, pp. 496-503. doi:10.1016/0022-3093(70)90163-8
- N. F. Mott and E. A. Davis, “Conduction in Non-Crystalline systems,” Philosophical Magazine, Vol. 22 No. 179, 1970, pp. 903-922.
- M. Kastner and H. Fritzsche, “Defect Chemistry of LonePair Semiconductors,” Philosophical Magazine Part B, Vol. 37, No. 2, 1978, pp. 199-215. doi:10.1080/01418637808226653
- D. R. Goyal, S. Walker and K. K. Srivastava, “Errors Due to Lack of Contact in Measurements of Dielectric Relaxation Parameters for Solid Powders,” Physica Status Solidi (a), Vol. 64, No. 1, 1981, pp. 351-357. doi:10.1002/pssa.2210640138
- M. Kitao, K. Yoshii and S. Yamada, “Thermoelectric Power of Glassy As40Se60–xTex,” Physica Status Solidi (a), Vol. 91, No. 1, 1985, pp. 271-277. doi:10.1002/pssa.2210910133
- A. B. Gadkari and J. K. Zope, “Electrical Properties of Amorphous Semiconducting Se-Te-In System,” Journal of Non-Crystalline Solids, Vol. 103, No. 2-3, 1988, pp. 295-299. doi:10.1016/0022-3093(88)90208-6
- N. F. Mott, “Conduction in Non-Crystalline Systems IV. Anderson Localization in a Disordered Lattice,” Philosophical Magazine, Vol. 22, No. 175, 1970, pp. 7-29. doi:10.1080/14786437008228147
- S. Kumar, R. Arora and A. Kumar, “Space Charge Limited Conduction in a-Ge22Se68M10 (M = Cd, ln, Pb, Te),” Journal of Electronic Materials, Vol. 22, No. 6, 1993, pp. 675-679. doi:10.1007/BF02666416
- R. Mach, P. Flgel and L. G. Suslina, “The Influence of Compositional Disorder on Electrical and Optical Properties of ZnSxSe1−x Single Crystals,” Physica Status Solidi (b), Vol. 109, No. 2, 1982, pp. 607-615. doi:10.1002/pssb.2221090219
- H. Mitsubas, I. Mituishi and M. Mizuta, “Coherent Growth of ZnSe on GaAs by MOCVD,” Japanese Journal of Applied Physics, Vol. 24, 1985, pp. 578-580.
- J. Schottmiller, M. Tabak, G. Lucovsky and A. Ward, “The Effect of Valency on Transport Properties in Vitreous Binary Alloys of Selenium,” Journal of Non-Crystalline Solids, Vol. 4, 1970, pp. 80-96. doi:10.1016/0022-3093(70)90024-4
- N. Musahwar, M. A. Majeed Khan, M. Husain and M. Zulfequar, “Dielectric and Electrical Properties of Se-S Glassy Alloys,” Physica B, Vol. 396, No. 1-2, 2007, pp. 81-86. doi:10.1016/j.physb.2007.03.014
- S Kumar, M. Husain and M. Zulfequar, “Effect of Silver on Dielectric Properties of the Se-Te System,” Physica B, Vol. 371, No. 2, 2006, pp. 193-198. doi:10.1016/j.physb.2005.09.021
- S. Kumar, M. Husain and M. Zulfequar, “Dielectric Relaxation in the Glassy a-Se-Te-Ga system,” Physica B, Vol. 387, No. 1-2, 2007, pp. 400-408. doi:10.1016/j.physb.2006.04.036
- M. Ilyas, M. Zulfequar and M. Husain, “Anomalous Dielectric Behaviour in a-GaxTe100–x Alloys (0 £ x £ 10),” Physica B, Vol. 271, No. 1-4, 1999, pp. 125-135. doi:10.1016/S0921-4526(99)00221-5
- R. S. Kundu, K. L. Bhatia, N. Kishore and P. Singh, “Effect of Addition of Zn Impurities on the Electronic Conduction in Semiconducting Se80−xTe20Znx Glasses,” Philosophical Magazine Part B, Vol. 72, No. 5, 1995, pp. 513-528.
- R. Arora and A. Kumar, “Dielectric Relaxation in Glassy Se and Se100–xTex Alloys,” Physica Status Solidi (a), Vol. 115, No. 1, 1989, pp. 307-314. doi:10.1002/pssa.2211150135
- J. C. Guintini, J. V. Zanchetta, D. Jullien, R. Eholie and P. Houenou, “Temperature Dependence of Dielectric Losses in Chalcogenide Glasses,” Journal of Non-Crystalline Solids, Vol. 45, No. 1, 1981, pp. 57-62. doi:10.1016/0022-3093(81)90089-2
- S. R. Elliott, “A Theory of a.c. conduction in Chalcogenide Glasses,” Philosophical Magazine, Vol. 36, No .6, 1977, pp. 1291-1304.
- A. E. Stern and H. Eyring, “The Deduction of Reaction Mechanisms from the Theory of Absolute Rates,” Journal of Chemical Physics, Vol. 5, No. 2, 1937, pp. 113-113. doi:10.1063/1.1749988
- S. Glasstone, K. J. Laidler and H. Eyring, “Theory of Rate Processes,” McGraw Hill, New York, 1941.
- P. Pollak and G. E. Pike, “A General Treatment of 1-Dimensional Hopping Conduction,” Physical Review Letters, Vol. 28, No. 28, 1972, pp. 1449-14450. doi:10.1103/PhysRevLett.28.1449
- M. M. Malik, M. Zulfequar, A. Kumar and M. Husain, “Effect of Indium Impurities on the Electrical Properties of Amorphous Ga30Se70,” Journal of Physics: Condensed Matter, Vol. 4, No. 43, 1992, pp. 8331-8338. doi:10.1088/0953-8984/4/43/008
- M. Zulfequar, A. Kumar, “Dielectric Behavior of HotPressed AIN Ceramic: Effect of CaO Additive,” Journal of Electrochemical Society, Vol. 136, No. 4, 1989, pp. 1099-1102. doi:10.1149/1.2096792
- M. Zulfequar and A. Kumar, “Electrical Conductivity and Dielectric Behavior of Hot-Pressed AlN,” Advanced Ceramic Matter, Vol. 3, No. 4, 1988, pp. 332-336.