Open Journal of Medicinal Chemistry
Vol.08 No.02(2018), Article ID:85108,7 pages
10.4236/ojmc.2018.82002
Determination of Azacitidine by Spectrophotometric Method
B. Ramachandra1, N. Venkatasubba Naidu2
1Department of Chemistry, Annamacharya Institute of Technology and Sciences, Tirupati, India
2Department of Chemistry, S. V. University, Tirupati, India

Copyright © 2018 by authors and Scientific Research Publishing Inc.
This work is licensed under the Creative Commons Attribution International License (CC BY 4.0).
http://creativecommons.org/licenses/by/4.0/


Received: February 20, 2018; Accepted: June 3, 2018; Published: June 6, 2018
ABSTRACT
Simple, selective and sensitive spectrophotometric method has been developed for the determination of Azacitidine in pharmaceutical formulations and blood with MBTH (3-methyl-2-benzothiazolone hydrazone hydrochloride) reagent, at PH_4.0 which is extractable at 620 nm. Beer’s law is obeying in the concentration ranges 10 - 35 µg∙ml−1 for formulations and 4 - 24 µg∙ml−1 for blood sample. %R.S.D was found to be 0.0240%, 0.0610 and Recovery 99.82% 99.24% respectively. The method was completely validated and proven to be rugged. The interferences of the other ingredients and excipients were not observed. The repeatability and the performance of the proven method were conventional by point and interior proposition and through recovery studies.
Keywords:
UV-Visible Spectrophotometry, Azacitidine, Blood Sample, MBTH/FeCl3 and Oxidative Coupling Reaction

1. Introduction
Azacitidine is a pyrimidine nucleoside analog of cytidine. An antitumor nucleoside approves by FDA for the action of myelodysplastic disorder [1] . It is chemically 4-amino-1-[(2R,3R,4S,5R)-3,4-dihydroxy-5-(hydroxymethyl)oxolan-2-yl]-1,2-dihydro-1,3,5-triazin-2-one (Figure 1) with molecular weight of 244.205 g/mol. Clinically, it has also verified activity against various solid tumors as well as leukemia [2] . Potential combinations include use of a hypomethylating agent with histone deacetylase inhibitors, such as phenyl butyrate [3] [4] . The literature survey exposed that Azacitidine was determined by Liquid chromatography-mass spectrometry [5] [6] , HPLC [7] [8] , instrumental methods and spectrophotometric method using oxidative coupling reaction [9] [10] [11] . At

Figure 1. Chemical structure of Azacitidine.
present, the authors have proposed three simple UV Spectrophotometric methods for the analysis of Azacitidine in tablets and validated as per ICH guidelines [12] .
2. Materials and Methods
UV-VIS spectrophotometer (UV-1800 Shimandzu, North America) connected to computer loaded with spectra manager software vision light was employed with spectral bandwidth of 1 nm and wavelength accuracy of ±0.3 nm with a pair of 10 mm matched quartz cells. For scanning, the wavelength range selected was 400 nm to 200 nm with medium scanning speed. All weights were taken using electronic balance (Denver, Germany). All experiments were performed at room temperature (25 ± 1)˚C. The pure samples were collected from Analog labs, Hyderabad, India for providing the drug samples.
2.1. Preparation of Stock and Sample Solution
Azacitidine was obtained as gift sample from analog labs Hyderabad, India. Azacitidine stock was prepared by dissolving 100 mg in 100 ml of methanol (1000 µg∙ml−1). 10 ml of aliquot was taken into a 100 ml of volumetric flask and made up to the mark with methanol. (100 µg∙ml−1). Samples of aforesaid solutions ranging from 1 - 3.5 ml (10 - 35 µg∙ml−1) were transferred in to 10 ml volumetric flasks. 1 ml of (0.5%) MBTH solution was added followed by 1 ml of (0.7%) Ferric chloride solution and then to each flask made up to the mark with acetonitrile. The resulting solutions were heated and finally 1 ml (0.5 N) hydrochloric acid solution was added. The solutions were cooled to room temperature and made up to the mark with methanol. The color species was stable for 32 h. The absorbance of green colored chromogen was measured at 620 nm against the reagent blank. The amount of azacitidine present in the sample solution was computed from its calibration curve.
2.2. Procedure for Blood Sample
Blood samples collected were centrifuged. To isolate Azacitidine from plasma, methanol was used for protein precipitation. Liquid-Liquid extraction was performed with plasma by alkalinization with 1 M NaOH (sodium hydroxide), using by extraction with 30% dichloromethane in hexane. The upper organic layer was evaporated to dryness. The dry residue of 100 mg was dissolved in 100 ml of methanol (1000 µg∙ml−1). 10 ml of aliquot was taken into a 100 ml of volumetric flask and made up to the mark with methanol. (100 µg∙ml−1). The samples of aforesaid solutions ranging from 0.4 - 2.4 ml (4 - 24 µg∙ml−1) were transferred in to 10 ml volumetric flasks. 1 ml of (0.5%) MBTH solution was added followed by 1 ml of (0.7%) Ferric chloride solution and then to each flask made up to the mark with acetonitrile. The resulting solutions were heated and finally 1 ml (0.5 N) hydrochloric acid solution was added. The solutions were cooled to room temperature and made up to the mark with methanol. The color species was stable for 32 h. The absorbance of green colored chromogen was measured at 620 nm against the reagent blank. The amount of azacitidine present in the sample solution was computed from its calibration curve.
3. Procedure
Linearity of the method was established by preparing a calibration curve. For this a series of drug solutions were prepared 10 - 35 µg∙ml−1 scanned (400 - 800 nm) against their reagent blank. The functional group used for the color development for this method was primary amine group. A schematic reaction mechanism of azacitidine with MBTH reagent was shown in Scheme 1. The absorption spectrum was recorded and shows minima at 620 nm therefore the amplitude was chosen for all the analytical determinations in this method. The precision study was done by recording the absorbance of six replicates for the proposed method. (20 µg∙ml−1) and the %RSD was calculated. Accuracy was
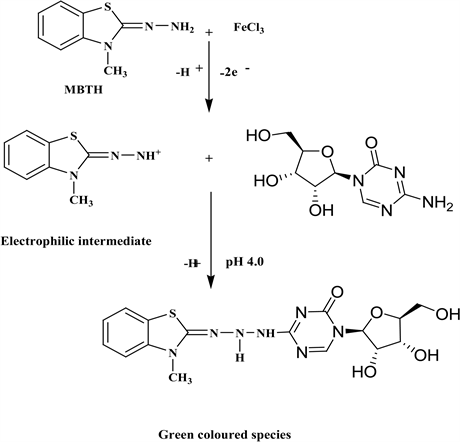
Scheme 1. Schematic reaction mechanism of Azacitidine with MBTH/FeCl3.
evaluated from the percent recovery studies by the addition of 80%, 100% and 120% of pure sample solution to the pre-analyzed formulation solution. Azacitidine drug solution from the formulation (10 µg∙ml−1) was spiked with 80%, 100% and 120% of pure API solution and the % recovery was calculated.
4. Results and Discussion
The absorption spectrum of Azacitidine was shown in Figure 2 indicating absorption wavelength 620 nm. A graph was drawn by taking the concentration on the x-axis and the corresponding absorbance on the y-axis for the data obtained in this method, Beer-Lambert’s law was obeyed over the concentration ranges 10 - 35 µg∙ml−1 for formulations and 4 - 24 µg∙ml−1 for blood samples groups were shown in (Figure 3 & Figure 4). The linear regression equations for the method was found to be y = 0.04114 × 0.002658, R2 = 0.9992. The %RSD in precision and accuracy studies was found to be less than 2%. This method was indicating

Figure 2. Absorption spectrum of Azacitidine with MBTH/FeCl3.

Figure 3. Beer’s law plot of Azacitidine with MBTH/FeCl3.
that the method was more precise and accurate. The optical characteristics were shown in Table 1. The % recovery was 99.82 in formulations and 99.24 in blood samples and the result are given in Tables 2-4.
5. Conclusion
The method is found to be accurate and precise, as indicated by recovery studies close to 100 and % RSD is not more than 2. The summery of validation parameters of proposed UV-Visible spectrophotometric method is given. The proposed UV-Visible spectrophotometric method used for the determination of azacitidine as bulk, Commercial samples and blood samples has been developed. The

Figure 4. Beer’s law plot of Azacitidine with MBTH in Blood sample.

Table 1. Optical characteristics of Azacitidine.
% RSD of six independent determinations.
Table 2. Assay results of Azacitidine in formulations and Blood samples by visible Method.
T and F-values refer to comparison of the proposed method with reference method; Theoretical values at 95% confidence limits t= 0.00297 and F = 5.9177 (Formulations); Theoretical values at 95% confidence limits t = 0.00269 and F = 5.6976 (Blood samples).
Table 3. Determination of accuracy of Azacitidine.
Table 4. Determination of accuracy of Azacitidine.
method may be recommended for routine and quality control analysis of the investigated pure in bulk and blood samples. The analytical solution is found to be stable up to 32 Hrs at room temperature. Hence, it is concluded that the analytical method is validated and can be used for routine analysis.
Acknowledgements
The authors are grateful to Annamacharya Institute of Technology and Sciences, Tirupati-517520.A.P., India for providing necessary research facilities and to Analog labs Hyderabad, India for providing the drug samples.
Cite this paper
Ramachandra, B. and Naidu, N.V. (2018) Determination of Azacitidine by Spectrophotometric Method. Open Journal of Medicinal Chemistry, 8, 15-21. https://doi.org/10.4236/ojmc.2018.82002
References
- 1. Cihak, A. (1974) Biological Effects of 5-Azacytidine in Eukaryotes. Oncology, 30, 405-422. https://doi.org/10.1159/000224981
- 2. McCredie, B., Bodey, G.P., Burgess, M.A., Gutterman, J.U., Kodriguez, V., Sullivan, M. and Freireich, E. (1973) Treatment of Acute Leukemia with 5-Azacytidine (NSC-102816). Cancer Chemotherapy Reports, 57, 319-323.
- 3. Zhu, W.G., Lakshmanan, R.R., Beal, M.D. and Otterson, G.A. (2001) DNA Methyl Transferase Inhibition Enhances Apoptosis Induced by Histone Deacetylase Inhibitors. Cancer Research, 61, 1327-1333.
- 4. Cameron, E.E., Bachman, K.E., Myohanen, S., Herman, J.G. and Baylin, S.B. (1999) Synergy of Demethylation and Histone Deacetylase Inhibition in the Re-Expression of Genes Silenced in Cancer. Nature Genetics, 21, 103-107.
- 5. Satyanarayana Raju, T., Kalyanaraman, L., Raghavachary, K.S.V. and Yadagiri Swamy, P. (2012) A Novel Normal Phase HPLC Method for the Quantification of N-Formyl Impurity in Azacitidine Active Pharmaceutical Ingredients and Pharmaceutical Dosage Forms. Journal of Liquid Chromatography & Related Technologies, 35, 1070-1080.
- 6. Zhao, M., Rudek, M.A., He, P., Hartke, C., Gore, S., Carducci, M.A. and Baker, S.D. (2004) Quantification of 5-Azacytidine in Plasma by Electrospray Tandem Mass Spectrometry Coupled with High-Performance Liquid Chromatography. Journal of Chromatography B, 813, 81-88.
- 7. Kissinger, L.D. and Stemm, N.L. (1986) Determination of the Antileukemia Agents Cytarabine and Azacitidine and Their Respective Degradation Products by High-Performance Liquid Chromatography. Journal of Chromatography A, 353, 309-318. https://doi.org/10.1016/S0021-9673(01)87101-6
- 8. Chan, K.K., Giannini, D.D., Staroscik, J.A. and Sadee, W. (1979) 5-Azacytidine Hydrolysis Kinetics Measured by High-Pressure Liquid Chromatography and 13C-NMR Spectroscopy. Journal of Pharmaceutical Sciences, 68, 807-812. https://doi.org/10.1002/jps.2600680705
- 9. Chatwal, G.R. and Anand, S.K.J. (2003) Instrumental Methods of Chemical Analysis. Himalaya Publishing House, Mumbai, 2.108-2.109.
- 10. Harris, D.C. (2003) Quantitative Chemical Analysis. 6th Edition, W. H. Freeman. 258-261.
- 11. Sastry, C.S.P. and Rao, K.R. (2003) Determination of Cefadroxil by Tree Simple Spectrophotometric Method Using Oxidative Coupling Reaction. Microchimica Acta, 126, 167-172. https://doi.org/10.1007/BF01242680
- 12. (2005) International Conference on Harmonization of Technical Requirements for the Registration of Pharmaceutical for Human Use: Validation of Analytical Procedures, Text and Methodolo-gy-Q2-R1.