Open Journal of Radiology
Vol.4 No.1(2014), Article ID:42948,8 pages DOI:10.4236/ojrad.2014.41001
The Detectability for the Myocardial Fibrosis by Tagging Imaging on Cardiovascular Magnetic Resonance
Atsushi K. Kono1*, Pierre Croisille2, Tatsuya Nishii3, Katsusuke Kyotani4, Koya Nishiyama4, Mayumi Shigeru5, Sachiko Takamine5, Sei Fujiwara5, Kazuro Sugimura3
1Department of Radiology, Kobe University Hospital, Kobe, Japan
2Department of Radiology, Université Jean Monnet Saint-Etienne, Lyon, France
3Department of Radiology, Kobe University Graduate School of Medicine, Kobe, Japan
4Division of Radiology, Kobe University Hospital, Kobe, Japan
5Division of Cardiovascular and Respiratory Medicine, Department of Internal Medicine, Kobe University Graduate School of Medicine, Kobe, Japan
Email: *ringonotegami@mac.com
Copyright © 2014 by authors and Scientific Research Publishing Inc.
This work is licensed under the Creative Commons Attribution International License (CC BY).
http://creativecommons.org/licenses/by/4.0/


Received 10 December 2013; revised 10 January 2014; accepted 17 January 2014
ABSTRACT
Purpose: Myocardial fibrosis causes cardiac dysfunction, arrhythmias, and sudden death. Tagging imaging on cardiovascular MR can measure the intra-myocardial motion from the dynamic deformation of lines superimposed on the myocardium. The purpose of this study was to evaluate the detectability of myocardial fibrosis using tagging imaging and to compare this with conventional cine imaging. Materials and Methods: We reviewed 4 normal control (NML) subjects, 4 patients with myocarditis (MYO), and 4 patients with old myocardial infarction (ICM). We measured circumferential strain (Ecc) from tagging imaging, and regional wall thickening (rWT) from cine imaging. Fibrosis was determined from a late gadolinium enhancement (LGE) image. We evaluate diagnostic performance by comparing values of the area under curve (AUC) using ROC analysis. Results: Mean values of Ecc and rWT decreased in the area of LGE both in MYO and ICM patients. AUC values of Ecc and rWT in all subjects were 0.98 and 0.84, respectively (p < 0.0001). These values in MYO patients were 0.95 and 0.72 (p = 0.007), respectively, and 0.99 and 0.75, respectively, in ICM patients (p = 0.0008). Conclusions: Both Ecc and rWT decreased in the area with fibrosis in the patients with MYO and ICM. Tagging imaging showed better detectability of myocardial fibrosis than did cine imaging.
Keywords:Tagging Imaging; Late Gadolinium Enhancement; Myocardial Fibrosis; Cardiovascular Magnetic Resonance

1. Introduction
Cardiovascular Magnetic Resonance (CMR) can provide three-dimensional analysis of global and regional cardiac function with great accuracy and reproducibility. The current cine imaging with a steady-state free precession (SSFP) pulse sequence has great image quality and spatial resolution as well as temporal resolution. The conventional analysis of left ventricular (LV) function is based on tracing the contour on cine imaging, and provides information such as wall motion and wall thickening. Cine imaging using the Simpson technique on CMR has been evaluated and is considered the most accurate technique for the evaluation of cardiac function when compared to other imaging techniques such as ultrasonography, left ventriculography, and single photon emission computed tomography (SPECT) [1] -[4] .
Tagging Imaging on CMR evaluates the dynamic deformation of lines or grids superimposed on the myocardium during the cardiac cycle. Radial, circumferential, and longitudinal movement of the myocardium, as well as torsion and rotation of the heart, can be evaluated qualitatively and quantitatively from tagging imaging. Strain, which is expressed as the fractional change in length from the resting state to the contractile state, can also be measured [5] . Since Zerhouni et al. [6] first introduced tagging imaging, some reports have reported the usefulness of tagging imaging in myocardial diseases such as ischemic heart disease [7] -[9] . Tagging imaging is considered sensitive for detecting myocardial infarction.
Late gadolinium enhancement (LGE) imaging, which is obtained 5 - 10 minutes after the administration of contrast agent, can detect myocardial fibrosis. The correlation between the area of enhancement and fibrosis has been pathologically confirmed [10] and LGE imaging is now widely accepted in the clinical setting. However, because a contrast agent is needed for this technique, acquisition of LGE is sometimes difficult when the patients have renal insufficiency. Although tagging imaging has been reported as useful for the detection of myocardial infarction, its usefulness in detecting myocardial fibrosis has not been established. If tagging imaging is sensitive to fibrosis, this would help in the detection of fibrosis even in cases of renal insufficiency. The purpose of this study is to evaluate the detectability of myocardial fibrosis by tagging imaging, and to compare its effectiveness with that of conventional cine imaging.
2. Materials and Methods
Our institutional review board approved this retrospective study and waived written informed consent for the use of both their clinical and imaging data.
2.1. Population
We selected 12 subjects (mean age 48.3 ± 22.1 years; male, 10; female, 2), including 4 normal controls (NML), 4 myocarditis (MYO) patients, and 4 old myocardial infarction (ICM) patients. The diagnosis of each group was made by cardiologists (MS and ST) on the basis of clinical information, electrocardiography, echocardiography, angiography, and nuclear medicine, as well as myocardial biopsy if needed. The NML subjects had no abnormal findings in all examinations although their MRI tests were performed because of their clinical needs. We excluded patients who showed arrhythmia, congenital heart disease, heavy alcohol consumption, adriamycin treatment, muscle disorders such as myositis or muscular dystrophy, and general contraindications for CMR and contrast material.
2.2. Imaging Technique
We used a 1.5-T scanner (Achieva; Philips Healthcare, Best, The Netherlands) with a 5-channel cardiac coil. We acquired cine imaging, tagging imaging, and LGE in clinical setting using a standard protocol. We used a constant level appearance algorithm (CLEAR), which is a homogeneity correction to compensate for signal inhomogeneity attributable to the surface coils.
2.2.1. Cine Imaging
A total of 12 - 15 short-axis cine images, which covered the entire ventricles, were obtained with 8mm thickness and 2mm gaps. We also took 2- and 4-chamber long-axis cine images. The parameters for cine imaging were: steady-state free precession (SSFP) sequence (FOV, 380 mm; matrix, 179 ´ 160; echo time (TE), 1.3 - 1.5 ms; repetition time (TR), 2.5 - 2.9 ms automatically determined by MR computer; flip angle (FA), 60 degrees; band width (BW), 2123 Hz).
2.2.2. Tagging Imaging
A total of 3 short-axis images located at 25%, 50%, and 75% of the left ventricle were obtained, as well as 2- and 4-chamber long-axis images. Slice thickness was 7 mm. The cardiac phase was set at 21 phases. Tag spacing was 6 mm. The sequence was an echo-planar imaging (EPI) sequence with SPAMM. The parameters were: FOV, 250 mm; matrix, 176 ´ 176; TE, 4.0 ms; TR, 17ms automatically determined by MR computer; FA, 13 degree; and BW, 446 Hz.
2.2.3. Late Gadolinium Enhancement Imaging
LGE was performed 10 minutes after the administration of 0.1 mmol/kg of Gadolinium-DTPA (Magnevist, Bayer Schering Pharma AG, Berlin, Germany). LGE was obtained with a 3D segmented inversion recovery gradient echo sequence with 10 mm thickness and 5 mm overlap. (FOV, 350 mm; matrix, 179 ´ 256; TE, 1.35 ms; TR, 4.5 ms; FA, 15 degrees; BW, 261.9 Hz; parallel imaging factors, 2; stack, 2). The inversion time (TI) was adjusted to the normal myocardium using TI scout imaging.
2.3. Imaging Analysis
2.3.1. Regional Wall Thickening Analysis from Cine Imaging
We sent cine images to the commercial available workstation (ViewForum, Philips Healthcare, Best, The Netherlands). The slice at the mid-ventricle level was selected for the analysis and the myocardium of LV was divided uniformly into 12 segments. We manually measured regional wall thickness at both the diastolic phase and systolic phase, and calculated regional wall thickening (rWT) from the following equation: wall thickening = (thickness at systole − thickness at diastole)/thickness at systole.
2.3.2. Strain Analysis from Tagging Imaging
We sent tagging images to the open-source DICOM viewer Osirix v5 (Osirix Foundation, Geneva, Switzerland). The open software inTag (www.creatis.insa-lyon.fr/inTag/) was used to analyze tagging images. Motion estimation of this software is based on the Sine Wave Modeling approach [11] . Circumferential strain (Ecc) was calculated on the same slice and segments of the cine image. The definition of the anterior junction of both ventricles was set manually on the slice. Tracing the contour of the endomyocardium and epimyocardium was performed automatically. We did not divide the myocardial layers in this study (i.e., the number of myocardial layers was set at “1”).
2.3.3. Late Gadolinium Enhancement Analysis
LGE was defined as the area showed higher signal intensity (SI > mean + 2 SD) of the null myocardium. Each segment was classified into two groups (LGE-positive and LGE-negative) based on the consensus of two cardiovascular radiologists (AKK and TN). The slice and segments were the same as the cine image.
2.4. Statistical Analysis
Data are presented as means and standard deviations (SD) for continuous variables and as absolute numbers for categorical variables. We used analysis of variance (ANOVA) or the Welch test to compare continuous variables, and Fisher’s exact test to compare categorical variables. Statistical analysis of the data was conducted using JMP software (version 9.0, SAS Institute, Inc., Cary, NC). A P value < 0.05 was considered as statistically significant.
We evaluated the detectability of tagging imaging by constructing ROC curves of rWT and Ecc with the standard reference of LGE, and comparing the values of the area under the curve (AUC) between the MYO and ICM patients.
3. Results
Patient characteristics and CMR findings are summarized in Table 1. We excluded 3 segments from 144 seg

Table 1. Characteristics and MRI findings.
NML, normal control; MYO, the patients with myocarditis; ICM, the patients with old myocardial infarction; m, male; f, female; LVEF, left ventricular ejection fraction; LVEDV, left ventricular end-diastolic volume; LVESV, left ventricular end-systolic volume; LGE, late gadolinium enhancement.
ments because of artifacts, leaving a total of 141 segments that were analyzed. In total, 37 segments showed LGE; 0 showed NML, 13 showed MYO, and 24 showed ICM. In the MYO group, 1 patient showed linear LGE in the mid-layer of the myocardium, 1 showed endomyocardial LGE, and 2 showed epimyocardial LGE. In the ICM group, all patients showed transmural LGE at maximum. Representative images of LGE and tagging imaging are shown in Figure 1.
In all subjects, the mean and SD of Ecc and rWT were –17.4 ± 5.7 and 35.5% ± 16.0%, respectively, in LGE-negative patients and –2.8 ± 4.9 and 13.4% ± 14.7%, respectively, in LGE-positive patients. Bar graphs showing the differences in Ecc and rWT among NML, MYO, and ICM patients are shown in Figure 2. In NML subjects, the mean and SD of Ecc and rWT were –20.3 ± 4.5 and 42.4% ± 10.0%, respectively, and were –15.9 ± 5.4 and 34.5% ± 17.3%, respectively, in MYO patients and –3.8 ± 5.6 and 19.5% ± 16.6%, respectively, in the LGE-positive patients. In the ICM patients, the mean and SD of Ecc and rWT in LGE-negative patients were –14.2 ± 5.6 and 23.5% ± 17.1%, respectively, and –2.3 ± 4.5 and 10.2% ± 12.7%, respectively, in the LGE positive patients.
ROCs are shown in Figure 3. In all subjects, the values of AUC of rWT and Ecc were 0.84 and 0.98, respectively (P < 0.0001). The values of AUC of rWT and Ecc in MYO groups were 0.72 and 0.95, respectively (P = 0.007). The values of AUC of rWT and Ecc in ICM groups were 0.75 and 0.99, respectively (P = 0.0008).
4. Discussion
Tagging imaging was first reported in the late 1980s [6] , [12] . The line or grid is superimposed on the myocardium, and tracing its deformation provides the information of the intra-myocardial movement. Despite the long time that has passed since its initial reporting, tagging imaging has not become popular because analysis software is not yet available for the clinical setting. The easy, accurate, and highly reproducible cine imaging remains widely accepted in clinical settings, event though tracing the contour of the myocardium only provides its contractile function. In contrast, tagging imaging can provide radial, circumferential, and longitudinal movement of the myocardium as well as torsion or rotation of the heart [13] . Thus, tagging imaging can be viewed as a noninvasive technique for quantitative measurement of the three-dimensional motion and deformation of the myocardium. The usefulness of tagging imaging for the differentiation of the viable from the nonviable myocardium was reported for canine infarcts in the late 1990s [7] . Subsequently, this technique was used in human patients with myocardial infarctions [8] .
Myocardial fibrosis occurs after infarction or severe inflammation, while the presence of fibrosis decreases cardiac function and serves a substrate for several arrhythmias. Therefore, finding myocardial fibrosis is important for diagnosis and risk stratification. The LGE technique is now widely used for the detection of fibrosis, and the area of LGE on CMR correlates pathologic fibrosis [14] . However, the LGE technique requires the administration of a gadolinium agent. Our results showed that the value of Ecc decreased significantly in the LGE-positive segments in both the MYO and ICM patients. We believe that tagging imaging was sensitive for detecting myocardial fibrosis. Although we adopted segment-based analysis, MR equipment with recent image processing capabilities now can obtain a strain map showing the strain values on each pixel. Therefore, the possibility of a more detailed analysis on a per pixel basis is anticipated.
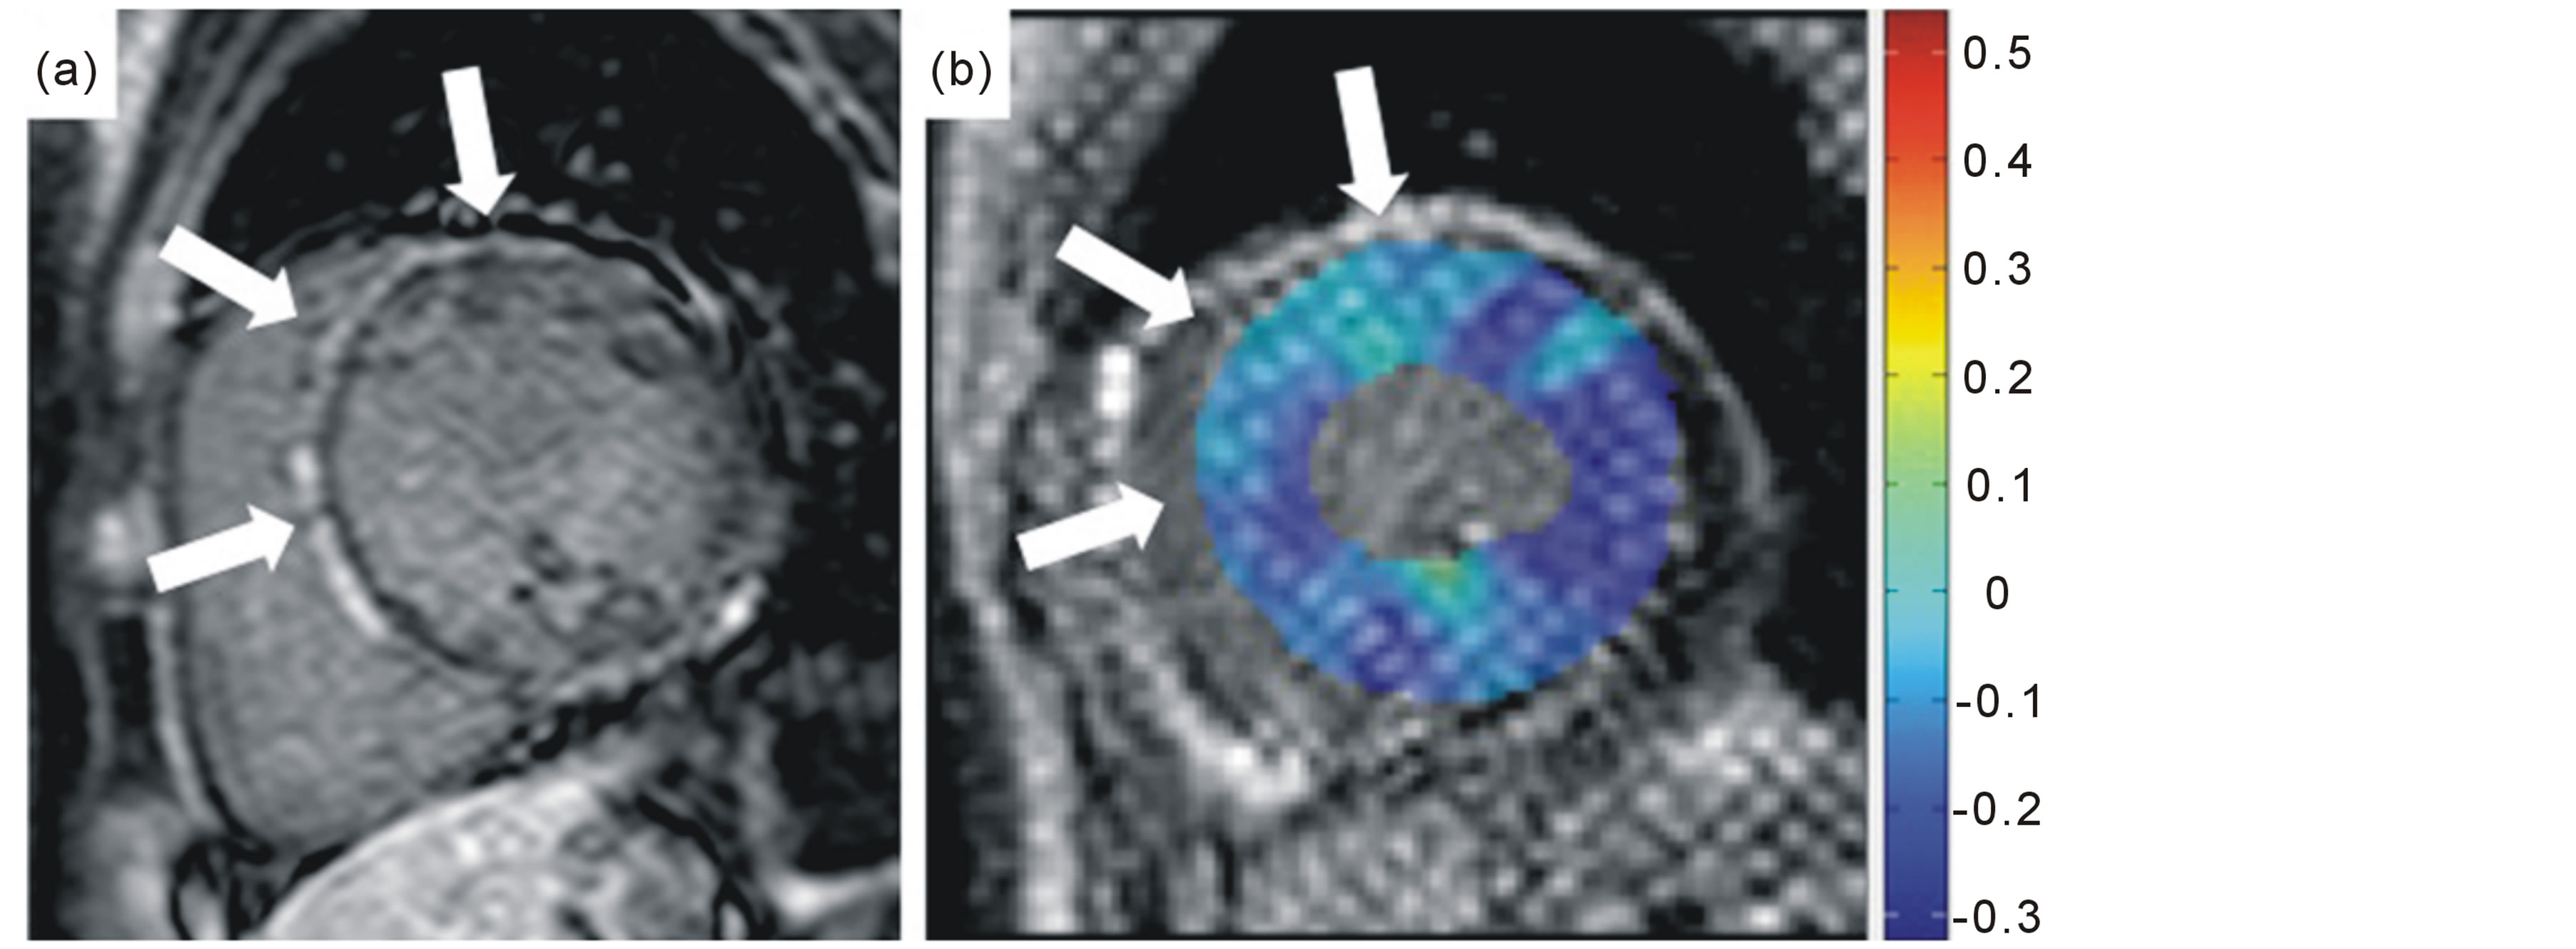
Figure 1. Representative images of a 34-year-old male with myocarditis. The late gadolinium enhancement image (a) shows epimyocardial enhancement (white arrows) in the anterior and septal wall. Circumferential strain decreases in the same wall on tagging imaging (b), shown as light blue color (white arrows), compared to the lateral wall as deep blue color.
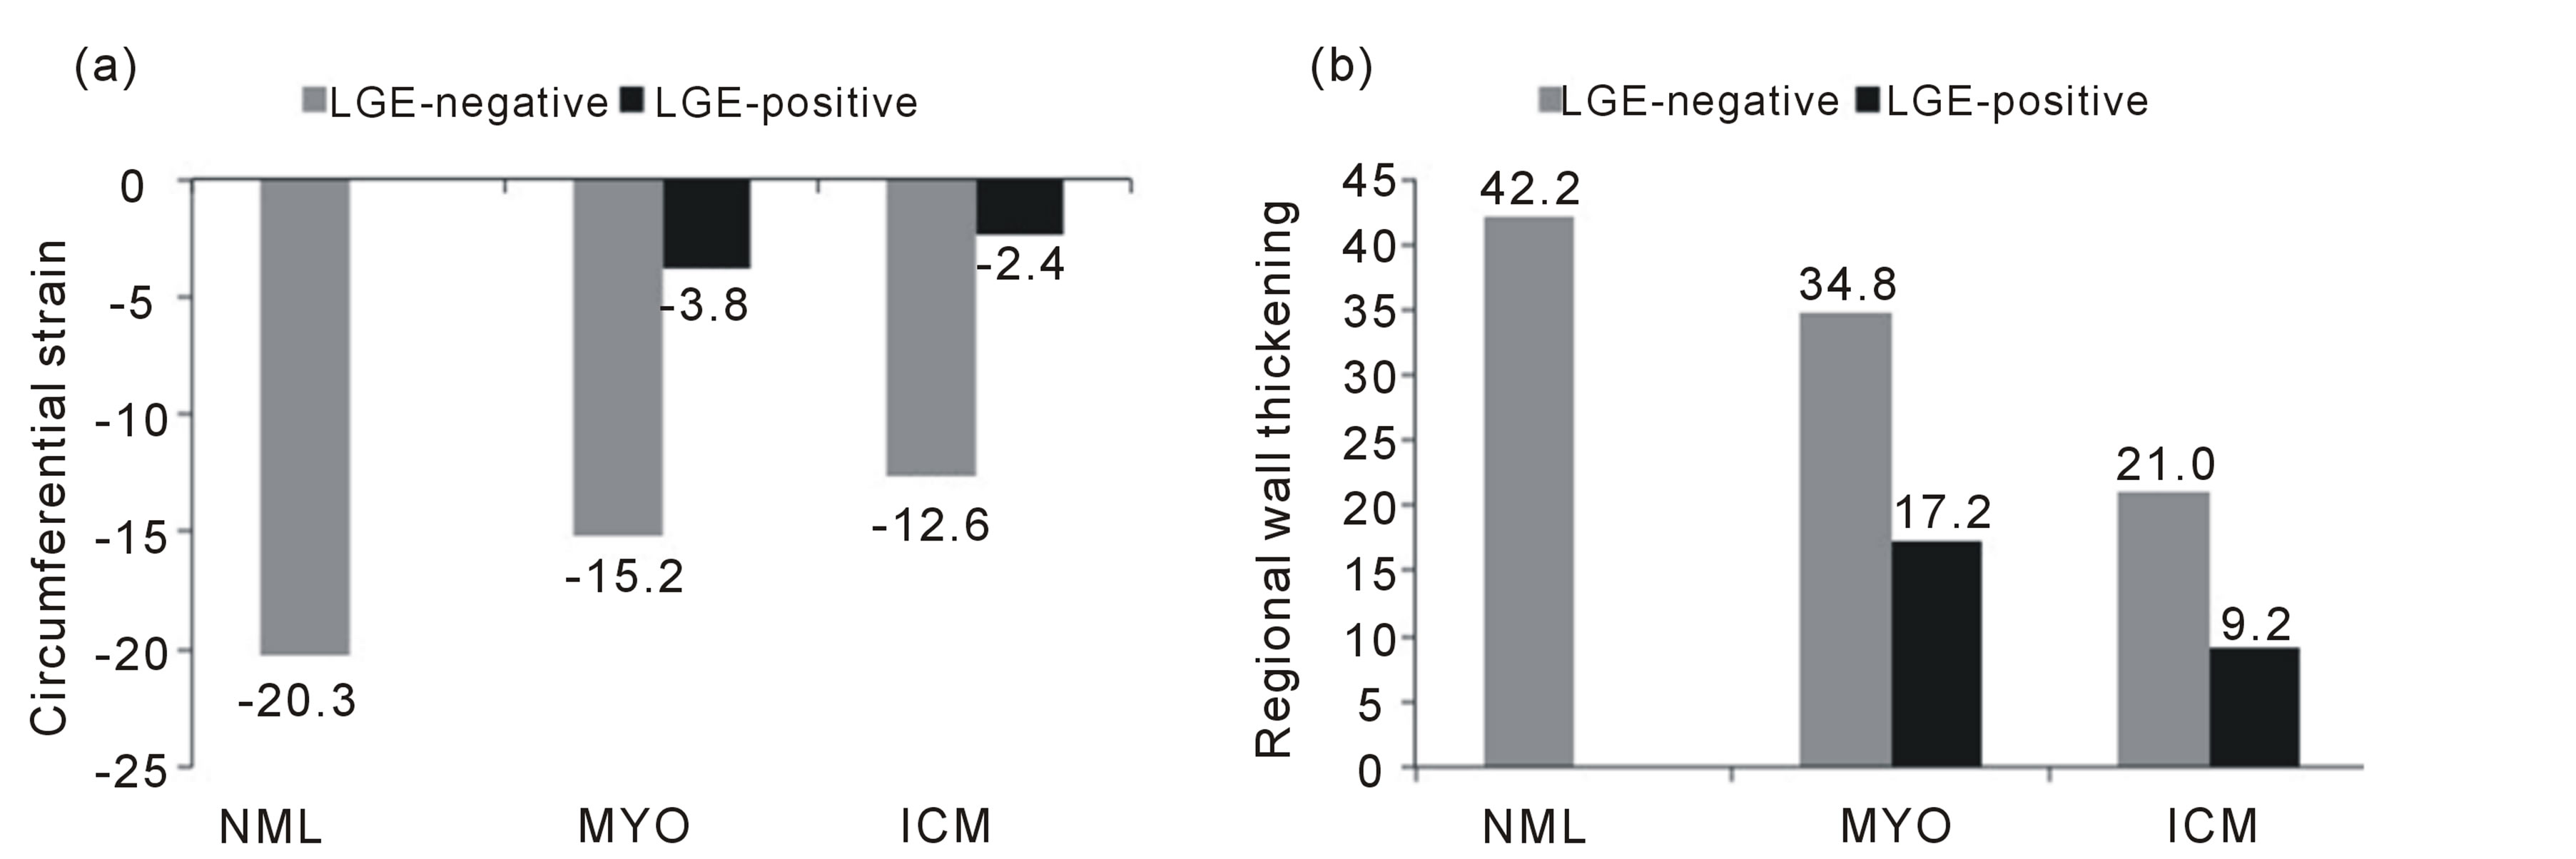
Figure 2. Bar graphs showing the differences in circumferential strain and regional wall thickening among normal controls and patients with myocarditis and old myocardial infarction. NML, normal controls; MYO, the patients with myocarditis; ICM, the patients with old myocardial infarction; LGE, late gadolinium enhancement.
Measurement of the left ventricular function by a conventional technique on CMR is obtained from the values of EF, volume, or myocardial mass, as a global function, given by cine imaging. We need to calculate regional wall thickening [15] in order to determine regional function, and quantitative measurement of wall thickening by ultrasonography provides a more precise indication of regional function than does visual estimation of wall motion [16] . For this reason, we performed quantitative measurement of rWT on CMR. The comparison of values of Ecc and rWT showed greater detectability of myocardial fibrosis in Ecc in this study. Manual tracing of the contour might have affected the results. This procedure is usually problematic because accurate and reliable tracing is difficult, and easily influenced by individuals doing the tracing. Tracing the endocardium at the systolic phase is particularly difficult, even though we used dedicated software. As the heart contracts, we cannot differentiate the papillary muscle from the myocardium. This results in unstable measurement of the cardiac function.
On the other hand, strain analysis of tagging imaging is not affected by this difficulty in tracing. This could be one reason why we saw higher detectability with tagging imaging than with cine imaging. Another possibility arises from the fact that the active contraction is only circumferential and radial thickening is not a primary phenomenon but is only a consequence of fiber rearrangement [17] . Therefore, Ecc was more sensitive than rWT. In the MYO group, myocardial damage often occurs from the mid-layer to the outer layer [18] , [19] . Damage to the epicardium is considered to have less effect on the contraction of the left ventricle compared to the endomyocardium [20] ; therefore, the reduction in wall thickening could be underestimated in the analysis.
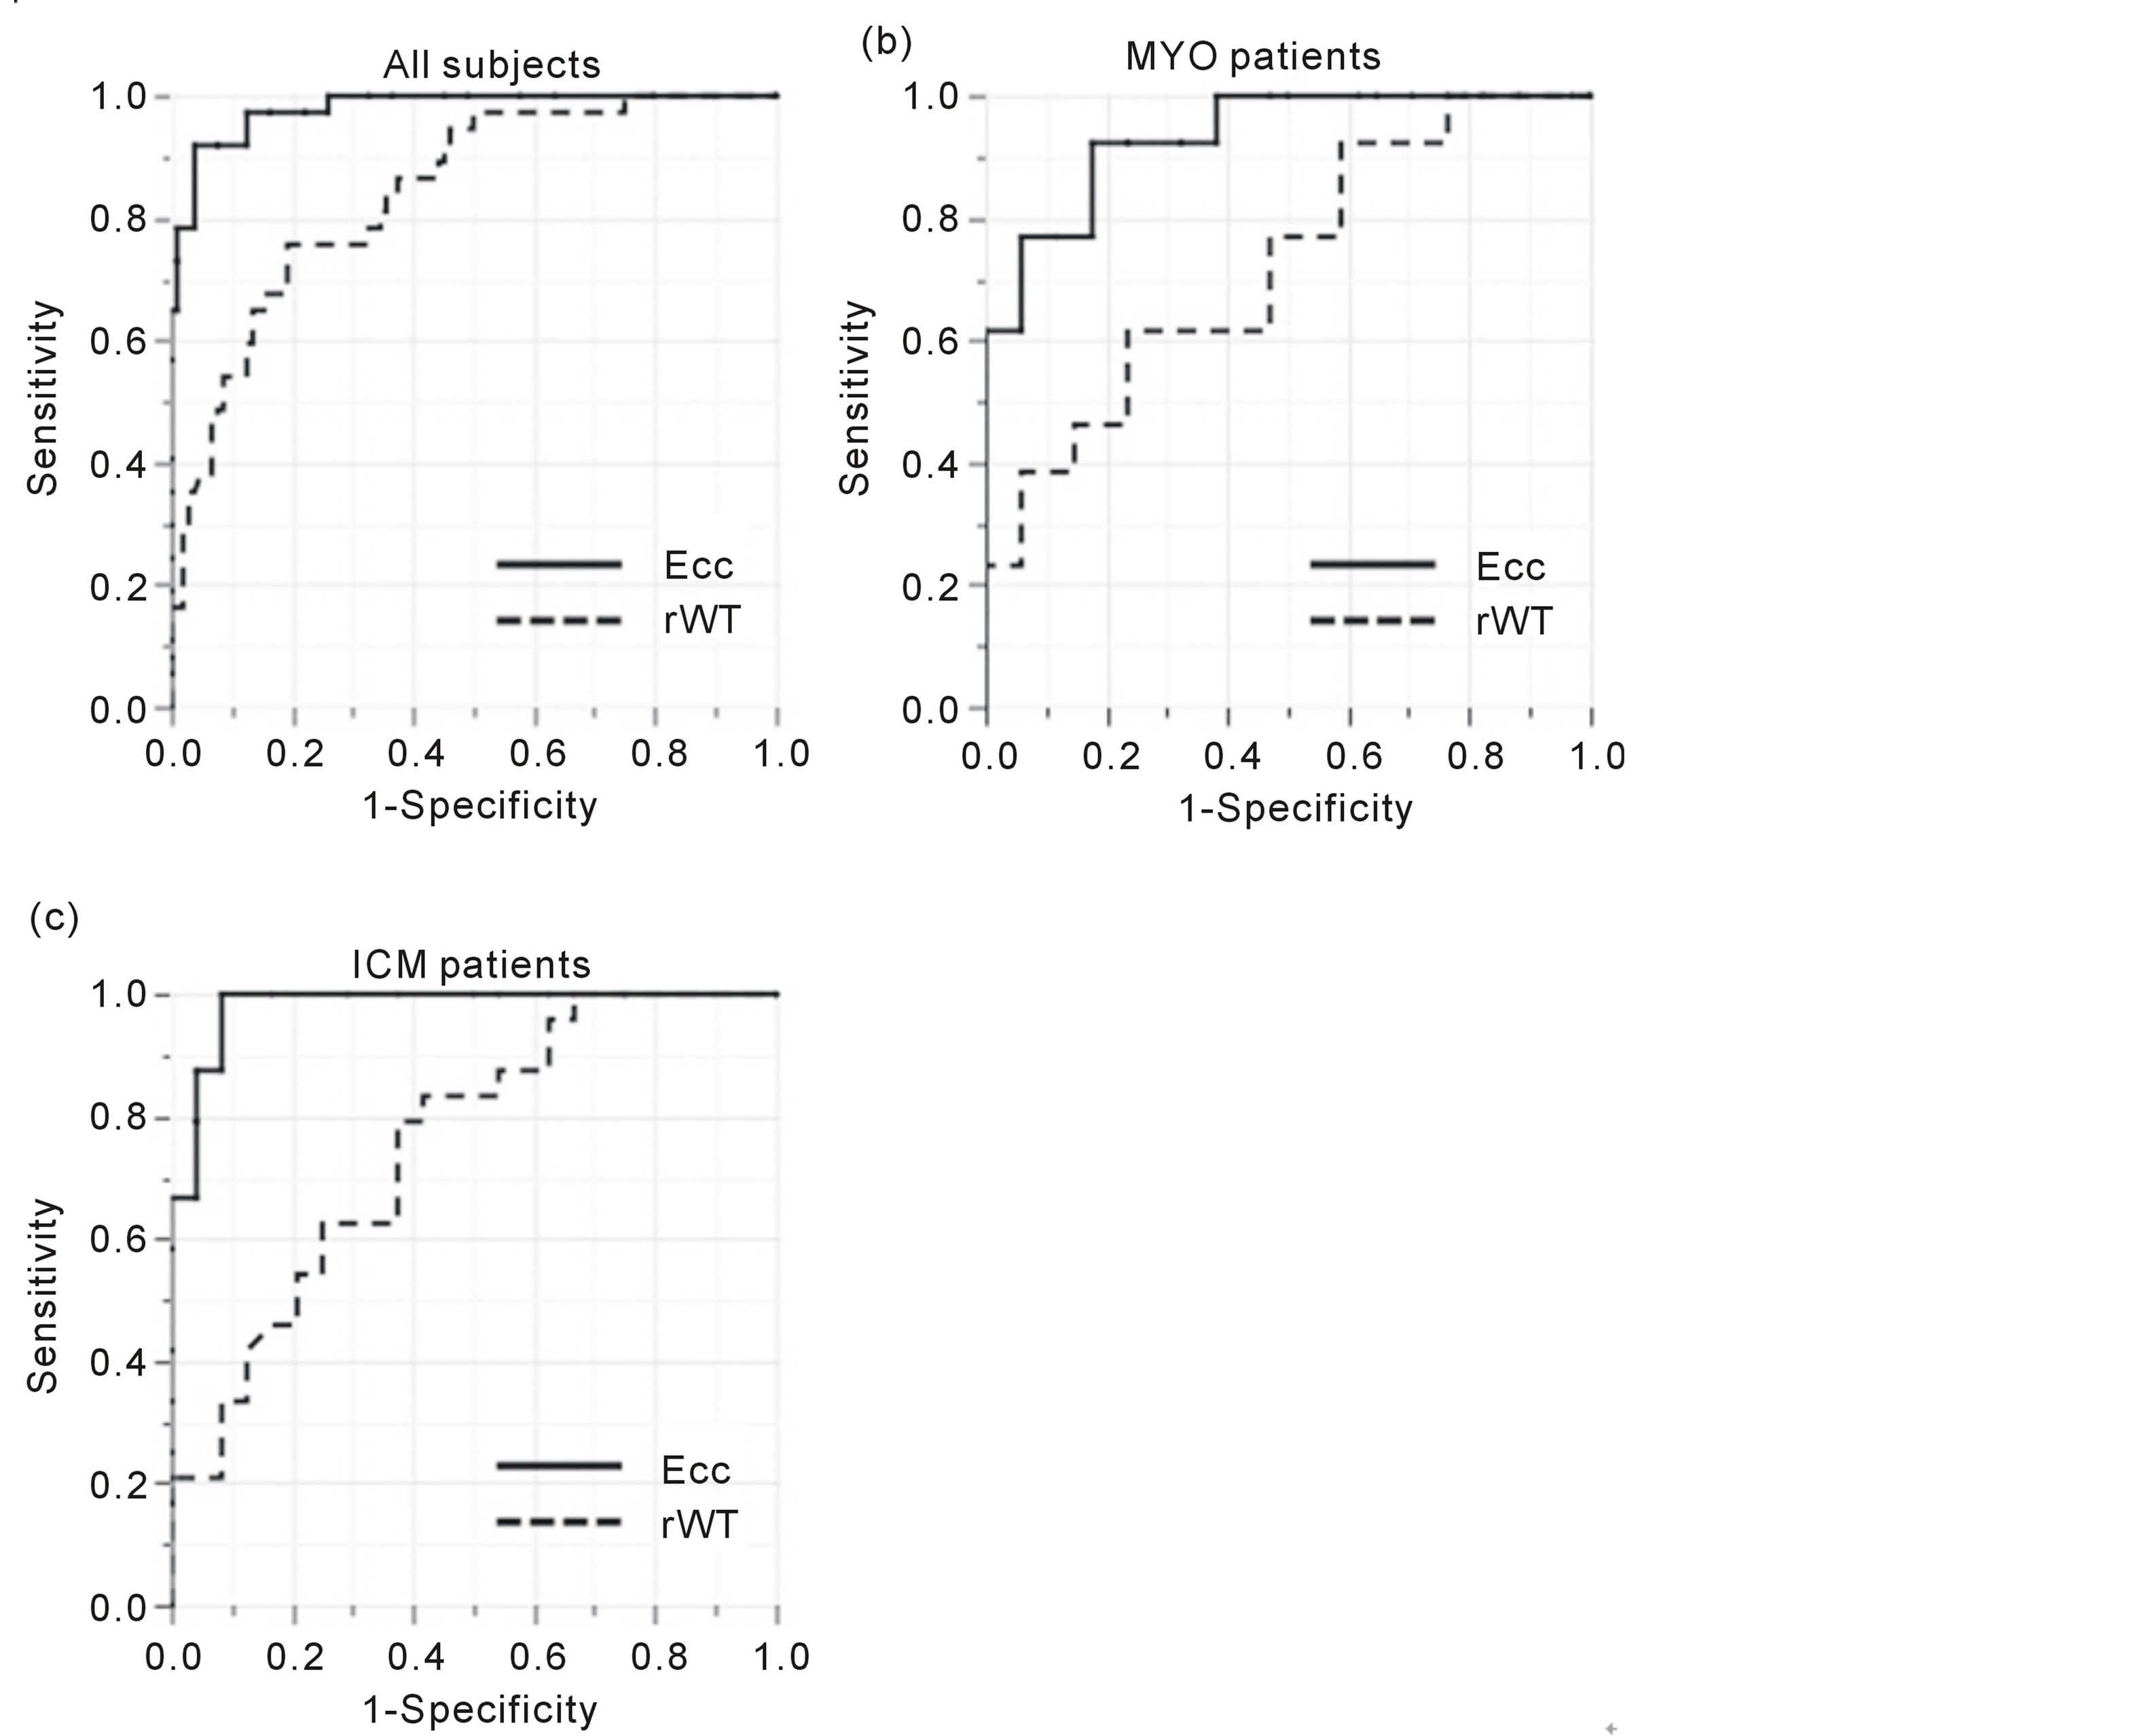
Figure 3. Receiver operating curves (ROC) of the detectability for myocardial fibrosis by using circumferential strain (Ecc) and regional wall thickening (rWT). In all subjects (a), the values of AUC calculated from ROC of circumferential strain (Ecc, solid lines) and regional wall thickening (rWT, dashed lines) are 0.98 and 0.84, respectively. In the patients with myocarditis (MYO), these values were 0.95 and 0.72, respectively (b). In the patients with old myocardial infarctions (ICM), these values were 0.99 and 0.75, respectively (c).
On the other hand, Ecc directly reveals the contraction of the myocardium; therefore, it should be more sensitive than rWT to myocardial damage or fibrosis.
We evaluated both MYO and ICM patients in this study, and tagging imaging showed high diagnostic performance in the detection of myocardial fibrosis. Our values for the AUC of Ecc analysis were 0.98 in all subjects, 0.95 in MYO, and 0.99 in ICM, which were quite high. This is because our patients clearly showed LGE—especially in ICM patients, who showed a transmural enhancement. This patient bias might mean that the diagnostic performance is higher than in a clinical setting. Goette et al. reported that tagging imaging had a sensitivity of 92% and specificity of 99% in their infarcted population [8] . They did not use LGE, so their reference standard was based on their model according to the coronary territories. Recently, Oyama-Manabe et al. reported the usefulness of fast strain-encoded (SENC) tagging imaging on 3T with the reference standard of LGE [21] . They analyzed patients with subendocardial infarction and with transmural infarction, and reported an AUC value of 0.88 when an average of the peak longitudinal and circumferential strains was used. Their AUC value was smaller than ours because they included patients with subendomyocardial infarction. These reports and our results indicated that tagging imaging is useful for finding the myocardial infarction area.
Coronary disease results in ischemia or infarction in the area related to the culprit artery. On the other hand, unlike the case in coronary disease patients, myocardial damage followed by fibrosis is more difficult to estimate in patients with myocarditis because it does not show regularity. Moreover, LGE is not clear in myocarditis, compared to the infarction, because of the presence of viable myocytes in the fibrotic area [22] . Our results indicate that myocardial fibrosis in MYO patients is also detected correctly with tagging imaging.
Our study has some limitations. First, the number of the patients was small. This was because myocarditis is relatively rare disease, and our institute does not perform many CMR examinations for patients with ischemic cardiac disease. Second, the myocardium was not divided by the myocardial layers in this study. The myocardium is histologically composed of inner, mid-, and outer layers. However, because we adopted a tag spacing of 6 mm, we felt this prevented a more detailed analysis. As MRI equipment develops, narrower tag spacing is likely and further examinations will be conducted in this respect. Third, we classified the myocardium condition into only two groups based on visual inspection—LGE-positive and LGE-negative—because we could not perform a quantitative analysis of LGE.
The myocardium in the patients with MYO is possibly affected and damaged in the apparently normal (i.e., LGE-negative) myocardium on LGE imaging. This is also true for the patients with ICM, and an apparently normal myocardium is not always truly normal. However, the apparently normal myocardium has the potential to get better, even if the function is decreased, after the patients receive treatment [22] . In contrast, myocardial fibrosis occurs after the myocyte is dead, and the damage in the area with fibrosis is considered irreversible. Thus, we believe that detection of myocardial fibrosis is meaningful for finding the irreversibly damaged region. Tagging imaging has superiority over LGE due to the lack of a requirement for contrast material, although LGE shows a nice image quality and spatial resolution. Further examination is needed regarding the detection and quantitation of the apparent-normal-but-diseased myocardium using tagging imaging.
5. Conclusion
Strain analysis derived from tagging imaging showed higher detectability of myocardial fibrosis compared to regional wall analysis derived from conventional cine imaging. Tagging imaging has the potential to reveal myocardial fibrosis accurately without the need for a gadolinium agent.
Acknowledgements
AKK received the grant given from the Japanese Society for Magnetic Resonance in Medicine and Bayer Schering Pharma. This study was partially funded by this grant.
I would like to express my gratitude to my family for their support of my fellowship, and to Professor Gabriel P. Krestin at Erasmus Medical Center for the insightful comments and suggestions.
References
- Ichikawa, Y., Sakuma, H., Kitagawa, K., Ishida, N., Takeda, K., Uemura, S., Motoyasu, M., Nakano, T. and Nozaki, A. (2003) Evaluation of Left Ventricular Volumes and Ejection Fraction Using Fast Steady-State Cine MR Imaging: Comparison with Left Ventricular Angiography. Journal of Cardiovascular Magnetic Resonance, 5, 333-342. http://dx.doi.org/10.1081/JCMR-120019422
- Bavelaar-Croon, C.D., Kayser, H.W., van der Wall, E.E., de Roos, A., Dibbets-Schneider, P., Pauwels, E.K., Germano, G. and Atsma, D.E. (2000) Left Ventricular Function: Correlation of Quantitative Gated SPECT and MR Imaging over a Wide Range of Values. Radiology, 217, 572-575. http://dx.doi.org/10.1148/radiology.217.2.r00nv15572
- Grothues, F., Smith, G.C., Moon, J.C., Bellenger, N.G., Collins, P., Klein, H.U. and Pennell, D.J. (2002) Comparison of Interstudy Reproducibility of Cardiovascular Magnetic Resonance with Two-Dimensional Echocardiography in Normal Subjects and in Patients with Heart Failure or Left Ventricular Hypertrophy. American Journal of Cardiology, 90, 29-34. http://dx.doi.org/10.1016/S0002-9149(02)02381-0
- Pouleur, A.C., le Polain de Waroux, J.B., Pasquet, A., Gerber, B.L., Gerard, O., Allain, P. and Vanoverschelde, J.L. (2008) Assessment of Left Ventricular Mass and Volumes by Three-Dimensional Echocardiography in Patients with or without Wall Motion Abnormalities: Comparison against Cine Magnetic Resonance Imaging. Heart, 94, 1050-1057. http://dx.doi.org/10.1136/hrt.2007.123711
- Moore, C.C., McVeigh, E.R. and Zerhouni, E.A. (2000) Quantitative Tagged Magnetic Resonance Imaging of the Normal Human Left Ventricle. Topics in Magnetic Resonance Imaging, 11, 359-371. http://dx.doi.org/10.1097/00002142-200012000-00005
- Zerhouni, E.A., Parish, D.M., Rogers, W.J., Yang, A. and Shapiro, E.P. (1988) Human Heart: Tagging with MR Imaging—A Method for Noninvasive Assessment of Myocardial Motion. Radiology, 169, 59-63.
- Croisille, P., Moore, C.C., Judd, R.M., Lima, J.A., Arai, M., McVeigh, E.R., Becker, L.C. and Zerhouni, E.A. (1999) Differentiation of Viable and Nonviable Myocardium by the Use of Three-Dimensional Tagged MRI in 2-Day-Old Reperfused Canine Infarcts. Circulation, 99, 284-291. http://dx.doi.org/10.1161/01.CIR.99.2.284
- Gotte, M.J., van Rossum, A.C., Twisk, J.W.R., Kuijer, J.P.A., Marcus, J.T. and Visser, C.A. (2001) Quantification of Regional Contractile Function after Infarction: Strain Analysis Superior to Wall Thickening Analysis in Discriminating Infarct from Remote Myocardium. Journal of the American College of Cardiology, 37, 808-817. http://dx.doi.org/10.1016/S0735-1097(00)01186-4
- Kuijpers, D., Ho, K.Y., van Dijkman, P.R., Vliegenthart, R. and Oudkerk, M. (2003) Dobutamine Cardiovascular Magnetic Resonance for the Detection of Myocardial Ischemia with the Use of Myocardial Tagging. Circulation, 107, 1592-1597. http://dx.doi.org/10.1161/01.CIR.0000060544.41744.7C
- Goldman, M.R., Brady, T.J., Pykett, I.L., Burt, C.T., Buonanno, F.S., Kistler, J.P., Newhouse, J.H., Hinshaw, W.S. and Pohost, G.M. (1982) Quantification of Experimental Myocardial Infarction Using Nuclear Magnetic Resonance Imaging and Paramagnetic Ion Contrast Enhancement in Excised Canine Hearts. Circulation, 66, 1012-1016. http://dx.doi.org/10.1161/01.CIR.66.5.1012
- Arts, T., Prinzen, F.W., Delhaas, T., Milles, J.R., Rossi, A.C. and Clarysse, P. (2010) Mapping Displacement and Deformation of the Heart with Local Sine-Wave Modeling. IEEE Transactions on Medical Imaging, 29, 1114-1123. http://dx.doi.org/10.1109/TMI.2009.2037955
- Axel, L. and Dougherty, L. (1989) Heart Wall Motion: Improved Method of Spatial Modulation of Magnetization for MR Imaging. Radiology, 172, 349-350.
- Castillo, E., Lima, J.A. and Bluemke, D.A. (2003) Regional Myocardial Function: Advances in MR Imaging and Analysis. Radiographics, 23, S127-S140. http://dx.doi.org/10.1148/rg.23si035512
- Gruszczynska, K., Kirschbaum, S., Baks, T., Moelker, A., Duncker, D.J., Rossi, A., Baron, J., de Feyter, P.J., Krestin, G.P. and van Geuns, R.J. (2011) Different Algorithms for Quantitative Analysis of Myocardial Infarction with DE MRI: Comparison with Autopsy Specimen Measurements. Academic Radiology, 18, 1529-1536. http://dx.doi.org/10.1016/j.acra.2011.08.002
- Haendchen, R.V., Wyatt, H.L., Maurer, G., Zwehl, W., Bear, M., Meerbaum, S. and Corday, E. (1983) Quantitation of Regional Cardiac Function by Two-Dimensional Echocardiography. I. Patterns of Contraction in the Normal Left Ventricle. Circulation, 67, 1234-1245. http://dx.doi.org/10.1161/01.CIR.67.6.1234
- Lieberman, A.N., Weiss, J.L., Jugdutt, B.I., Becker, L.C., Bulkley, B.H., Garrison, J.G., Hutchins, G.M., Kallman, C.A. and Weisfeldt, M.L. (1981) Two-Dimensional Echocardiography and Infarct Size: Relationship of Regional Wall Motion and Thickening to the Extent of Myocardial Infarction in the Dog. Circulation, 63, 739-746. http://dx.doi.org/10.1161/01.CIR.63.4.739
- Jeung, M.Y., Germain, P., Croisille, P., El Ghannudi, S., Roy, C. and Gangi, A. (2012) Myocardial Tagging with MR Imaging: Overview of Normal and Pathologic Findings. Radiographics, 32, 1381-1398. http://dx.doi.org/10.1148/rg.325115098
- Smedema, J.P., Snoep, G., van Kroonenburgh, M.P., van Geuns, R.J., Dassen, W.R., Gorgels, A.P. and Crijns, H.J. (2005) Evaluation of the Accuracy of Gadolinium-Enhanced Cardiovascular Magnetic Resonance in the Diagnosis of Cardiac Sarcoidosis. Journal of the American College of Cardiology, 45, 1683-1690. http://dx.doi.org/10.1016/j.jacc.2005.01.047
- Karamitsos, T.D., Francis, J.M., Myerson, S., Selvanayagam, J.B. and Neubauer, S. (2009) The Role of Cardiovascular Magnetic Resonance Imaging in Heart Failure. Journal of the American College of Cardiology, 54, 1407-1424. http://dx.doi.org/10.1016/j.jacc.2009.04.094
- Myers, J.H., Stirling, M.C., Choy, M., Buda, A.J. and Gallagher, K.P. (1986) Direct Measurement of Inner and Outer Wall Thickening Dynamics with Epicardial Echocardiography. Circulation, 74, 164-172. http://dx.doi.org/10.1161/01.CIR.74.1.164
- Oyama-Manabe, N., Ishimori, N., Sugimori, H., Van Cauteren, M., Kudo, K., Manabe, O., Okuaki, T., Kamishima, T., Ito, Y.M., Tsutsui, H., Tha, K.K., Terae, S. and Shirato, H. (2011) Identification and Further Differentiation of Subendocardial and Transmural Myocardial Infarction by Fast Strain-Encoded (SENC) Magnetic Resonance Imaging at 3.0 Tesla. European Radiology, 21, 2362-2368. http://dx.doi.org/10.1007/s00330-011-2177-4
NOTES

*Corresponding author.