Journal of Power and Energy Engineering
Vol.03 No.05(2015), Article ID:56097,9 pages
10.4236/jpee.2015.35001
Performance Enhancement of the Proton Exchange Membrane Fuel Cell Using Pin Type Flow Channel with Porous Inserts
Vaibhav Pal1, P. Karthikeyan2*, R. Anand1
1Department of Mechanical Engineering, National Institute of Technology, Tiruchirappalli, India
2Department of Automobile Engineering, PSG College of Technology, Coimbatore, India
Email: vp5830@gmail.com, *apkarthipsg@gmail.com, anandachu@nitt.edu
Copyright © 2015 by authors and Scientific Research Publishing Inc.
This work is licensed under the Creative Commons Attribution International License (CC BY).
http://creativecommons.org/licenses/by/4.0/


Received 13 March 2015; accepted 29 April 2015; published 5 May 2015
ABSTRACT
The design of the flow field is highly responsible for the performance of the Proton Exchange Membrane Fuel Cell (PEMFC). In this study, pin type flow channel is numerically analyzed by arranging carbon made porous material in uniform and zigzag manner on the rib surface of the flow field. The study focuses on enhancing the performance of PEMFC by reducing liquid flooding in the interface between the rib and Gas Diffusion Layer (GDL). A single PEMFC having an active area of 25 cm2, with three flow channel designs (conventional serpentine, pin type flow channel with 2 mm cubical porous inserts in zigzag and uniform pattern) are modeled for the numerical analysis. The effect of porosity of the carbon inserts on the cell performance is studied by varying its value from 0.6 to 0.9. The results show that the performance of the flow channel with zigzag and uniformly positioned porous inserts is more than the conventional serpentine flow channel by 20.36% and 16.87% respectively. The reason for this increase is the removal of the accumulated water from the rib surface due to the capillary action of the porous carbon inserts. This helps in eliminating the stagnant water regions under the rib and thereby helps in reducing liquid flooding.
Keywords:
Flooding, Uniform and Zigzag Pin Type, Porosity, Porous Carbon Inserts

1. Introduction
With the increasing problem of environmental degradation due to the harmful emissions from the existing fuels and the shortage of the non-renewable fossil fuels, alternative fuels and non-polluting sources of energy are the need of the hour. Fuel cells are a viable option for the future as they are portable and have almost no harmful emissions [1] -[4] . Out of the various available fuel cells, Proton Exchange Membrane Fuel Cell (PEMFC) is capable of operating at a temperature close to the atmospheric temperature and has a rapid start up time, thus making it a potential candidate for automobile application. But there are various obstacles for the commercialization of the PEMFC such as high cost of its materials, short cycle life, and lack of hydrogen infrastructure for its generation, and storage.
In a typical PEMFC, hydrogen gas is used as a fuel and is passed through the anode region, whereas an oxidant either oxygen or air is passed through the cathode region. Water is obtained as a by-product at the cathode end due to the electrochemical reaction between hydrogen and oxygen. The water obtained as a by-product has to be precisely balanced for the better performance of PEMFC. At the cathode side, oxygen reduction reaction (ORR) occurs in the catalyst-membrane interface and due to this water is generated. For the hydration of the membrane, inlet fuel and oxidant are supplied in a fully humidified state. Due to this, the gases in the fuel cell may get oversaturated with the water vapour and get condensed to form liquid water, thereby the amount of water content in the cathode region increases. Apart from this, the cathode region also gets water through electro-osmotic drag, wherein the positively charged protons tend to attract and drag the water molecules along with them, when migrating from anode to cathode flow channels. The water transport also takes place due to pressure drop as well as concentration difference. Hence, managing the produced water towards the cathode end becomes important. The water content towards the cathode end must be judiciously maintained in order to achieve high efficiency. At present, the biggest problem researchers are facing is the water management at the cathode side. If the water removal rate is greater than the generation rate, the membrane gets dehydrated and therefore results in the poor performance due to excessive ohmic losses [5] [6] . But if there is excess water, it can retard the transport of reactants to the active reaction site by blocking the pores in the catalyst layer as well as in the GDL. This problem is called flooding and it reduces the PEMFC’s performance to a huge extent and makes it unreliable and unpredictable [7] [8] .
Different methods have been proposed for managing the water in an effective manner and the most productive method found is to effectively designing the flow channel [1] [9] [10] . Flow patterns with less pressure drop (straight parallel, Z type parallel, cascade, and pin type) allow preferential flow path and there is uneven distribution of gases in the membrane electrode assembly (MEA), which decreases the performance of the PEMFC [11] [12] . Serpentine and interdigitated flow patterns distribute the reactants uniformly over the catalytic layer and thus increases its efficiency [13] [14] . On the other side, higher pressure fall in the flow pattern increases the energy required for the gas flow and this reduces the cell’s efficiency. But the higher pressure fall in these two patterns also promote the under rib convection which helps in the removal of water and thus increases the efficiency of the PEMFC [15] [16] .
For solving this problem of cathode flooding, different researchers have suggested different techniques. Nguyen [17] initially studied the interdigitated flow field pattern and found that the dead end profile of the flow channel forced the gases to go through the GDL and gas pushed out the water droplets entrapped in the layers of electrode. This also increased the amount of reactants reaching the catalyst layer from the channels leading to increase in performance and the problem of flooding was also reduced. Wang et al. [18] investigated the baffle blocked interdigitated flow field and concluded that the gas convection got increased by the use of baffle blocks which further enhanced the reactant transport to the electrode and the water removal. Qin et al. [19] proposed the use of hydrophilic plate flow field which increased the water removal rate. In this study, a novel flow field design towards the cathode side of the PEMFC is used for efficient water removal. The effect of three flow patterns (conventional serpentine, pin type flow channel with adoption of porous carbon insertsin uniform and zigzag pattern) have been studied numerically and their performances have been compared. Also, the porosity of carbon inserts have been varied and then its influence on the PEMFC’s performance has been analysed.
2. Model Development
A three-dimensional model with three flow field patterns (conventional serpentine, pin type flow channel with the adoption of porous carbon inserts in uniform and zigzag pattern) has been evaluated on an active area of 25 cm2. As the problem of water flooding occurs towards the cathode side of the PEMFC, a modification is made in the cathode flow channel only. The modification is done by inserting porous carbon inserts in the uniform and zigzag pattern on the rib surface of the pin type flow channel. By placing these porous carbon inserts in a uniform and zigzag manner on the rib surface, the pin type flow channel becomes similar to a serpentine flow channel (dimension of porous inserts 2 mm × 2 mm × 2 mm). Therefore, it gains the merits of the serpentine flow channel. Table 1 shows the geometric dimensions used in the conventional serpentine flow channel. The geometric dimensions of the other two modified patterns remain the same, except for the change in the flow field pattern at the cathode side as shown in Figure 1(a) and Figure 1(b). The configuration of the landing to channel (L: C) 2 mm × 2 mm is used throughout the three patterns.
2.1. Numerical Model Development
The commercially available Fluid Dynamics software FLUENT 14.5 which is based on a control volume approach was used to solve the various governing equations. 3-dimensional, steady state, laminar, double precision, serial processing modes were used for this simulation. A special add-on module called “Battery and Fuel Cell” was used for this study. In order to get accurate results, a grid independency test was done and finally the results were found grid independent at about 650,000 elements. In order to simplify the analysis, the gases used were considered to be ideal. The flow was taken as steady, laminar, incompressible, and the system was considered as isothermal at 325 K. The various thermo physical properties were considered as constant and the effect of gravity was neglected. Also, the GDL, the catalyst layer, carbon inserts and the membrane were considered to be isotropic.

Table 1. Dimensions of the fuel cell.

 (a) (b)
Figure 1. Dimensions of the modified flow channels (a) Uniform pin type; (b) Zigzag pin type (All dimensions are in mm).
2.2. Boundary Conditions
In this model, the anode and cathode channel inlet zone were set as mass flow inlet respectively, the anode and cathode channel outlet zone were set as pressure outlet, exhaust-fan, outlet-vent whereas the other left surfaces were set as wall. The operating conditions for all the three patterns were set at a pressure of 1 bar and temperature of 325 K. Water produced was assumed to be fully liquid (100% humidified) and the mass fractions towards the anode side were set at 0.8, 0.2, 0 for H2, H2O, O2 respectively [20] ; for the cathode side mass fractions were set at 0, 0.1, 0.2 for H2, H2O, O2 respectively [20] . The summary of various reaction parameters and material properties used in this work is shown in Table 2. For the uniform and zigzag pattern of porous carbon inserts the porosity value was varied from 0.6 to 0.9.
The various equations which are solved in this study (discussed in sections 2.3 to 2.5) are taken from the Falcao et al. [21] and are as follows:
2.3. Electrochemistry Equations
In this study Fuel Cell and Electrolysis Model is used to solve the two potential equations and they are as follows [21] :
 (1)
(1)
 (2)
(2)
Table 2. Reaction parameters and material properties.
where , E and R represent electrical conductivity, electric potential and volumetric transfer current respectively. The indices sol, mem, ano and catho represent solid phase, membrane phase, anode region and cathode region respectively. The transfer currents or the source terms in the Equation (1) and Equation (2) are not zero at the catalyst layers only and are calculated as [21] :
if phase is solid,

 at the anode region and

 at the cathode region.
if phase is membrane,

 at the anode region and

 on the cathode region.
Source terms for Equations (1) and (2) are also termed as exchange current density and have the generic Tafel formulation [21] :
 (3)
(3)
 (4)
(4)
where G, T, and F are the gas constant, the temperature of the fuel cell and the Faraday’s constant respectively.
 is the hydrogen concentration in the catalytic layer,
 is the reference hydrogen concentration,
 is the oxygen concentration in the catalytic layer,
 is the reference oxygen concentration in the catalytic layer,
 is the anode volumetric reference exchange current density,
 is the cathode volumetric reference exchange current density;
 is the coefficient of anode transfer,
 is the coefficient of cathode transfer,
 is the anode concentration dependence,
 is the cathode concentration dependence,
 is the anode over potential and
 is the cathode over potential. The anode over potential is the difference between the solid potential
 and membrane potential
 whereas the cathode over potential is the difference between the solid potential
 , membrane potential
 , and the open circuit voltage
 [21] :
 (5)
(5)
 (6)
(6)
2.4. Current and Mass Conservation
The source terms
 for the equation of species and energy are denoted in Equations (7)-(9) [21] :
 (7)
(7)
 (8)
(8)
 (9)
(9)
where
 is the molecular weight of hydrogen,
 is the molecular weight of oxygen,
 is the molecular weight of water,
 is the volumetric source term for H2,
 is the colume tric source term for O2, and
 is the volumetric source term for H2O. So, in this study the following equation has been used for current conservation [21] :
 (10)
(10)
2.5. Liquid Water Formation and Transport
A saturation model is used in FLUENT for modeling the formation and transport of the liquid water. The following conservation equation governs the formation of the water (in liquid form) and its transport [21] :
 (11)
(11)
where
 is the volume fraction of liquid water or the water saturation, the subscript
 stands for liquid water,
 is the porosity,
 is the density and
 is the rate of following conservation equation which is defined as [21] :
 (12)
(12)
where
 is the condensation rate constant and is defined as
 ,
,
 is the water vapour pressure and
 is the saturation pressure in terms of atm (standard atmosphere). The liquid velocity
 is also assumed to be equal to the velocity of gas in the flow channel. The convective term in Equation (11) isreplaced by the capillary diffusion termto form the following conservation equation (used for high resistant porous zones) [21] :
 (13)
(13)
The capillary pressure
 is calculatedas following depending upon the wetting phase [21] :
for ,
, (14)
(14)
for ,
, (15)
(15)
where
 is the surface tension,
 is the absolute permeability and
 is the angle of contact. Equation (11) depictsthe different physical phenomenon like surface tension, capillary diffusion, condensation, and vaporization.
3. Results and Discussion
3.1. Effect of Porosity Variation on Cell Performance
On comparing the peak power density for pin type flow channel with uniformly positioned porous carbon inserts with different porosities, it was found that there was not much effect on the cell performance with the porosity variation (peak power density for 0.9 porosity was 0.512 W/cm2 whereas for 0.6 porosity peak power density obtained was 0.511 W/cm2). Similarly, on comparing the peak power density for pin type flow channel with zigzag positioned porous carbon inserts with different porosities, it was found that there was not much effect on the cell performance with the porosity variation (peak power density for 0.9 porosity was 0.527 W/cm2 whereas for 0.6 porosity peak power density obtained was 0.526 W/cm2).
3.2. Comparison between the Performance of Uniform and Zigzag Pattern with Porous Carbon Inserts
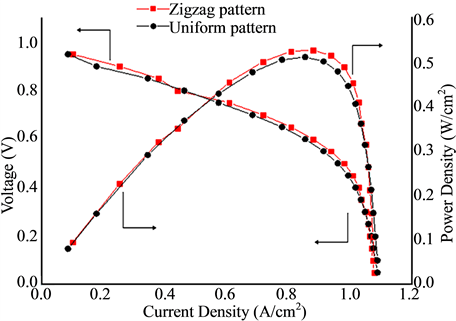
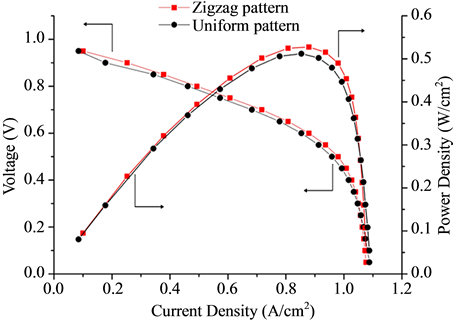
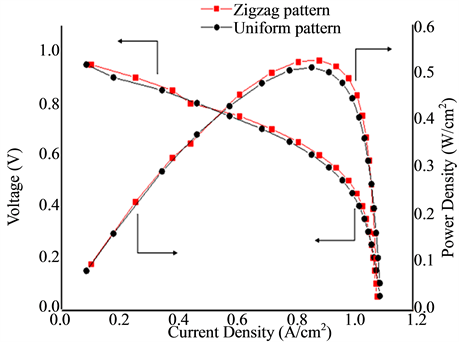
The performance of the uniform and zigzag pattern with porous carbon inserts is analyzed by varying the porosity from 0.6 to 0.9. Figures 2(a)-(d) show the P-I (Power Density-Current Density) and the V-I (Voltage-Current Density) curves for both the patterns used, at porosity equals to 0.6, 0.7, 0.8 and 0.9 respectively. The above mentioned figures show that the performance of zigzag pin type channel with porous inserts is better than the uniform pin type channel with porous carbon inserts since the plot for zigzag pattern is higher than the uniform pattern for all the different porosity used. Also, Table 3 depicts the peak values of power density and corresponding current densities for the uniform and zigzag pattern with porous carbon inserts and there seems to be an
 (a) (b)
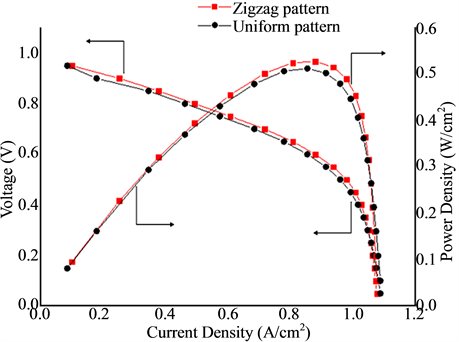
 (c) (d)
Figure 2. Performance comparison of modified patterns at different porosities (a) 0.6; (b) 0.7; (c) 0.8; (d) 0.9.
Table 3. Comparison of peak power density and current density for all the three flow patterns analyzed.
increase in the values of power density for zigzag pattern over the uniform pattern by 2.98%. In the case of uniform pattern, the arrangement of porous inserts becomes localized, whereas for the zigzag pattern the arrangement is widespread. As a result, the water absorbed by the zigzag pattern in the interfacial region between the gas diffusion layer and the membrane becomes more globalized and hence eliminates the stagnant water more effectively. This effective water elimination results in the higher performance of the zigzag pattern.
3.3. Comparison of Cell Performance for Conventional Serpentine Pattern with the Uniform and Zigzag Pattern of Porous Carbon Inserts in Serpentine Flow Field
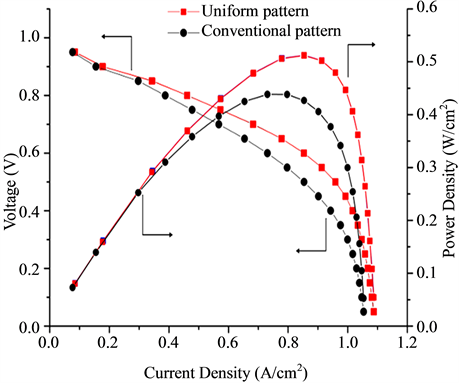
Numerical studies have been done on the three flow patterns (conventional serpentine, pin type flow channel with the adoption of porous carbon inserts in zigzag and uniform pattern) in order to analyze the performance of PEMFC. Figure 3(a) shows the performance comparison between the conventional serpentine and pin type flow channel in uniform pattern with porous carbon inserts (at porosity 0.9 as it shows maximum performance among the different porosities) using the P-I and the V-I curves. Figure 3(b) shows the P-I and the V-I curves for performance comparison between the conventional serpentine and pin type flow channel in zigzag pattern with porous carbon inserts (at porosity 0.9 as it shows maximum performance among the different porosities). For conventional serpentine flow channel, the maximum current density and power density are obtained as 0.731 A/cm2 and 0.438 W/cm2 respectively. For uniform and zigzag pattern with porous inserts the peak power density and corresponding current density are 0.512 W/cm2, 0.854 A/cm2 and 0.527 W/cm2, 0.879 A/cm2 respectively. The peak values of power and corresponding current densities for the three patterns used are mentioned in Table 3. It is evident that the uniform and zigzag pattern with porous carbon inserts show higher peak power density than the conventional serpentine channel pattern by 16.87% and 20.36%. The reason for the increase in performance is due to the elimination of stagnant region under the rib surface. Due to the capillary action of the porous inserts water is absorbed from the interfacial region between the rib and GDL, thereby reducing the obstacles for the incoming reactant gases. Figure 4 compares the water generation rate for both the modified pin type flow patterns (porosity 0.9) with the conventional serpentine channel pattern. This comparison shows that in case of

 (a) (b)
Figure 3. Performance comparison of conventional pattern with (a) Uniform pattern; (b) Zigzag pattern at 0.9 porosity.

Figure 4. Comparison of water generation rate for conventional pattern with (a) Uniform pattern; (b) Zigzag pattern (both at 0.9 porosity).
both the modified pin type flow patterns there is more water generation. The reason for this higher water generation rate is the effective distribution of the reactants throughout the cathode channel (as there is no water logging in both the modified flow pin type flow channel). This validates that the use of both the modified pin type flow patterns enhances the performance by reducing the water accumulation in the flow channel.
4. Conclusion
Analysis was done on 25 cm2 PEMFC with three flow channel configurations (conventional serpentine, pin type flow channel with the adoption of porous carbon inserts in zigzag and uniform pattern on the rib area) in order to study the cell performance. From the analysis, it was found that the uniform and zigzag pattern with porous inserts show 16.87% and 20.36% increase in performance when compared to the conventional serpentine flow channel. While comparing pin type channels (uniform and zigzag) with porous carbon inserts, zigzag pattern pin type flow channel showed 2.98% more performance than the uniform. It is also found that there is not much effect on the performance of the two new adopted designs with the variation in porosity level of the porous inserts from 0.6 to 0.9. The analysis also shows that the water absorption in case of the zigzag pattern flow channel is more than the uniform porous carbon insert channel pattern.
Acknowledgements
The work done for this paper was due to the support of the Computer Support Group Department, National Institute of Technology, Tiruchirappalli and Department of Automobile Engineering, PSG College of Technology, Coimbatore.
References
- Li, X.G. (2006) Principles of Fuel Cells. Taylor & Francis, New York.
- Li, X.G. (2005) Diversification and Localization of Energy Systems for Sustainable Development and Energy Security. Energy Policy, 33, 2237-2243. http://dx.doi.org/10.1016/j.enpol.2004.05.002
- Zamel, N. and Li, X.G. (2006) Life Cycle Analysis of Vehicles Powered by a Fuel Cell and by Internal Combustion Engine for Canada. Journal of Power Sources, 155, 297-310. http://dx.doi.org/10.1016/j.jpowsour.2005.04.024
- Granovskii, M., Dincer, I. and Rosen, M.A. (2006) Life Cycle Assessment of Hydrogen Fuel Cell and Gasoline Vehicles. International Journal of Hydrogen Energy, 31, 337-352. http://dx.doi.org/10.1016/j.ijhydene.2005.10.004
- Zawodzinski Jr., T.A., Derouin, C., Radzinski, S., et al. (1993) Water Uptake by and Transport through NafionR 117 Membranes. Journal of Electrochemical Society, 140, 1041-1047. http://dx.doi.org/10.1149/1.2056194
- Li, H., Tang, Y., Wang, Z., Shi, Z., et al. (2008) A Review of Water Flooding Issues in the Proton Exchange Membrane Fuel Cell. Journal of Power Sources, 178, 103-117. http://dx.doi.org/10.1016/j.jpowsour.2007.12.068
- Yang, X.G., Burke, N., Wang, C.Y., Tajiri, K. and Shinohara, K. (2005) Simultaneous Measurements of Species and Current Distributions in a PEFC under Low-Humidity Operation. Journal of Electrochemical Society, 152, 759-766. http://dx.doi.org/10.1149/1.1864492
- Pierre, J.S., Wilkinson, D.P., Knights, S. and Bos, M. (2000) Relationships between Water Management, Contamination and Lifetime Degradation in PEFC. Journal of New Materials for Electrochemical Systems, 3, 99-106.
- Cavalca, C., Homeyer, S.T. and Walsworth, E. (1997) Flow Field Plate for Use in a Proton Exchange Membrane Fuel Cell. US Patent No. 5686199.
- Li, X.G. and Sabir, I. (2004) Review of Bipolar Plates in PEM Fuel Cells: Flow-Field Designs. International Journal of Hydrogen Energy, 30, 359-371. http://dx.doi.org/10.1016/j.ijhydene.2004.09.019
- Manso, A.P., Marzo, F.F., Barranco, J., Garikano, X. and Mujika, M.G. (2012) Influence of Geometric Parameters of the Flow Fields on the Performance of a PEM Fuel Cell―A Review. International Journal of Hydrogen Energy, 37, 15256-15287. http://dx.doi.org/10.1016/j.ijhydene.2012.07.076
- Ferng, Y.M. and Su, A. (2007) A Three-Dimensional Full-Cell CFD Model Used to Investigate the Effects of Different Flow Channel Designs on PEMFC Performance. International Journal of Hydrogen Energy, 32, 4466-4476. http://dx.doi.org/10.1016/j.ijhydene.2007.05.012
- Liu, H., Li, P., Robles, D.J., Wang, K. and Hernandez-Guerrero, A. (2014) Experimental Study and Comparison of Various Designs of Gas Flow Fields to PEM Fuel Cells and Cell Stack Performance. Frontiers in Energy Research, 2, 2. http://dx.doi.org/10.3389/fenrg.2014.00002
- Ji, M. and Wei, Z. (2009) A Review of Water Management in Polymer Electrolyte Membrane Fuel Cells. Energies, 2, 1057-1106. http://dx.doi.org/10.3390/en20401057
- Lee, B., Park, K. and Kim, H.M. (2013) Numerical Optimization of Flow Field Pattern by Mass Transfer and Electrochemical Reaction Characteristics in Proton Exchange Membrane Fuel Cells. International Journal of Electrochemical Science, 8, 219-234.
- Nama, J.H., Lee, K.-J., Sohnb, S. and Kimb, C.-J. (2009) Multi-Pass Serpentine Flow-Fields to Enhance Under-Rib Convection in Polymer Electrolyte Membrane Fuel Cells: Design and Geometrical Characterization. Journal of Power Sources, 188, 14-23. http://dx.doi.org/10.1016/j.jpowsour.2008.11.093
- Nguyen, T.V. (1996) A Gas Distributor Design for Proton-Exchange-Membrane Fuel Cells. Journal of Electrochemical Society, 143, 103-105. http://dx.doi.org/10.1149/1.1836666
- Wang, X.-D., Duan, Y.-Y. and Yan, W.-M. (2007) Novel Serpentine-Baffle Flow Field Design for Proton Exchange Membrane Fuel Cells. Journal of Power Sources, 173, 210-221. http://dx.doi.org/10.1016/j.jpowsour.2007.08.037
- Qin, Y.Z., Li, X.G., Jiao, K., Du, Q. and Yin, Y. (2014) Effective Removal and Transport of Water in a PEM Fuel Cell Flow Channel Having a Hydrophilic Plate. Applied Energy, 113, 116-126. http://dx.doi.org/10.1016/j.apenergy.2013.06.053
- ANSYS, Inc. ANSYS FLUENT (2007) Modeling a Single-Channel, Counter-Flow Polymer Electrolyte Membrane Fuel Cell.
- Falco, D.S., Gomes, P.J., Oliveria, V.B., Pinho, C. and Pinto, A.M.F.R. (2011) 1D and 3D Numerical Simulations in PEM Fuel Cells. International Journal of Hydrogen Energy, 36, 12486-12498. http://dx.doi.org/10.1016/j.ijhydene.2011.06.133
NOTES

*Corresponding author.