Journal of Power and Energy Engineering
Vol. 1 No. 6 (2013) , Article ID: 39932 , 8 pages DOI:10.4236/jpee.2013.16001
Circuit Model of 100 Ah Lithium Polymer Battery Cell
![]()
Department of Electrical Engineering, University of Massachusetts Lowell, Lowell, USA.
Email: umass9@hotmail.com, dipesh_patel1@student.uml.edu, ziyad_salameh@uml.edu
Copyright © 2013 Bong G. Kim et al. This is an open access article distributed under the Creative Commons Attribution License, which permits unrestricted use, distribution, and reproduction in any medium, provided the original work is properly cited.
Received October 4th, 2013; revised November 4th, 2013; accepted November 15th, 2013
Keywords: Lithium Polymer Battery Cell; Battery Circuit Model; Battery Cell Model Simulation
ABSTRACT
This paper presents a circuit model for a 100 Ah Lithium Polymer Battery that takes into account the effect of temperature and discharge rates. This is done by studying the behavior of two advanced 100 Ah Lithium Polymer Battery cells under different load condition and at different temperatures, to extract the RC parameters needed to develop the equivalent circuit model. This paper presents a methodology to identify the several parameters of the model. The parameters of the circuit model depend on both, battery cell temperature and discharging current rate. The model is validated by comparing simulation results with experimental data collected through battery cell tests. The simulation results of the battery cell model are obtained using MATLAB, and the experimental data are collected through the battery test system at battery evaluation lab at University of Massachusetts Lowell. This model is useful for optimization of the battery management system which is needed to run a battery bank safely in an electric car.
1. Introduction
Battery powered electric vehicles are becoming more and more attractive with the advancement of new battery technology that have higher power and energy density, and it becomes necessary reliable models for design and simulation of the batteries. 100 Ah Lithium Polymer Battery cells have been tested for cycling, fast chargeability, realistic load test, self discharge, and life cycle. From these test results, the battery has high energy density (373 Wh/L) and specific energy (146 Wh/kg), less self discharge rate (less than 3% during month), it can be fast charged, and the battery cell voltage remains within the limit during the realistic load test. The battery cell has a long life cycle, more over the battery capacity decreased very slowly with cycling. The lithium polymer battery cell is much lighter than other batteries cell and it is one of the long term criteria for electric vehicle batteries (energy density greater than 300 Wh/L, life cycle over 1000 cycles, and recharge time between 3 to 6 hours) [1].
Two 100 Ah Lithium Battery cells were tested for model. One is old battery cell which the battery has only 90% of total capacity and the other one is new battery cell which has fully 100% of capacity. The old battery cell lost more than 10% of total capacity because the battery was cycled more than 700 times. The reason to pick a new and an old battery cell for the test is to find how the battery SOC characteristic changes by battery cell age and capacity. The circuit model represents the nonlinear relationship between SOC and the open circuit voltage (Voc) of the battery cell. The model also demonstrates the constant and dynamic behavior of the battery cell using a series resistance and RC circuits. The battery cell model component values vary as a function of SOC. All the models that have been derived in the past, considered effect of discharge rate on model components but this model consider the rate of discharge effect as well as the temperature effect. The accurate circuit model will be very helpful for Battery Management System (BMS) design because SOC information makes power sourcing or sinking, safe and efficient, and it also helps to extend the lifetime of the traction battery. More detailed study of battery cell circuit model and simulation will be discussed in following topics.
2. Battery Testing and Circuit Model
2.1. Test Setup
The University of Massachusetts Lowell Battery Evaluation Lab has three complete battery test systems. The systems are computer controlled. The systems are designed to test batteries ranging from 0.1 mV to 20 volts at 1 mA to 320 Amps. The current regulators are capable of current sinking or sourcing and can change from charge to discharge mode instantaneously [2]. Data acquisition and control systems provide a controlled current and stores data including voltage, current, resting time, and temperature. Data is taken every 5 sec. so as to limit the storage space required. Each tester is controlled via A/D and D/A interfaces. The battery test system also equipped with temperature chamber to test the battery at different ambient temperatures between −40˚C to +60˚C. Temperature of chamber is computer controlled. The voltage, current, and temperature limit of the battery cell can set during the initial set time. The test stops automatically when the battery cell reaches the limit [3]. The MUX connected to the computer, current regulator, and chamber. The battery cell is inside the chamber and it connected to the current regulator. The picture of battery lab at University of Massachusetts Lowell is shown in Figure 1 and the block diagram of the battery cell test is shown in Figure 2.
2.2. Battery Cell Circuit Model
Battery cell circuit diagram is shown in Figure 2. Voc is the open circuit voltage which depends on VSOC. Rs is DC resistance, Cb is capacitance of battery cell, Rd is resistance of self discharge, R(short) and C(short) are the resistance and capacitance in the shorter time constant RC circuitand R(long) and C(long) are the resistance and capacitance in the longer time constant RC circuit. The voltage controlled by voltage source linking the two circuits is used to represent the nonlinear relationship between the State of SOC and Voc of the battery. This relationship is normalized such that when the voltage across Cb is 1 V, the battery is at 100% SOC [4]. From Figure 3, effect of transient components R(short), C(short), R(long), and C(long)are visible at the start of constant discharge. After short time of period, decided by R(short) C(short) and R(long) C(long) time constant, circuit behaves as resistive circuit. The simulation results of Rs and Voc are based on polynomial equations and depend on State of Charge. Values of R(short), C(short), R(long) and C(long) change abnormally but depend on State of Charge. Equation for Rs and Voc for simulation can be written as:
 (1)
(1)
where, n is polynomial number, SOC is state of charge,  is constant of different ambient temperature and discharge current rate,
  is constant of quadratic equation for combine different temperatures, k is constant for constant 0 (for 0˚C @ 1C and for C/10 discharge rate) 2 (for 20˚C @ 1C and for C/4 discharge rate) 4 (for 40˚C @ 1C and for C/2 discharge rate), and Δ is difference between different temperature and different discharge rate.
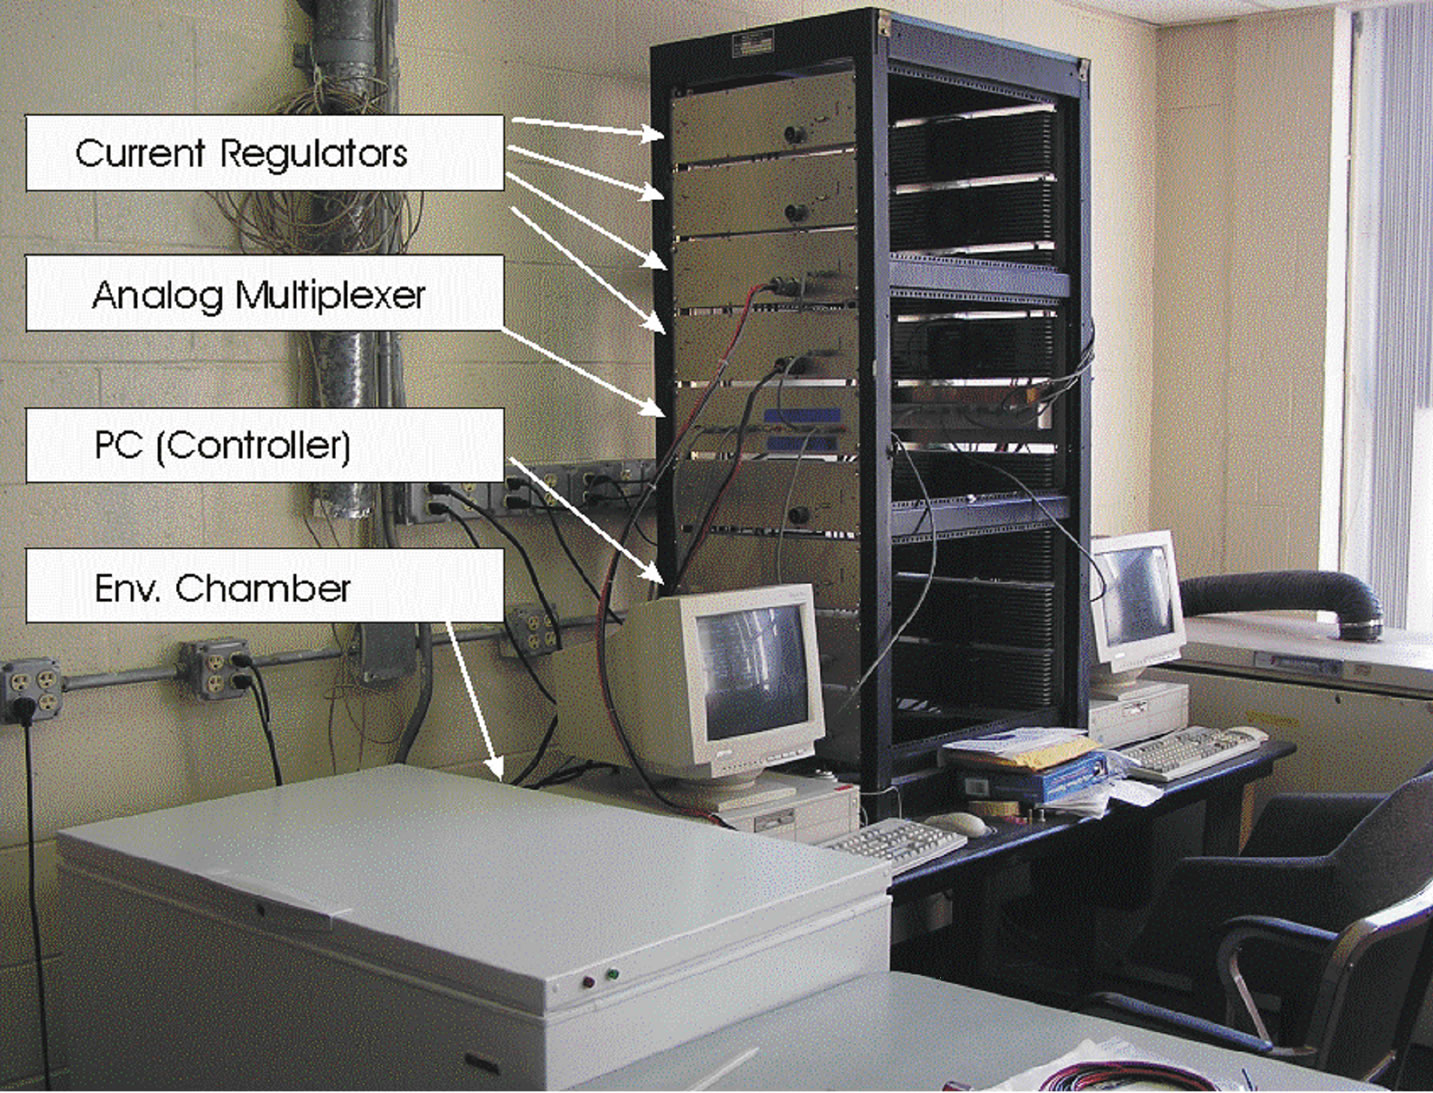
Figure 1. The battery lab at University of Massachusetts Lowell.
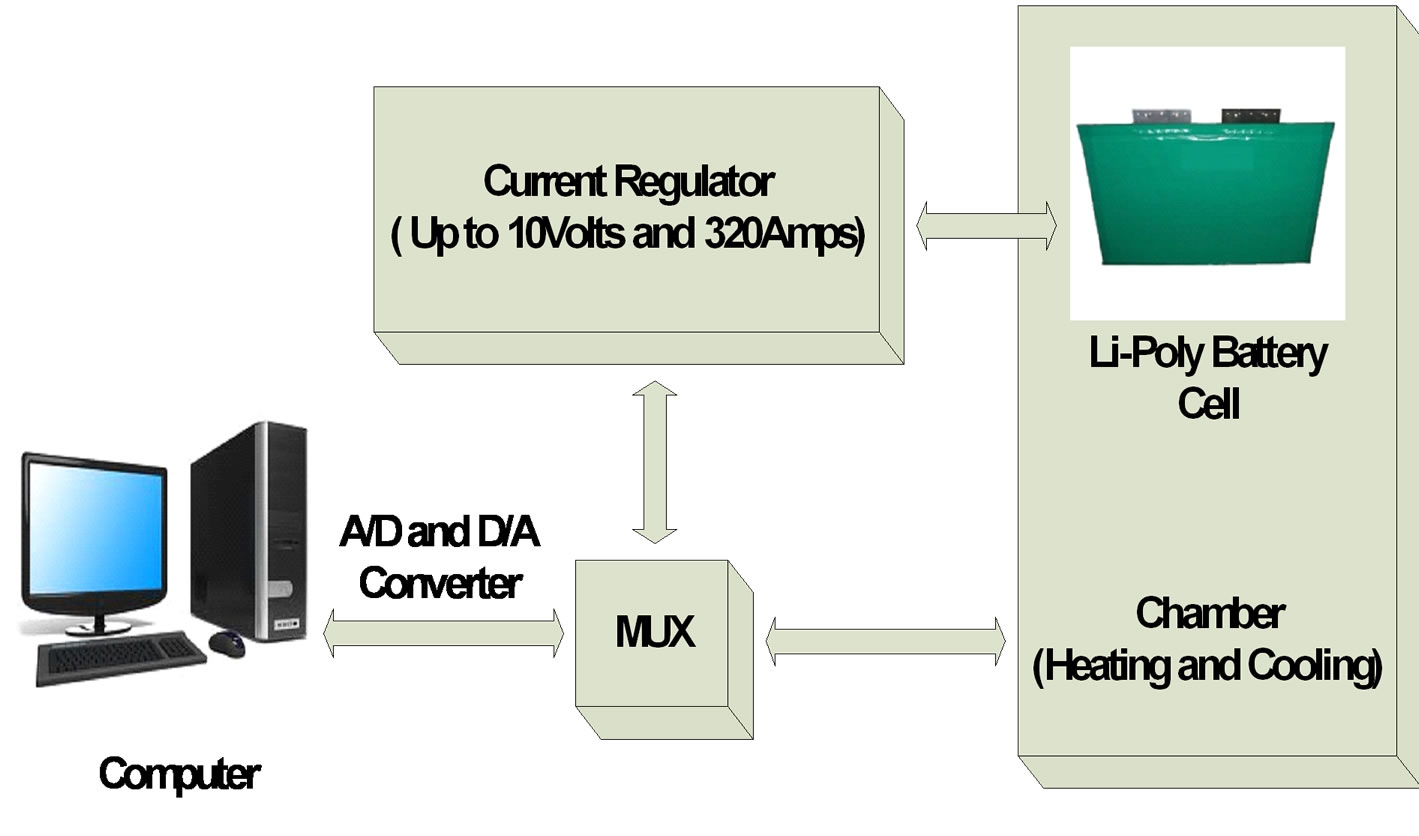
Figure 2. Block diagram of the battery cell test.
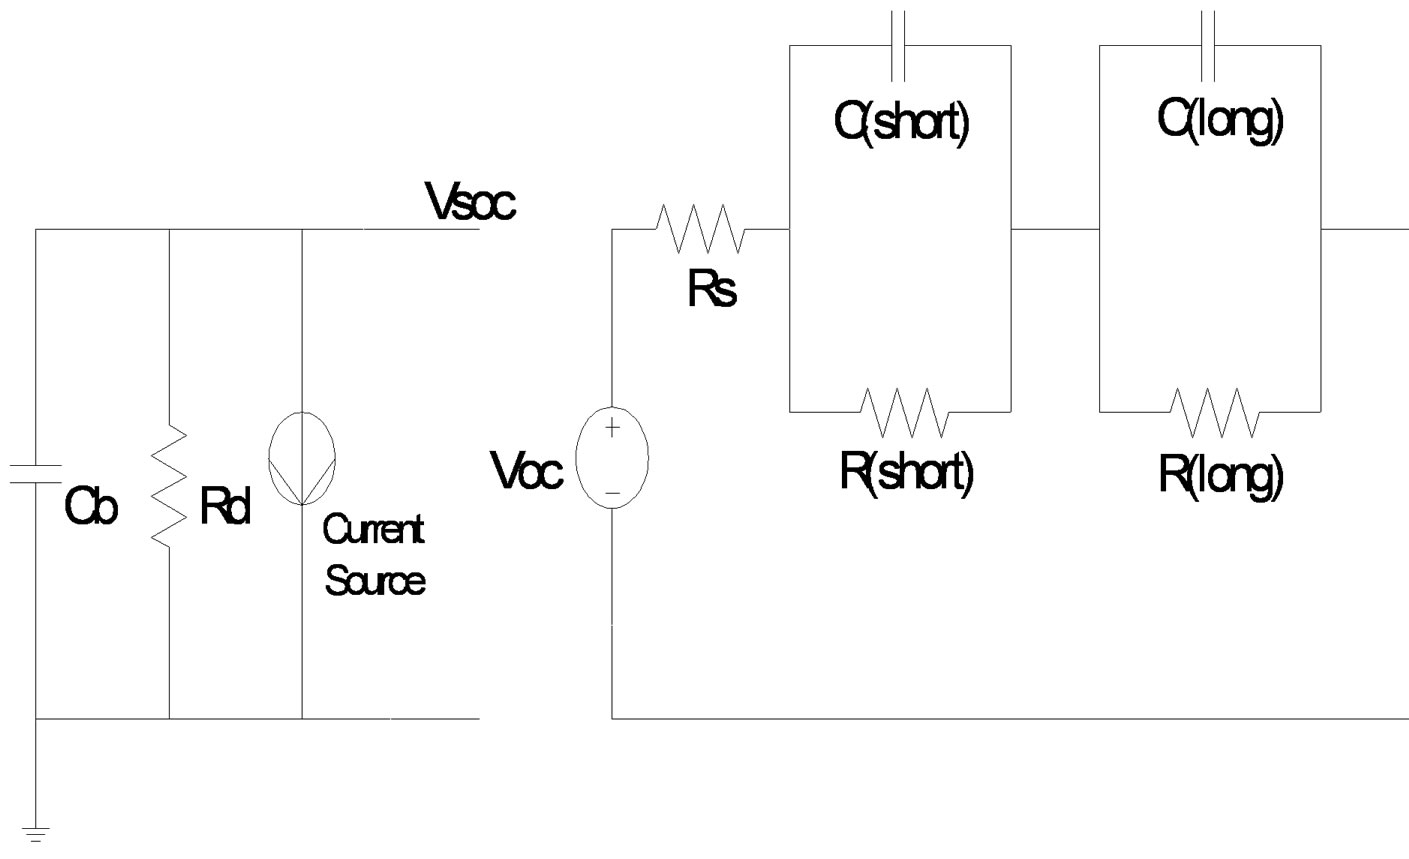
Figure 3. Li-Poly battery cell circuit diagram.
The value Δ and constant a at different temperatures discharge current rates are shown in Tables 1 to 4. The transient response to a step load current is shown in Figure 4. Vdc is dc resistance voltage, Vs(t) is short time constant voltage, and Vl(t) is long time constant voltage. The experimental and simulation result of the Voc at 0˚C and different discharge current rates for new cell is shown in Figure 5. The experimental and simulation result of the Voc at C/10 and different temperatures for new cell is
Figure 4. Transient response to a step load current.
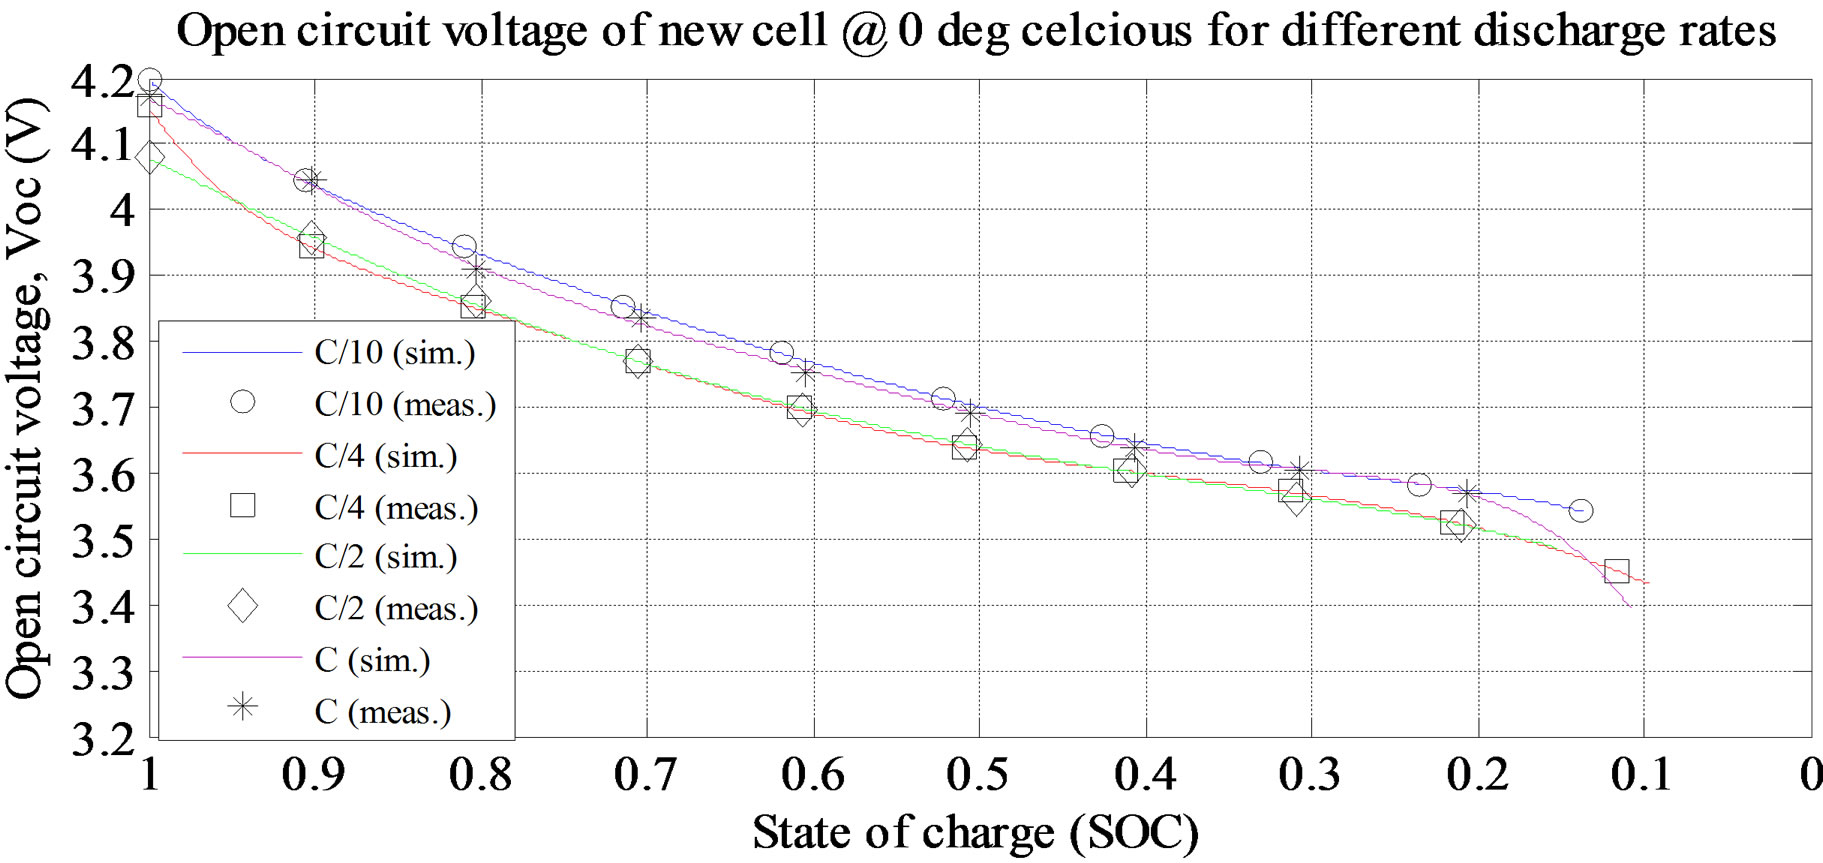
Figure 5. Simulation and experimental result for Voc at various discharge current rate and ambient temperature 0˚C (new cell).
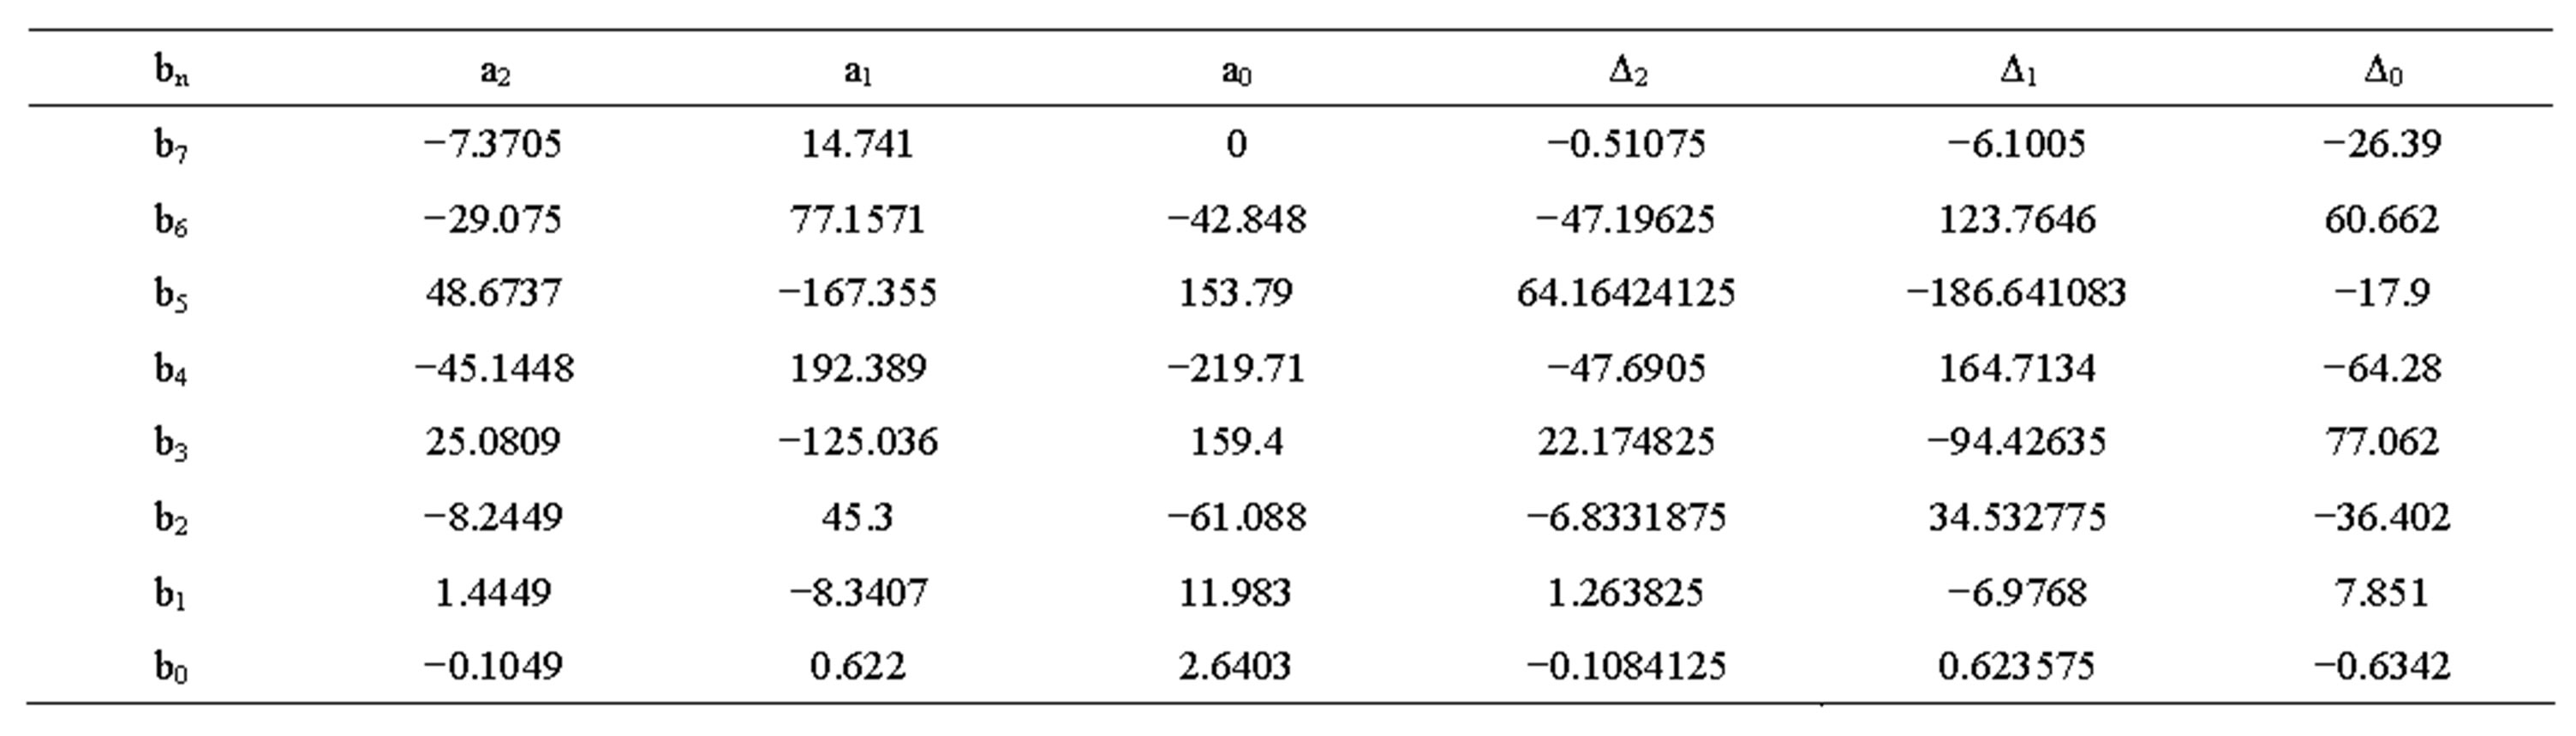
Table 1. Constant values for open circuit voltage of new battery.
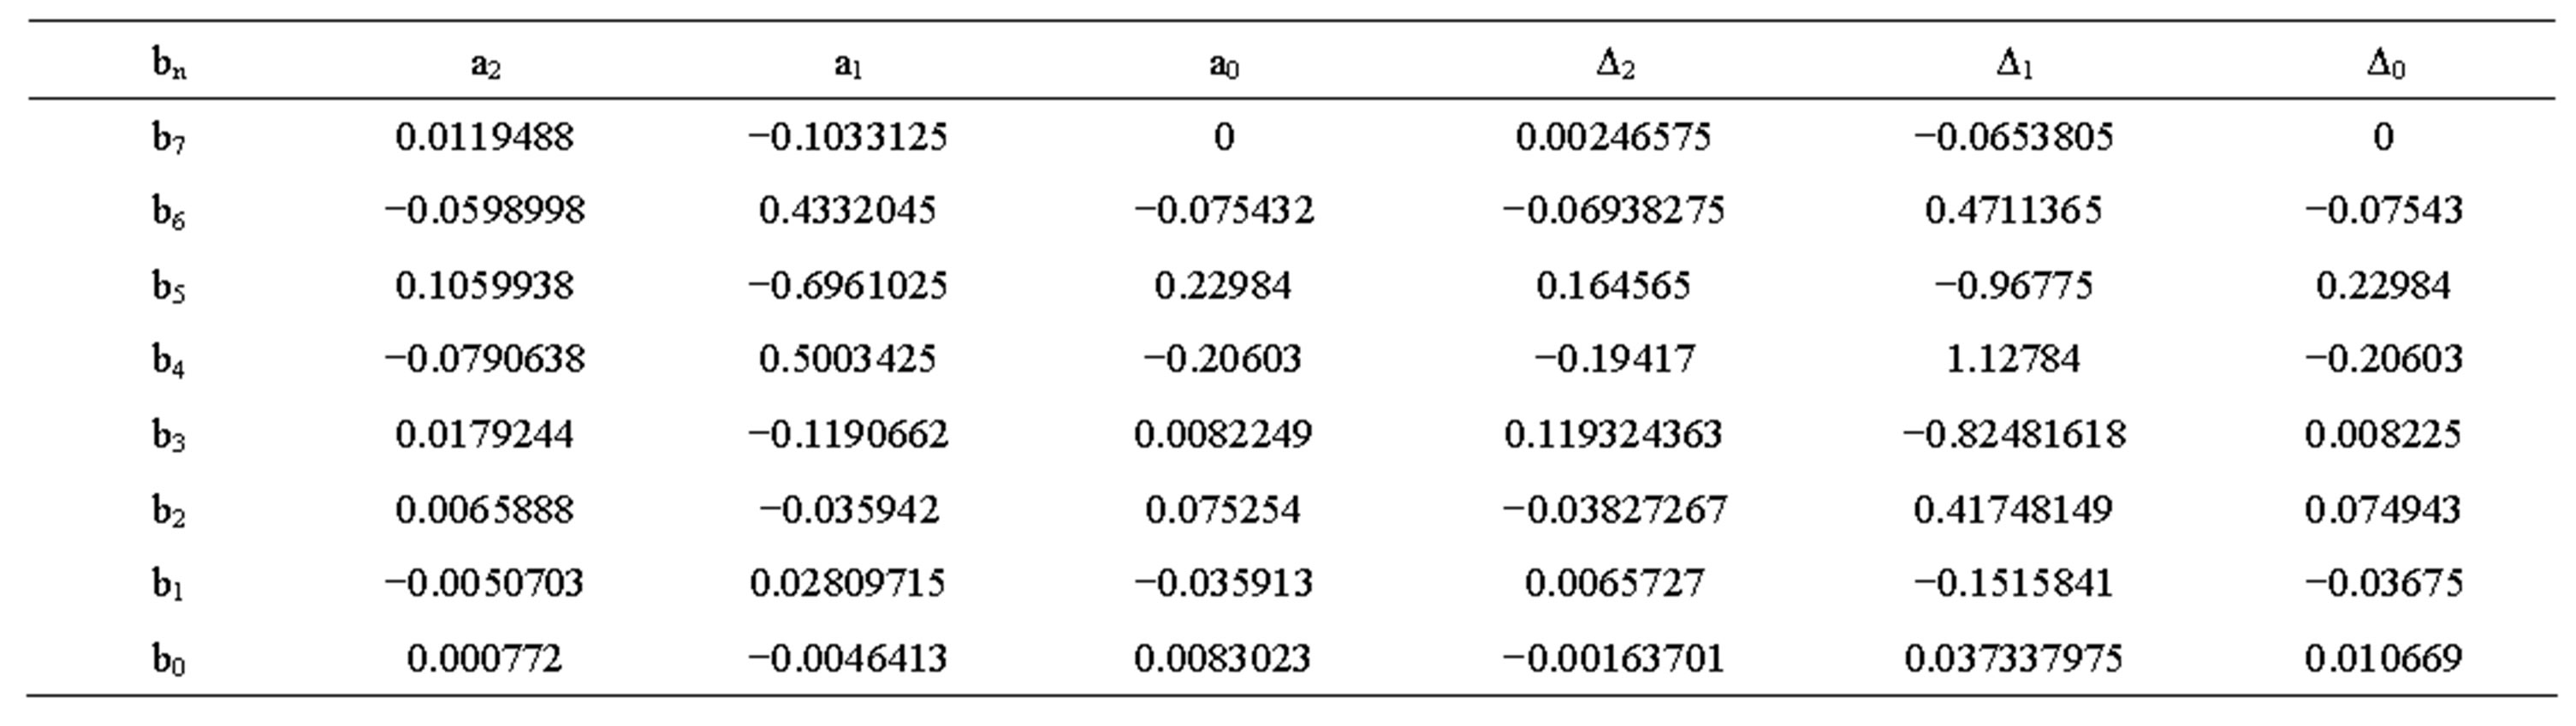
Table 2. Constant values for internal DC resistance voltage of new battery.
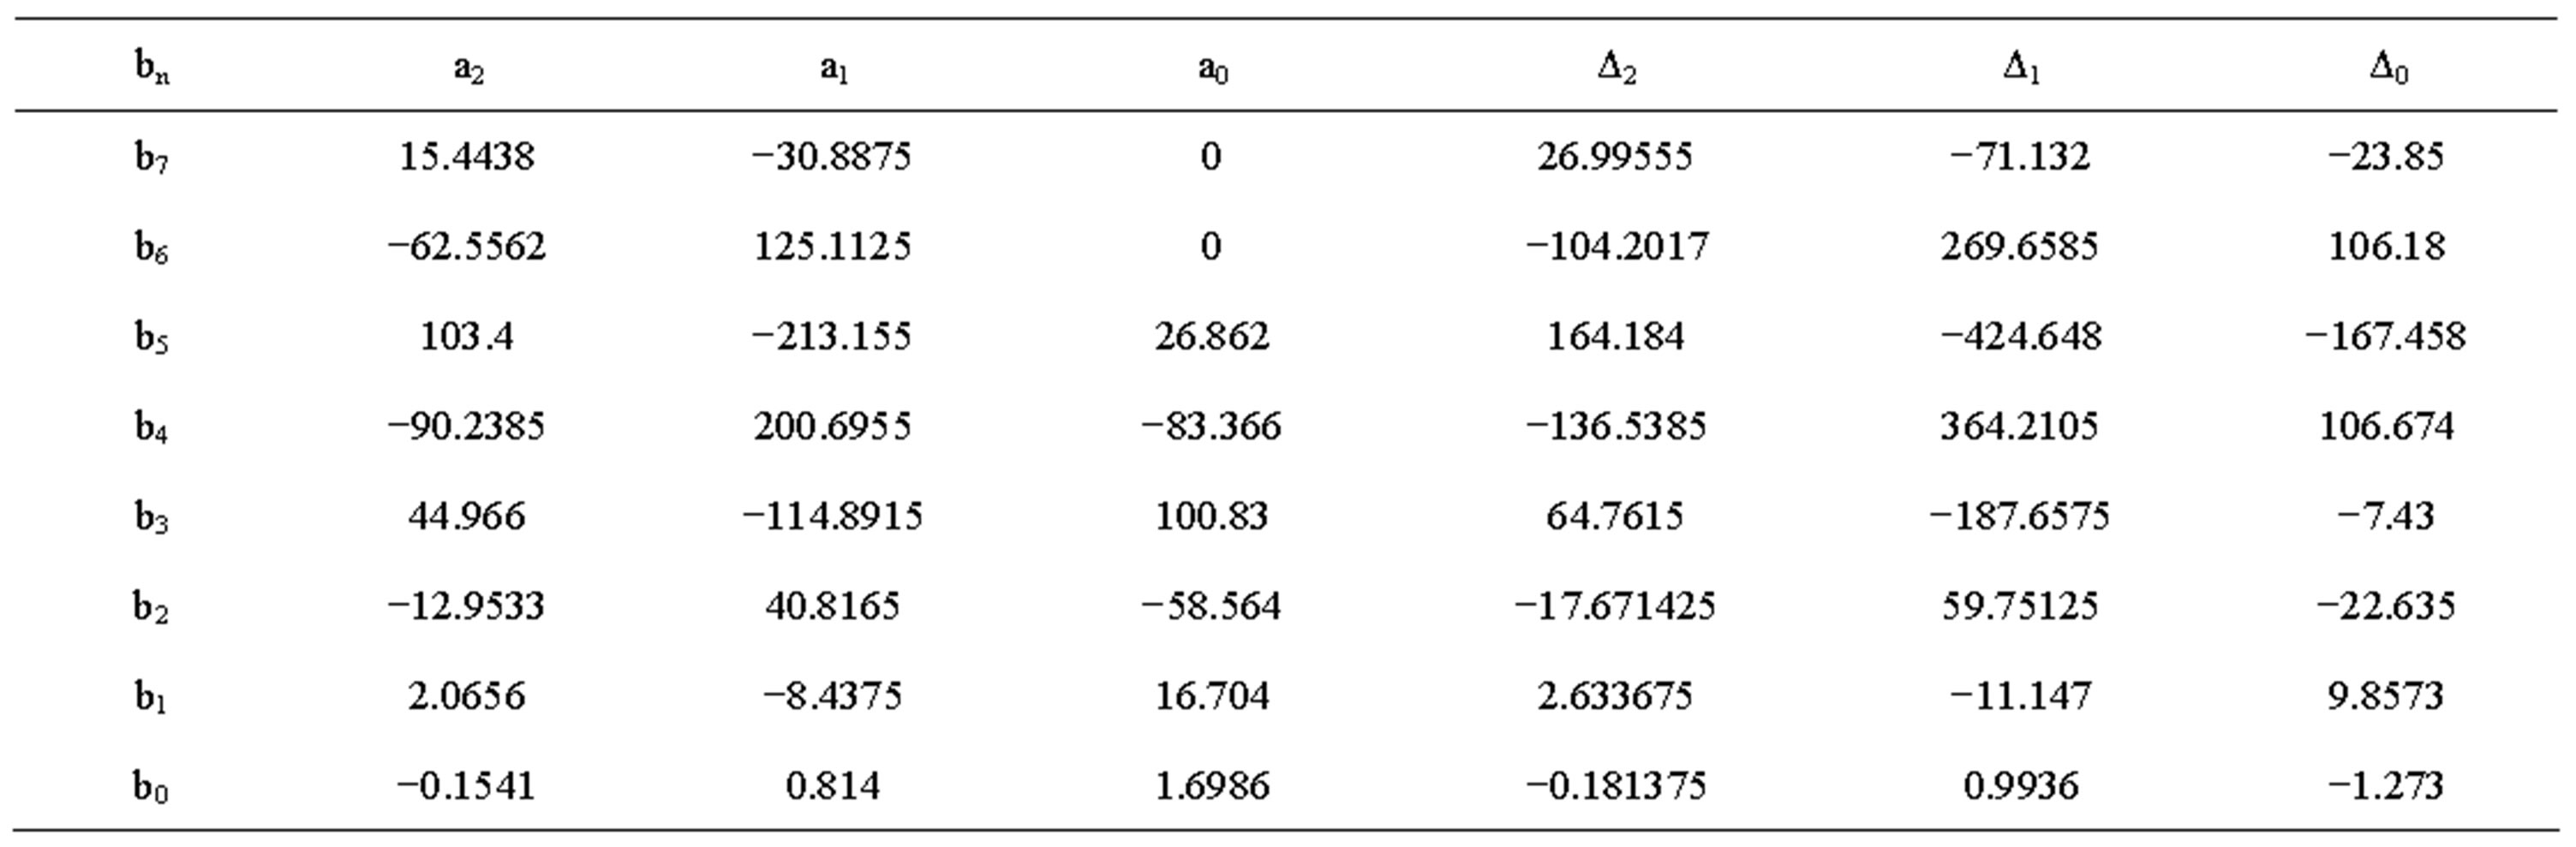
Table 3. Constant values for open circuit voltage of old battery.
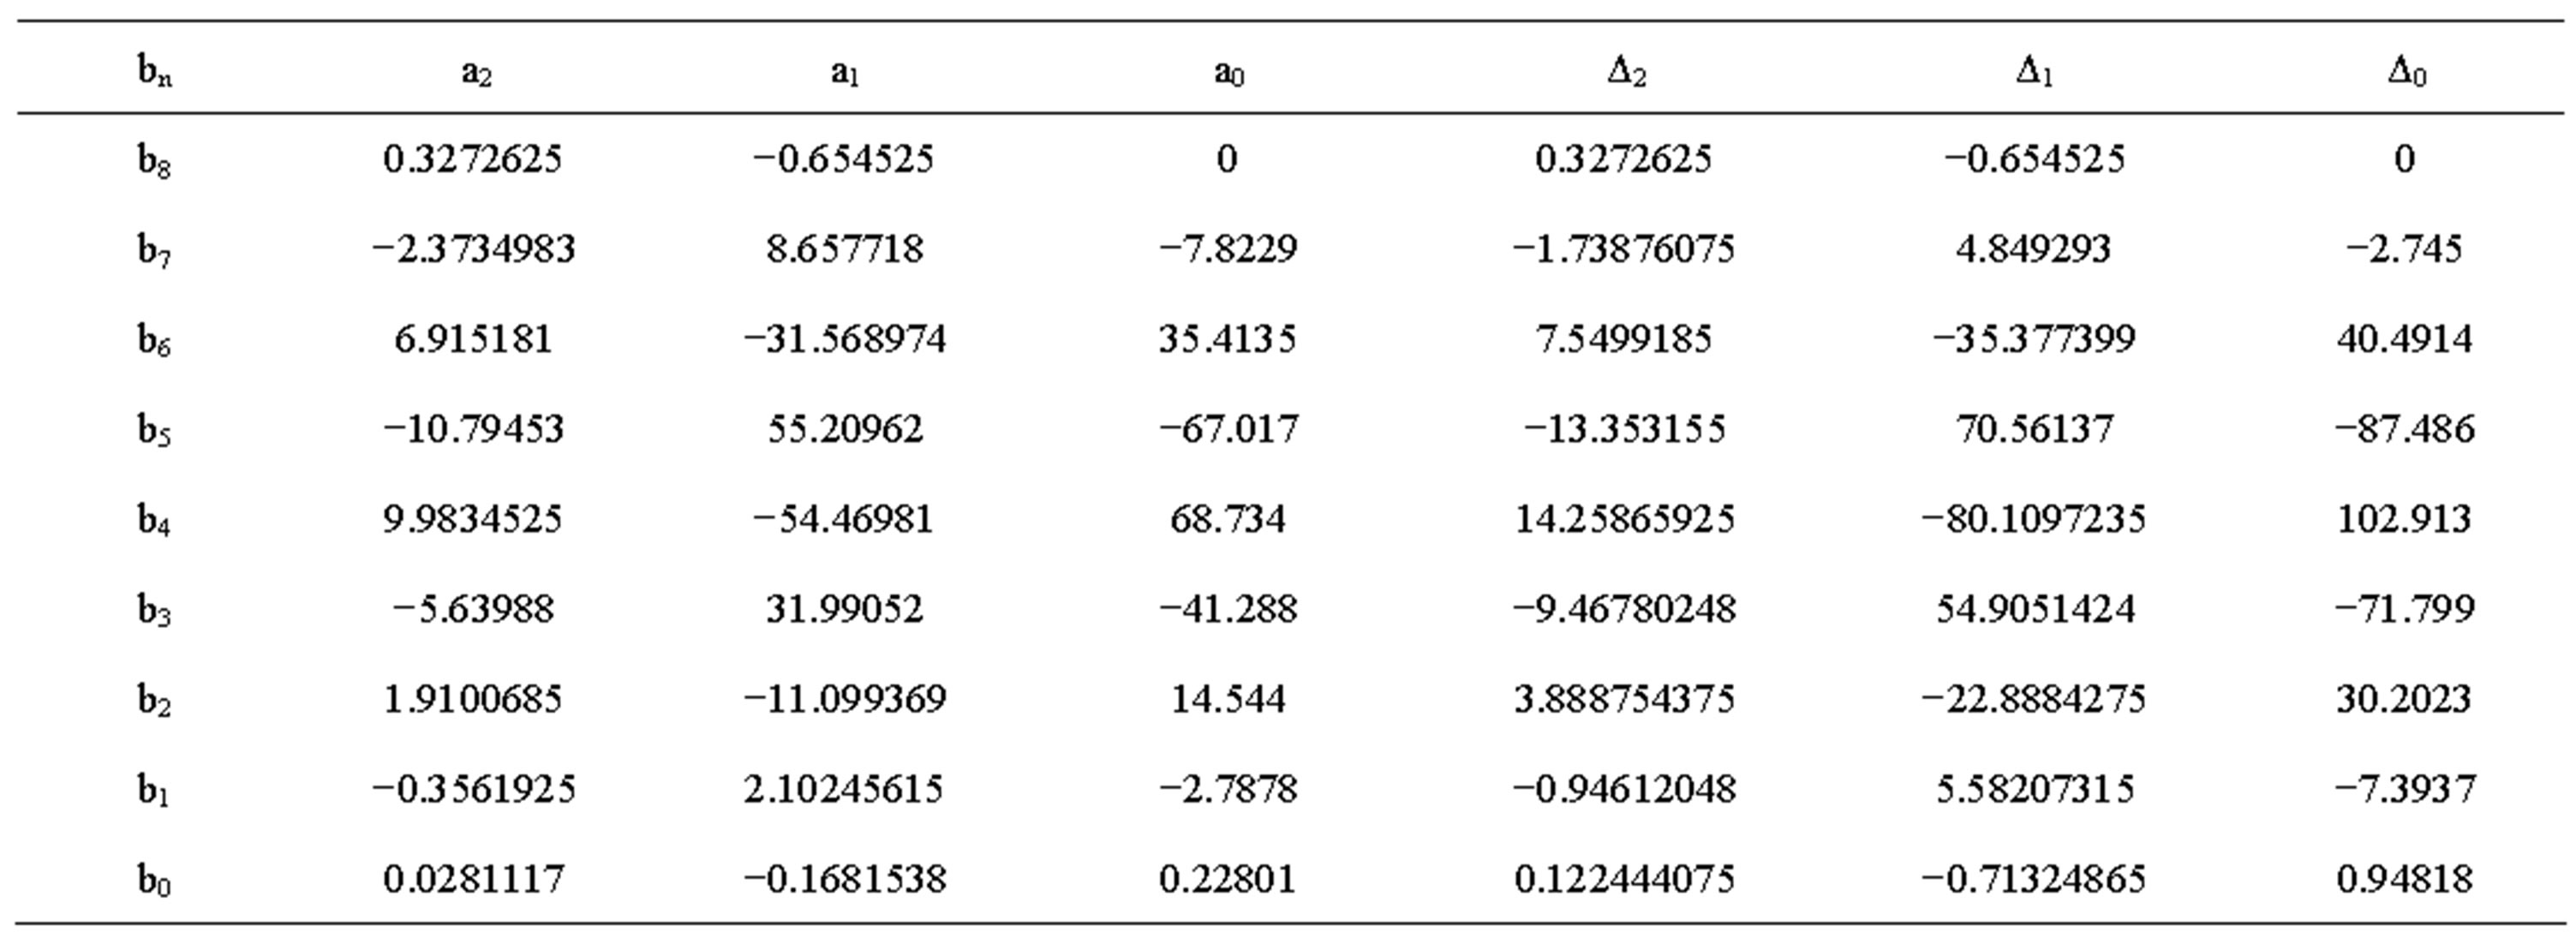
Table 4. Constant values for internal DC resistance voltage of old battery.
shown in Figure 6. From the figures, the Voc is high at room temperature and at lower discharge current rate. The experimental and simulation result of the Rs at 0˚C and different discharge current rates for old cell is shown in Figure 7. The experimental and simulation result of the Rs at C/10 and different temperatures for old cell is shown in Figure 8. From the figures, the Rs is high at lower temperature and lower discharge rate. Rs sharply increase at the lower SOC (10%).
2.3. The Discharge Test Methodology
Each battery cell, new and old, has 12 different test settings which are 3 different ambient temperatures (0˚C, 20˚C, and 40˚C) and each temperature has 4 different discharge rates (C/10, C/4/, C/2, and C). The battery cell is first charged to its full capacity through constant current followed by constant voltage (CC/CV) at 1C (100 Amps) and it starts temperature soak until the cell gets to the set temperature. The battery cell discharged under different predefined profiles. The cell stops discharging at decrement of 10% SOC, decrement in the range from 100% to 0% and the cell has resting time for 10 minutes. The resting time is needed for the battery cell voltage to reach steady state condition [5]. The test completely stopped when the battery cell reachesat0 capacity. The open circuit voltage is measured as the steady state open circuit terminal voltage at various SOC points. The performance of the battery cell during the discharge at 1C discharge rate and 20˚C is shown in Figure 9.
2.4. Constant Current Discharge Test
The battery cell is first charged to its full capacity through (CC/CV) and its tarts temperature soak until the battery cell gets to the set temperature. The battery cell discharged under different predefined profiles. The battery cell completely stops discharge if it reaches at 0 capacity. The battery cell performance at constant discharge current rate of C/2 and ambient temperature at 0˚C is shown in Figure 10. From the figure, the SOC of cell drops from a certain value to 0 as the cell output voltage goes from full capacity voltage to cut off voltage. The SOC of the full charged battery cell varies with discharge current rate, which reflects the current effect. The lithium polymer battery cell maintained a relatively flat
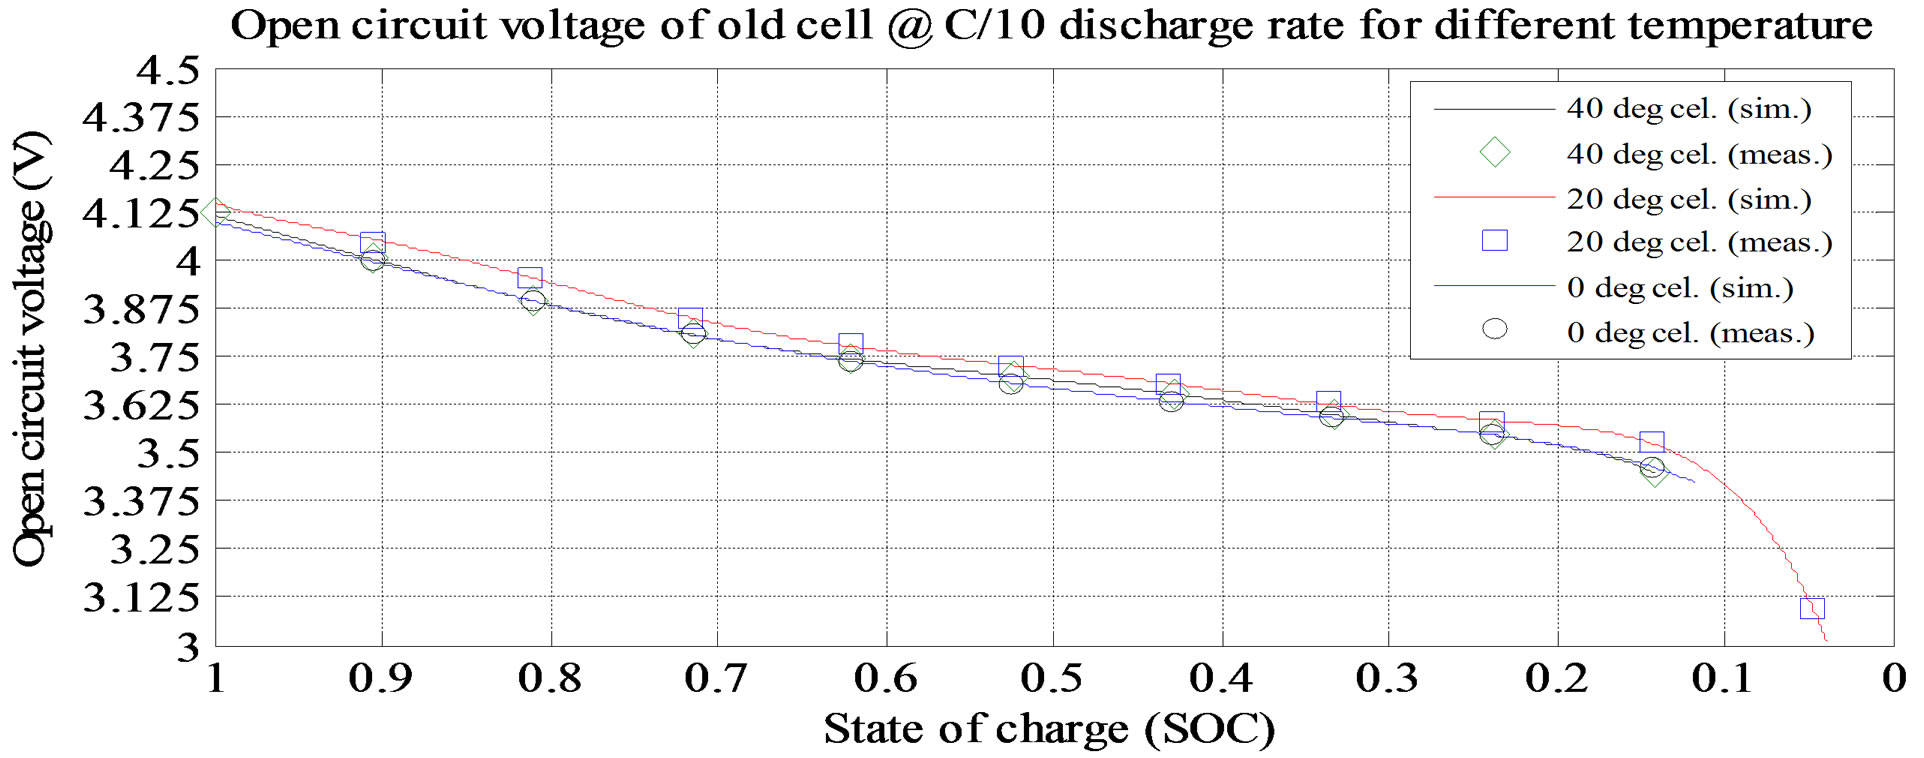
Figure 6. Simulation and experimental result Voc at C/10 and various ambient temperatures (old cell).
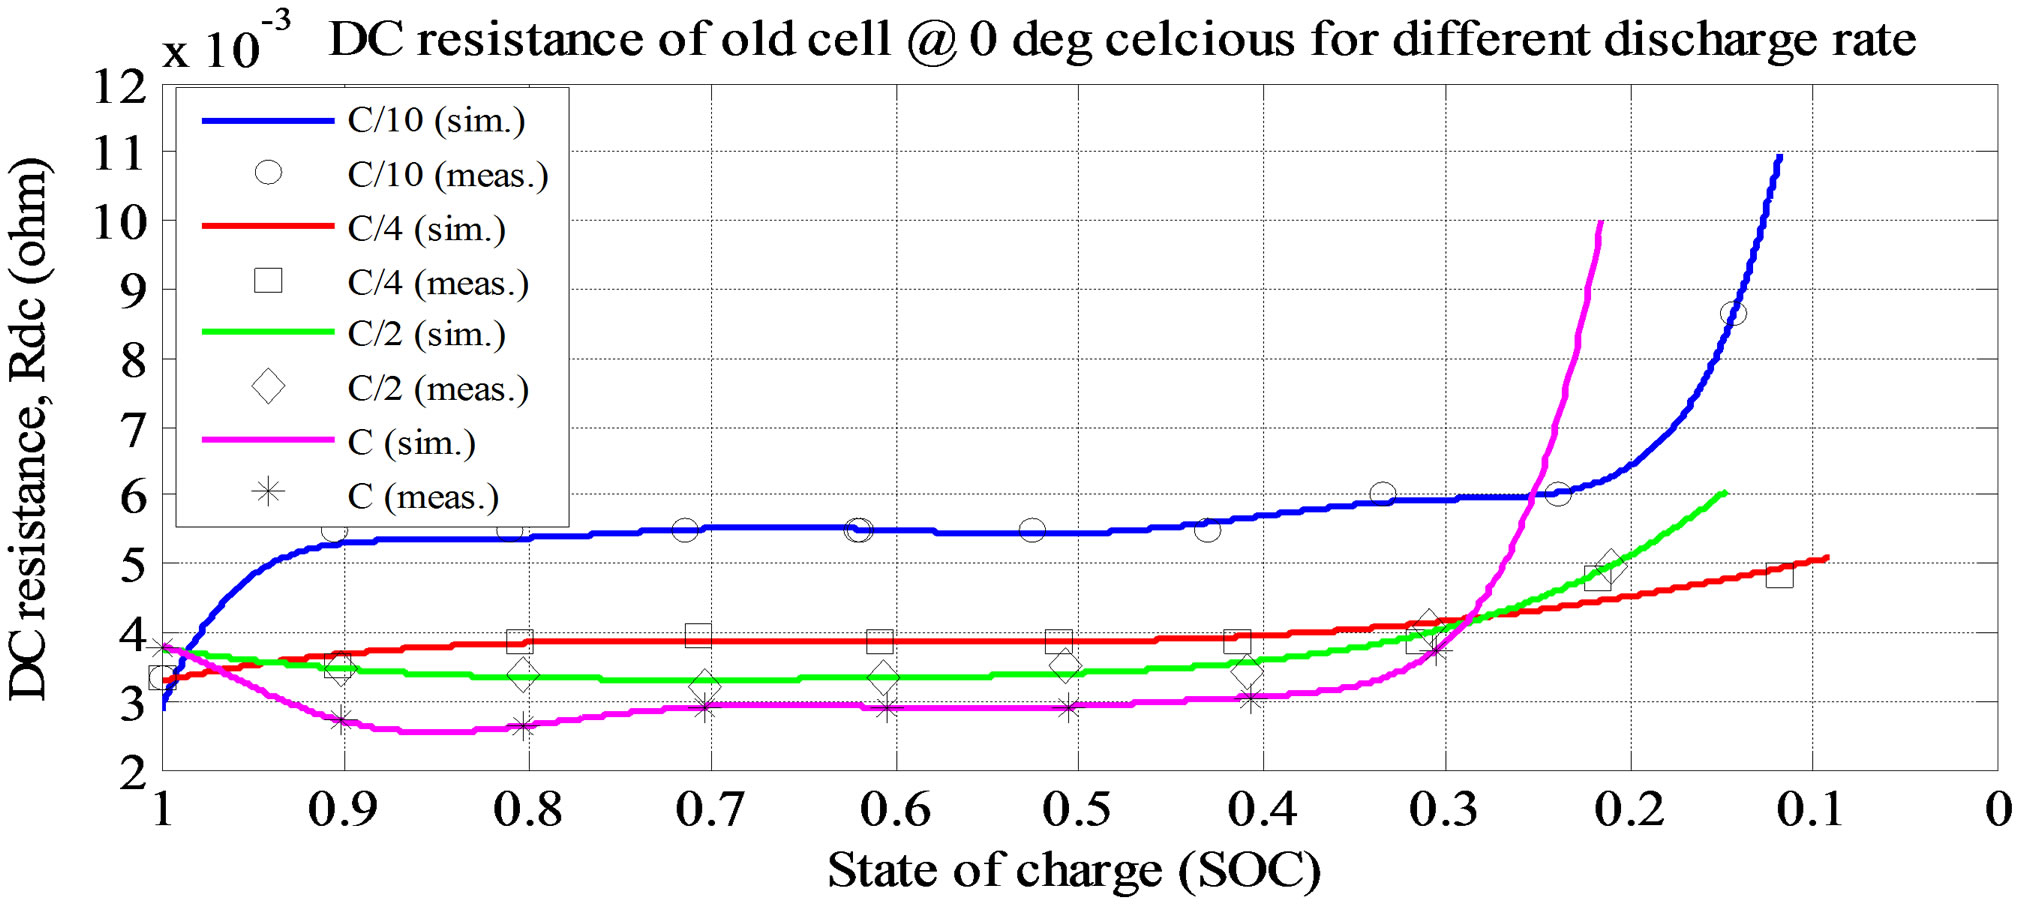
Figure 7. Simulation and experimental result for Rs at variousdischarge current ratesand ambient temperature 0˚C (old cell).
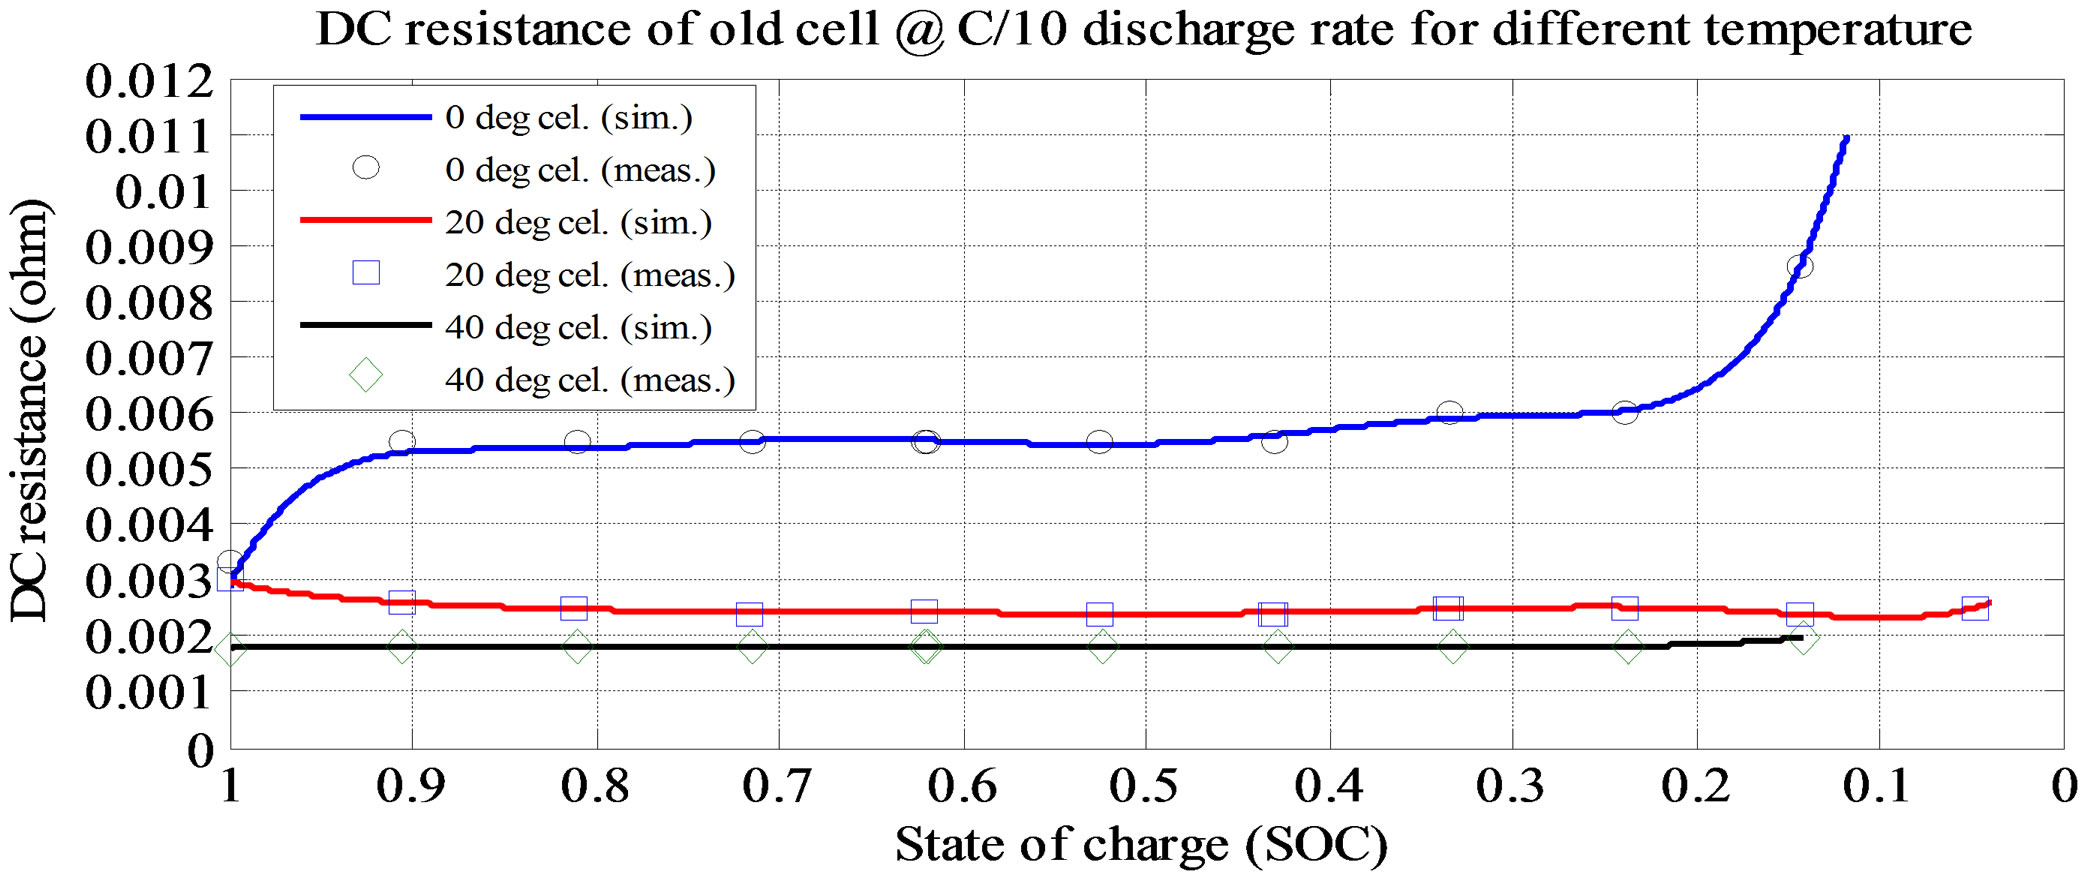
Figure 8. Simulation and experimental result for Rs at C/10 and various ambient temperatures (old cell).
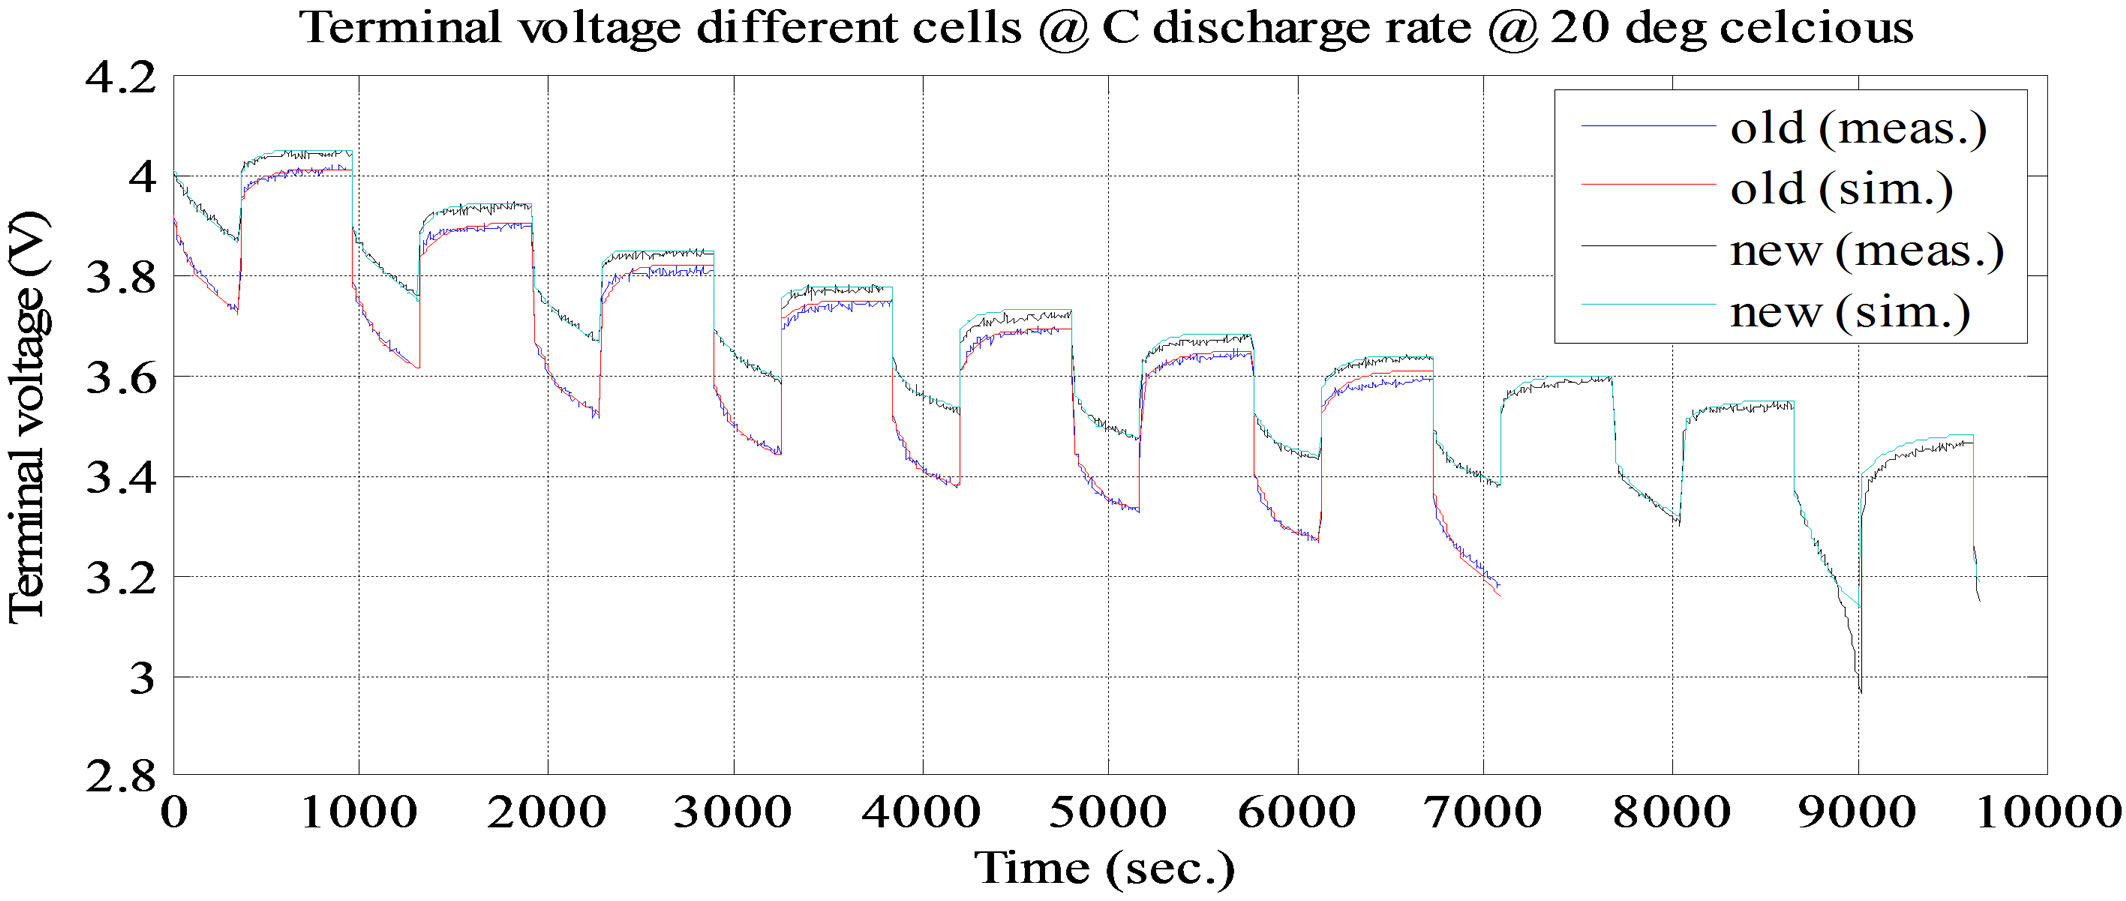
Figure 9. Simulation and experimental pulse discharge test result at C and ambient temperature 20˚C.
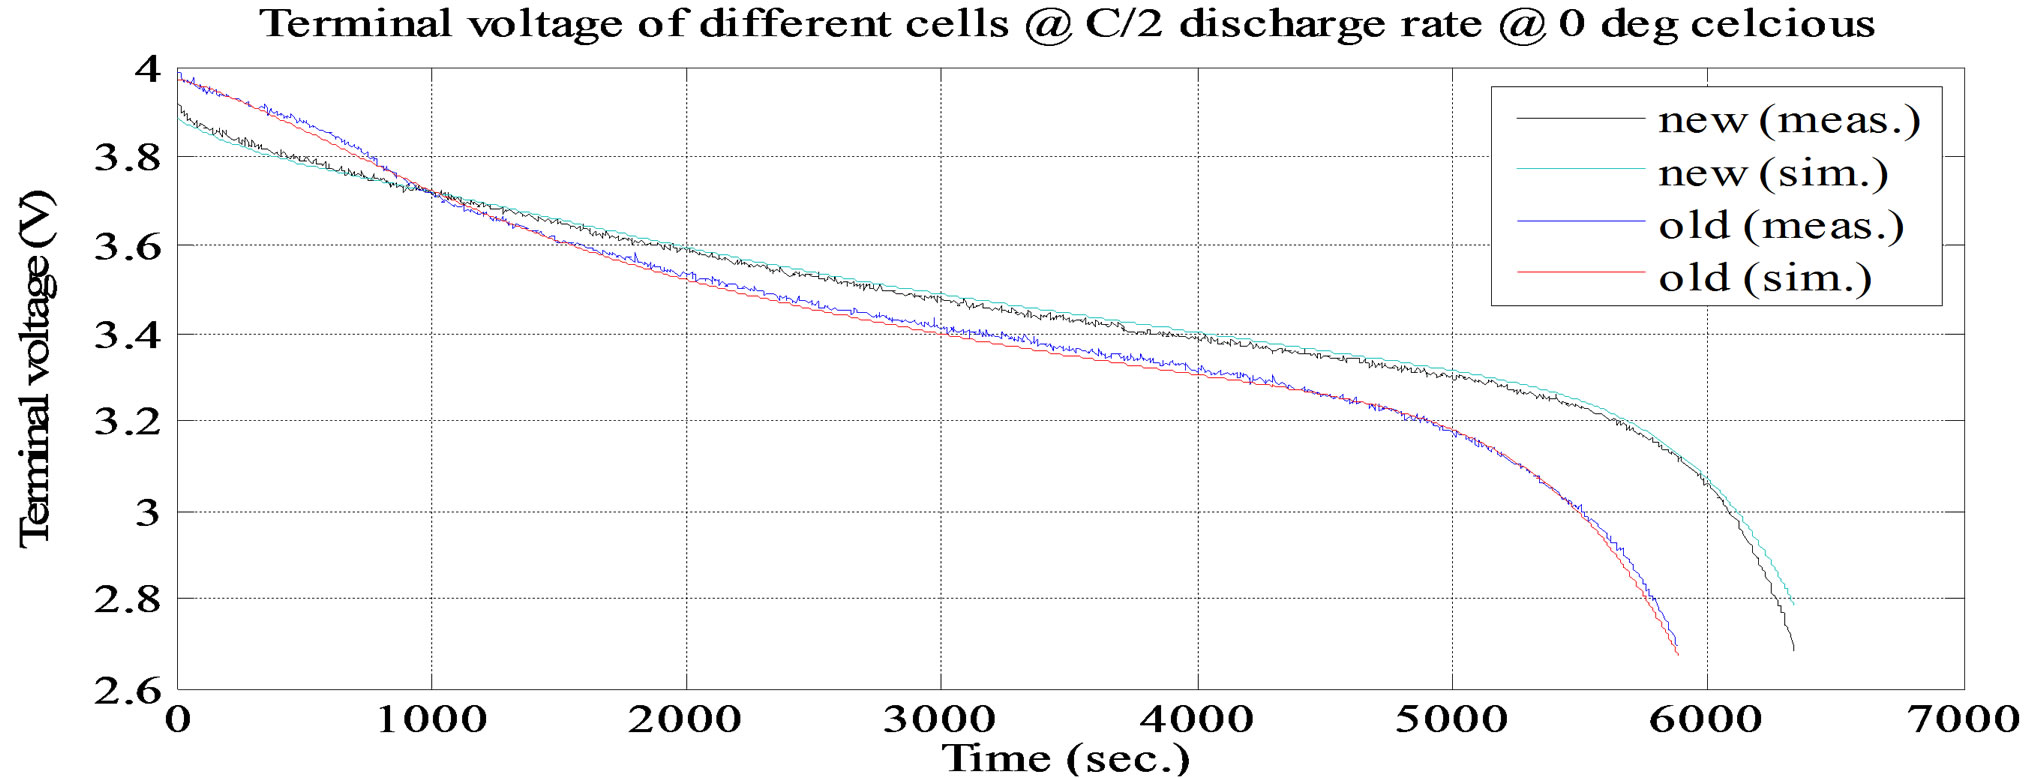
Figure 10. Simulation and experimental constant discharge test at C/2 and at ambient temperature 0˚C.
voltage discharge profile with a steep decrease in the profile near the end of discharge [6].
2.5. Battery Cell Self Discharge Test
The battery cells were tested for self discharge. The cells are first charged their full capacity through (CC/CV) then they were set aside for a month in an open circuit condition at +20˚C. The terminal voltage measured once an every week. The cells were fully discharged after self discharge test [7].The terminal voltage drop was 0.022 volt (4.13 volt to 4.108 volt) for new battery cell and 0.027 volt (4.113 volt to 4.086 volt) for old battery cell. The new battery cell lost its capacity 4 Ah, 67 Wh but it lost 0 Ah, 47 Wh with no self discharge. The old battery cell lost its capacity 2 Ah, 51 Wh but it lost 0 Ah, 37 Wh with no self discharge. The cells lost more capacity 4 Ah, 20 Wh for new and 2 Ah, 14 Wh for old due to self discharge. It shows that the lithium polymer battery cell lost capacity less than 3% per month self discharge. The resistance of self discharge (Rd) can calculated from the Equation (2).
 (2)
(2)
where,  is voltage difference during the test and
is Ah difference during the test.
3. Model Simulation Methodology
Behavior of the battery in static as well as dynamic response is very non-linear. Several simulation methods have been approached. Proposed method is circuit-parameter based procedure of equation solving. The equations are written in MATLAB. Simulation is for discharge only as we have done the test for discharge. Values of current for simulation are directly taken from test results so that accuracy is maintained. For the static response the values of capacitances and resistances depend on SOC. Value of capacitances at that SOC of battery measured from dynamic response are taken. The effect of capacitances, in both the static and dynamic response, die out after the short and long time constants and resulting terminal voltage depends on battery internal dc resistance, short time dc resistance and long time dc resistance. Parameters in the circuit depend on SOC, temperature, rate of discharge. Circuit’s response can be explained by equation which is used for the simulation.
m = initial SOC of the battery before discharge;
Ccapacity = capacity of the battery.
 (3)
(3)
At the start of discharge t = T, terminal voltage is less than open circuit voltage by voltage drop across internal DC resistance. Terminal voltage drops due to resistance of short time dynamic RC branch for t ≤ T. It keeps dropping till the time constant of short time dynamic RC branch. After that terminal voltage drops due to the resistance of long time dynamic RC branch, . It keeps dropping till the time constant of long time dynamic RC branch, after that drop terminal voltage is completely resistive,
 . Voltage drop across the internal DC resistance is significantly high than the latter. The experimental and simulation test result of the battery cell discharge at different temperatures and C discharge rate for new and old cell are shown in Figures 11 and 12. The experimental and simulation test result of the constant discharge at 0˚C and C/4 discharge rate for new and old is shown in Figure 13. From the figure, it observed that the model generate voltage response less
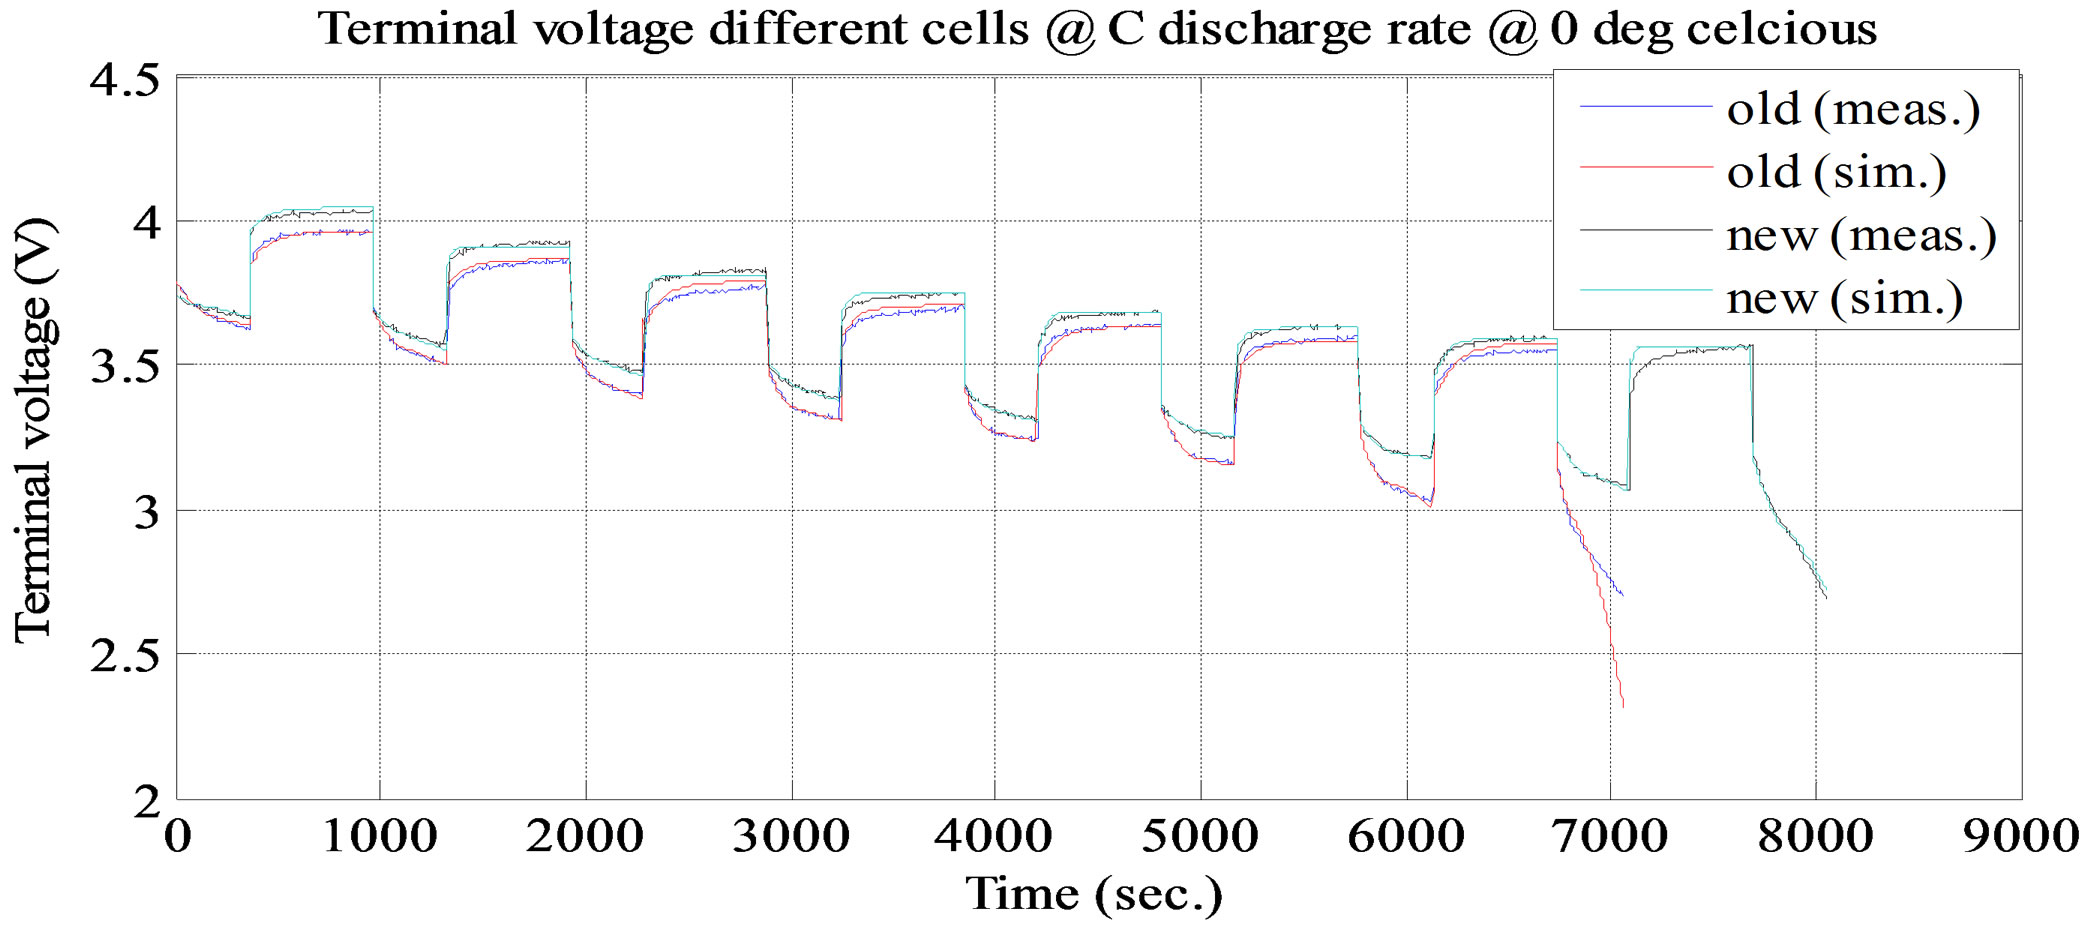
Figure 11. Simulation and experimental pulse discharge test result at C and ambient temperature 0˚C.
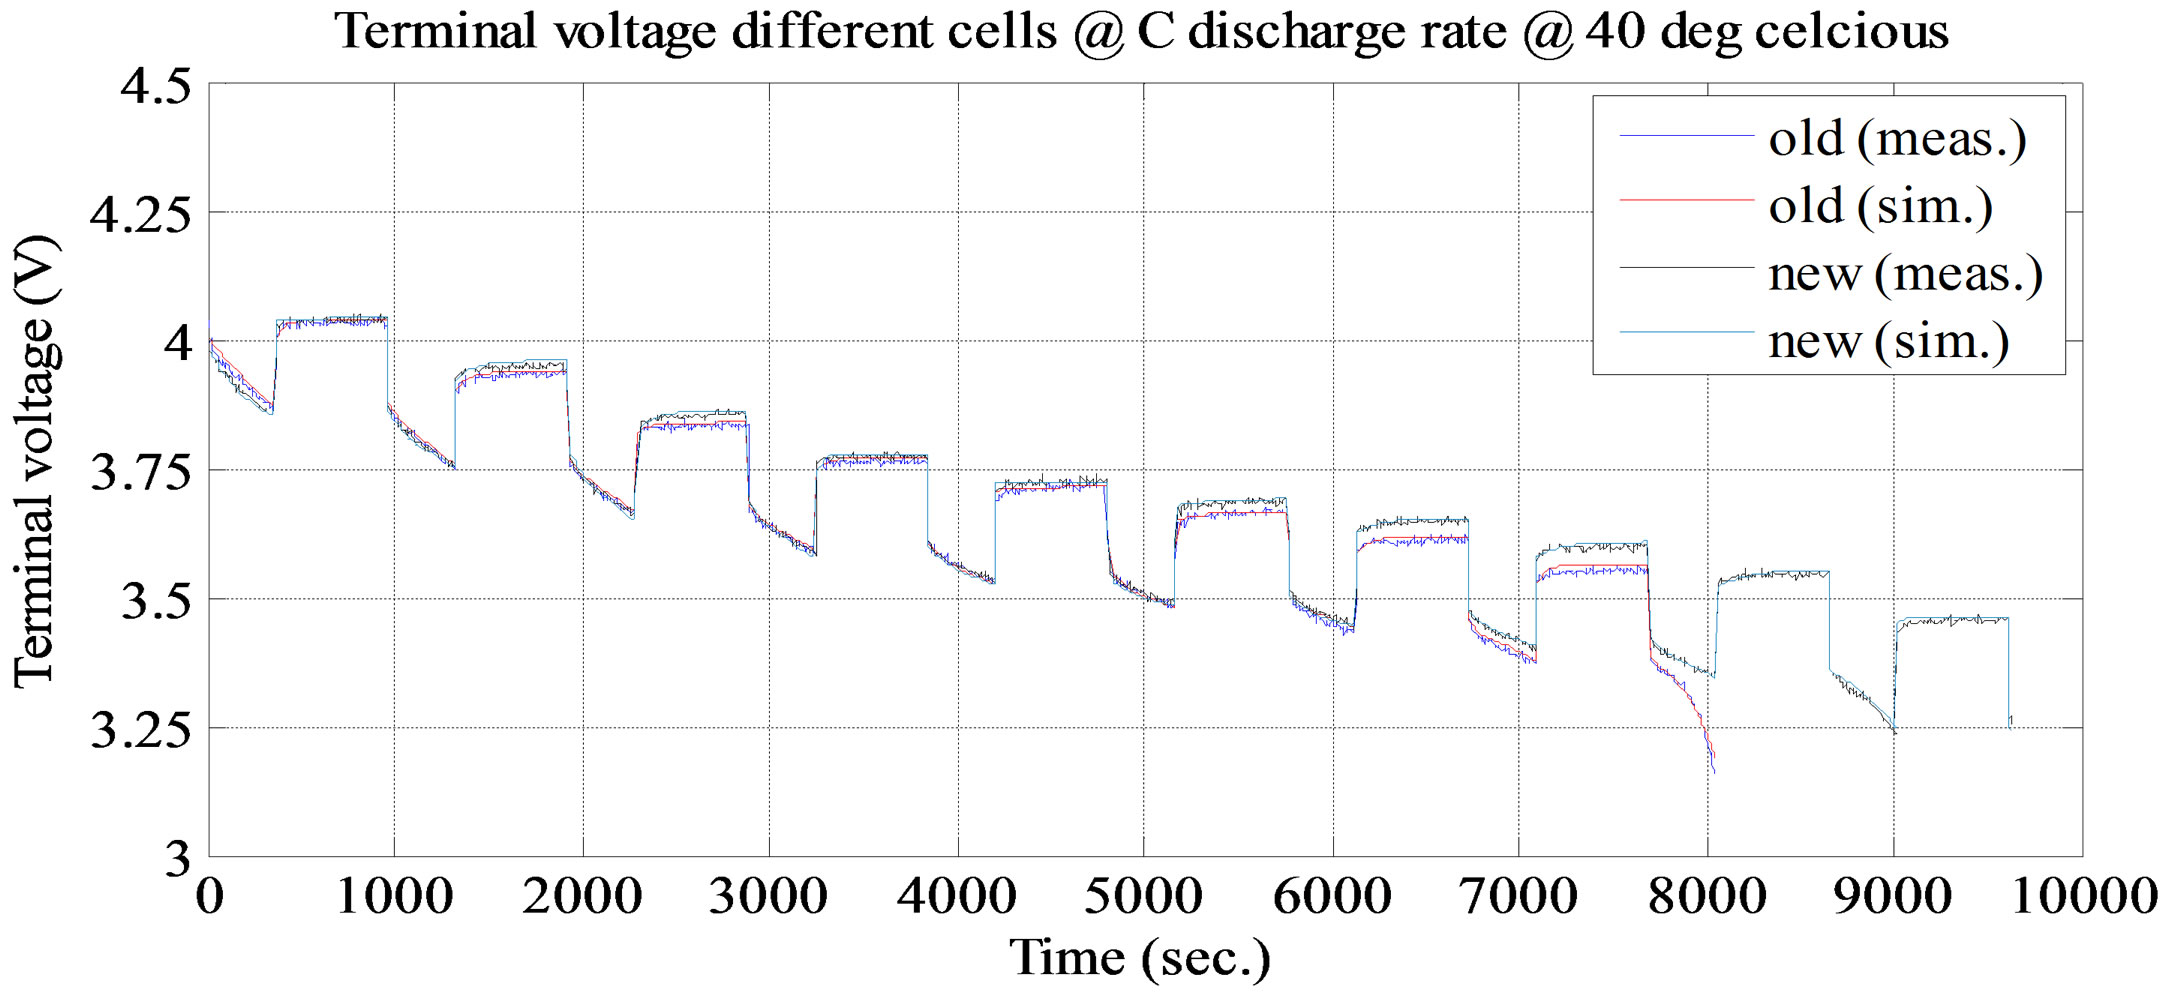
Figure 12. Simulation and experimental pulse discharge test result at C and ambient temperature 40˚C.
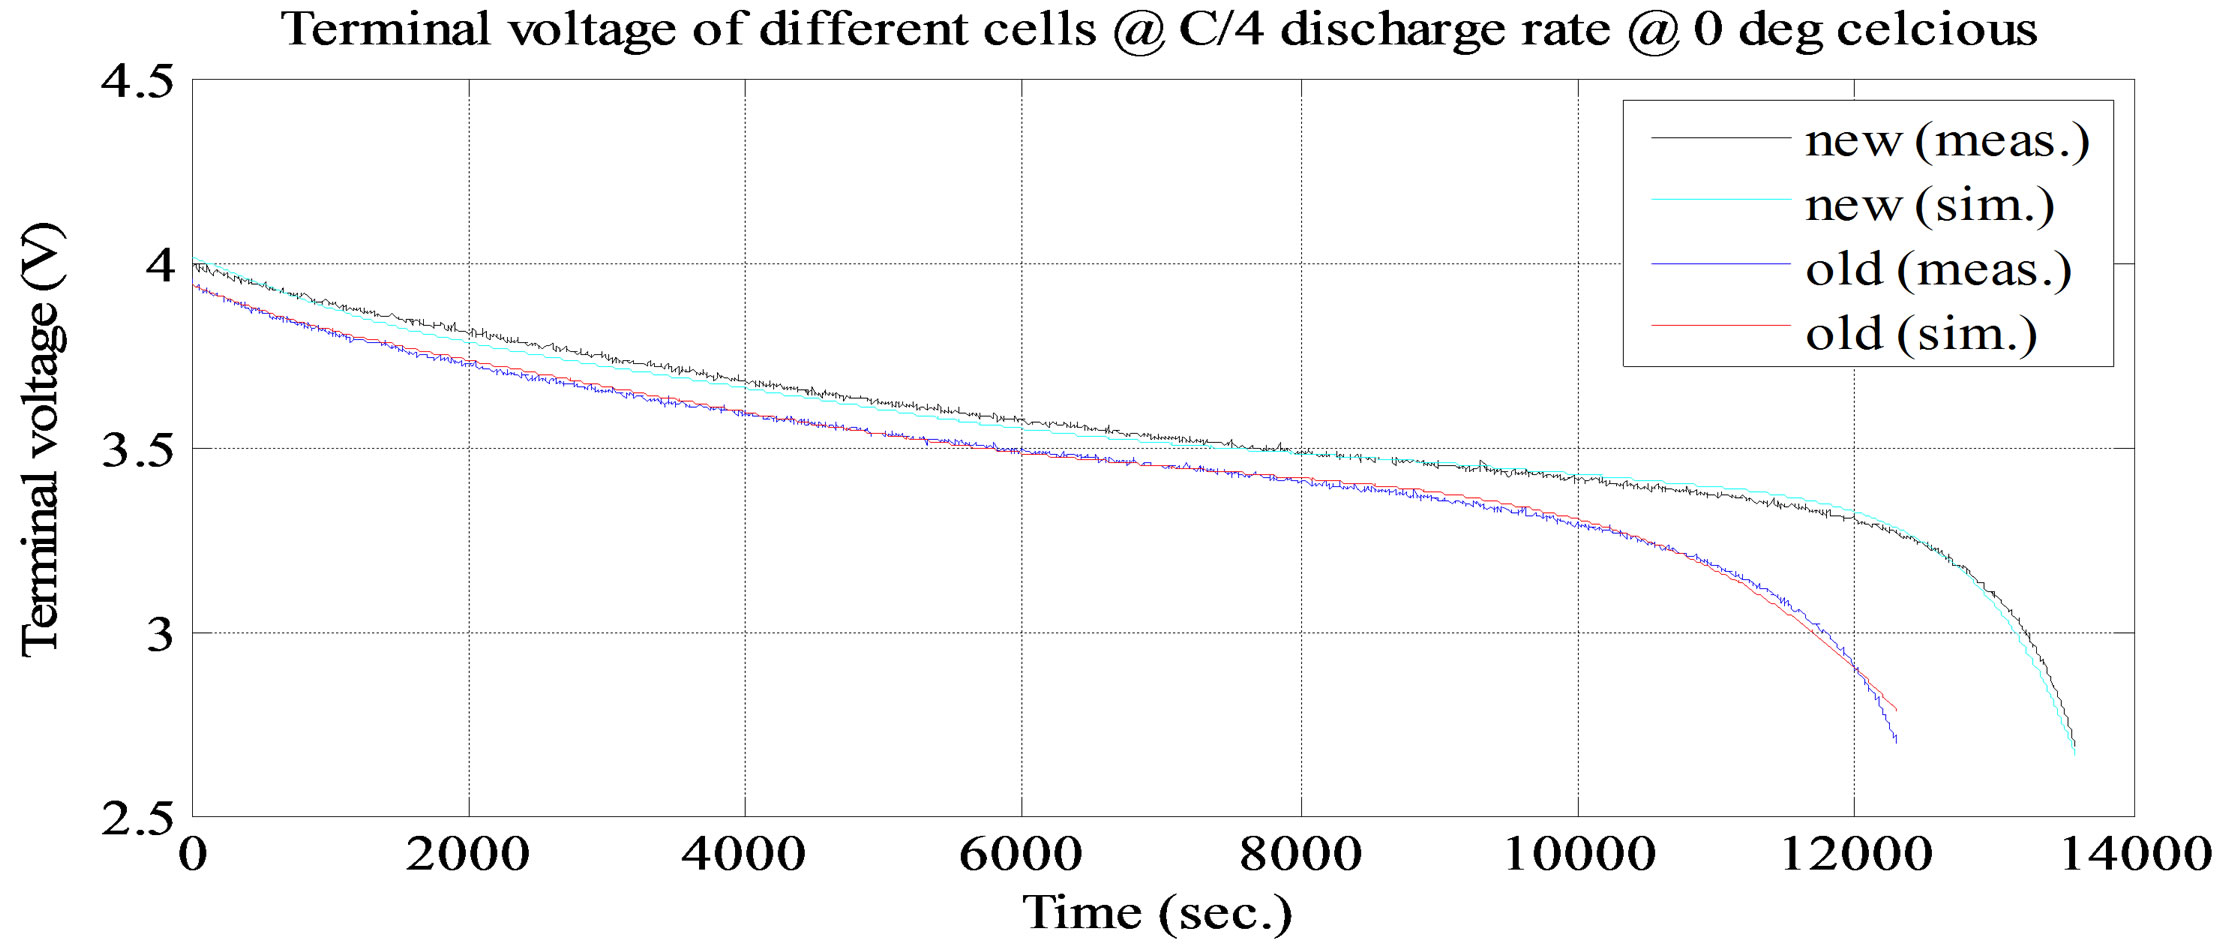
Figure 13. Simulation and experimental constant discharge test result at C/4 and ambient temperature 0˚C
than 30 mV, which is less than 3% error margin. Therefore, the simulation results of the battery cell circuit model match well with the experimental data.
4. Conclusion
A nonlinear battery cell circuit model which is based on relationship between the battery cell terminal voltage and battery cell state of discharge (SOC) characteristic under different discharge current rates and different ambient temperatures condition has been developed. The nonlinear battery cell circuit model can be used to accurately model and predict battery cell performance from the experimental and simulation test results. The model will greatly help research on circuit simulation, multi-cell battery analysis, battery cell performance prediction and optimization, and battery cell management. The experimental and simulation of battery circuit cell modeling is within 3% of error margin. The lithium battery cell has the best performance when the cell is at room temperature (20˚C) and has C/10 discharge current rate. The lithium polymer battery cell holds more than 70% of its capacity between 3.2 and 3.7 volts. Based on this circuit model, it could be developed with other models like fuzzy or neuro-fuzzy logic.
REFERENCES
- Z. M. Salameh and B. G. Kim, “Advanced Lithium Polymer Batteries,” IEEE Power and Energy Society General Meeting, July 26-30, 2009, Calgary, pp. 1-5.
- Z. M. Salameh, M. A. Casacca and W. A. Lynch, “A Mathematical Model for Lead-Acid Batteries,” IEEE Transaction on Energy Conversion, Vol. 7, No. 1, 1992, pp. 93-97.
- W. A. Lynch and Z. M. Salameh, “Electrical Component Model for a Nickel-Cadmium Electric Vehicle Traction Battery,” IEEE Power and Energy Society General Meeting, June 18-22, 2006, Montreal.
- M. Knauff, J. McLaughlin, C. Dafis, D. Niebur, P. Singh , H. Kwatny and C. Nwankpa, “Simulink Model of a Lithium-Ion Battery for the Hybrid Power System Test Bed,” IEEE Electric Ship Technologies Symposium, May 21-23, 2007, Arlington, pp. 421-427.
- M. Chen and G. A. Rincon-Mora, “Accurate Electrical Battery Model Capable of Predicting Runtime and I-V Performance,” IEEE Transaction on Energy Conversion, Vol. 21, No. 2, 2006, pp. 504-511.
- J. C. Zhang, S. Ci and H. Sharif, “An Enhanced CircuitBased Model for Single-CellBattery,” IEEE Applied Power Electronic Conference and Exposition (APEC), February 21-25, 2010, Palm Springs, pp. 672-675.
- B. G. Kim, F. P. Tredeau and Z. M. Salameh, “Performance Evaluation of Lithium Polymer Batteries for Use in Electric Vehicles,” IEEE Vehicle Power and Propulsion Conference (VPPC), September 3-5, 2008, Harbin, pp. 1-5.