Journal of Materials Science and Chemical Engineering
Vol.07 No.04(2019), Article ID:91948,18 pages
10.4236/msce.2019.74001
Analytical Application of Ion Associates of Molybdenum with Dithiolphenols and Aminophenols
K. A. Kuliev1*, N. A. Verdizade1, S. G. Aliev2, U. B. Abasquliyeva1, N. N. Efendieva1
1Department of Chemistry, Azerbaijan State Pedagogical University, Baku, Azerbaijan
2Department of Chemical Technology and Technology of Inorganic Substances, Azerbaijan State Oil and Industry University, Baku, Azerbaijan

Copyright © 2019 by author(s) and Scientific Research Publishing Inc.
This work is licensed under the Creative Commons Attribution International License (CC BY 4.0).
http://creativecommons.org/licenses/by/4.0/


Received: October 30, 2018; Accepted: April 20, 2019; Published: April 23, 2019
ABSTRACT
The mixed-ligand complexes of molybdenum(VI) with dithiolphenols (DP) {2,6-dithiol-4-methylphenol (DTMP), 2,6-dithiol-4-ethylphenol (DTEP) and 2,6-dithiol-4-tert-butylphenol (DTBP)} in the presence of hydrophobic amines have been investigated by spectrophotometric method. The condition of complexing and extraction, physical-chemical and analytical characteristics of this complex have been found. As hydrophobic amine 2(N, N-dimethylaminomethyl)-4-methylrphenol (АP1) and 2(N, N-dimethylaminomethyl)-4-xlor-phenol (AP2), 2 (N, N-dimethylaminomethyl)-4-brom-phenol (AP3) were used. It has been found that mixed-ligand complex was formed in weakly acidic medium (pH 4.1 - 5.9). The maximum analytical signal when complexing Mo(V) is observed at 516 - 534 nm. The calculated molar absorption (εmax) belongs to the range (4.16 - 5.35) × 104. The Beer’s law was applicable in the range of 0.3 - 22 µg/ml. The extraction photometric methods of the molybdenum determination were processed. The influence of diverse ions on determination of molybdenum has been studied. The proposed method was applied successfully to determine amount of molybdenum in steel and in soil.
Keywords:
Molybdenum, 2,6-Dithiol-4-Methylphenol, 2,6-Dithiol-4-Ethylfenol, 2,6-Dithiol-4-Tert-Butyl Phenol, Mixed-Ligand Complexes, Extraction-Photometric Method, Determination

1. Introduction
Molybdenum promotes (makes more efficient) the work of antioxidants, including vitamin C, an important component of the tissue respiration system, strengthens the synthesis of amino acids, and improves the accumulation of nitrogen. Molybdenum is a part of a number of enzymes (aldehyde oxidase, sulfite oxidase, xanthine oxidase, etc.) that perform important physiological functions, in particular, regulation of uric acid metabolism. Molybdenoenzymes catalyze the hydroxylation of various substrates. Aldehyde oxidase oxidizes and neutralizes various pyrimidines, purines, pteridins. Xanthine oxidase catalyses the conversion of hypoxanthins to xanthines, and xanthines to uric acid. The sulfite oxidase catalyses the conversion of sulfite to sulfate [1] .
The lack of molybdenum in the body is accompanied by a decrease in the content of xanthine oxidase in the tissues. With a lack of molybdenum, anabolic processes suffer, and the immune system is weakened. Ammonium thiomolybdate (soluble molybdenum salt), is a copper antagonist and disrupts its utilization in the body [2] .
Molybdenum is part of the active nitrogenase center, an enzyme for binding atmospheric nitrogen.
The increasing use of molybdenum in various fields of science and technology raises the problem of studying new complex compounds with organic reagents for the purpose of using them to determine small concentrations of molybdenum.
At present, the actual task is to develop and improve methods for determining low concentrations of molybdenum.
The most promising for determining the low concentration of molybdenum is the spectrophotometric method. Its spread was facilitated by the relative simplicity of the necessary equipment, especially for visual methods, high sensitivity and the ability to use almost all elements of the periodic system and a large number of organic substances. The discovery of ever newer reagents forming colored compounds with inorganic ions and organic substances makes the application of this method almost unlimited at present.
Many methods of photometric determination of molybdenum with use of the reagents belonging to various classes of organic compounds are offered. For highly sensitive methods for determination of molybdenum belong methods using dithiol, thioglycolic acid, 8-hydroxyquinoline, 8-mercaptoquinoline, fluorone, etc. [3] .
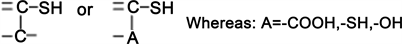
Reagents containing hydroxo and carboxyl groups in ortho-position, or two hydroxyl groups, interact with molybdenum mainly in weakly acidic and neutral media with the formation of colored complex compounds [4] [5] . The sulfur-containing organic substances having the following groups:
For spectrophotometric determination of molybdenum in different oxidation states suggested: 4-(2-pyridylazo)-resorcinol [6], pyrogallol [7], lignocaine [8], mercaptopropionic acid [9], 8-mercaptoquinoline [10], isonicotinoyl hydrazone salicylic aldehyde [11], malachite green [12], 1,5-diphenylcarbazone [4] [5], pyrocatechol [4] [5], 2,4-diaminophenol [13], 2,4-dihydro-xyacetop-henone [14], 8-hydroxyquinoline [15], capheic acid [16], N-benzoylphenyl-hydroxylamine [17], pyrocatechine violet [18] . 3-hydroxy-2-(4-methoxyphenyl)-6-propionyl-4H- chromen-4-one [19], N,N1-bis (2-hydroxy-5-bromobenzyl) 1,2-diaminopropane [20], 5-bromosalicylaldehyde isonicotinoyl hydrazone [21], 6-chloro-3-hydroxy- 2-(31-hydroxyphenyl)-4-oxo-4H-1-benzo-pyran [22], 1-methyl-3-octadecyl- imidazolium bromide [23], N/-(2-hydroxebenzyli-den)-3-(4-o-tolylpiperazin-1-il) [24], salicylaldehyde acetoacetic acid hydrazone [25] .
However, most of these methods, suffer from a large number of interferences and low sensitivity due to which they are unsuitable for the routine determination of molybdenum in the samples with diverse matrices.
The sensitivities expressed as molar absorptivity, of the proposed method are compared in Table 1 with those of published spectrophotometric methods.
In the present paper, we report results from liquid-liquid extraction spectrophotometric experiments on 9 different systems, each of which containing Mo(VI), a dithiolphenol (DP) {2, 6-dithiol-4-methylphenol (DTMP), 2, 6-dithiol-4-ethylphenol (DTEP) and 2, 6-dithiol-4-tert-butyl-phenol (DTBP), and hydrophobic amines (Am). As hydrophobic amine 2(N, N-dimethylamino- methyl)-4-methylrphenol (АP1) and 2(N, N-dimethylaminomethyl)-4-xlorphenol (AP2), 2 (N, N-di-methylaminomethyl)-4-bromphenol (AP3) were used. We propose new procedures for determining molybdenum in soils, water and plants.

Table 1. Review of reagents for the spectrophotometric determination of molybdenum (VI).
2. Materials and Methods
2.1. Reagents and Solutions
Stock solution (1 mg/mL) of Mo(VI) was prepared by dissolving 1.8402 g (NH4)6Mo7O24⸱∙4H2O p. f. a. (Pure for analysis) in hot water. On cooling; solution was diluted with water in a measured flask to 1 L. The concentration of the solution was adjusted gravimetrically [36] . Working solution with concentration of 0.1 mg/ml was prepared by dilution of stock with deionised water. Solutions of DP and AP in chloroform (0.01 M) were used. Their purity was verified by paper chromatography and melting point determination. AP was used in a recrystallization form. The extractant was purified chloroform. The ionic force of solutions was supported a constant (µ = 0.1) by introduction of the calculated quantity of KCl. To create the optimal acidity, 1 M solutions of KOH and HCl were used.
A buffer solution of pH 5.0 was prepared by mixing proper proportions of acetic acid (0.2 M) and sodium acetate solutions (0.2 M). The stock solution of various metal ions and anions were prepared by dissolving the appropriate metal salts in distilled water or with suitable dilute acids and making up to a known volume.
2.2. Instruments
The adsorbance of the extracts was measured using a Shimadzu UV1240 spectrophotometer and KFK-2 photocolorimeter (USSR). Glass cells with an optical path of 5 or 10 mm were used. The pH of the aqueous phase was measured using an l −120.2 potentiometer with a glass electrode. The ash furnace was used to dissolve the samples. The thermolysis process of the compounds was investigated using the compounds was investigated using the cyvatography system “Shimadzu TGA-50H”. IR spectra were recorded on a spectrophotometer “Bruker” (Germany). 1H-NMR spectra were recorded on “Bruker” Fourier Transform (300.18 MHz) in deuterated benzene (C6D6).
All specified devices passed state check. All measurements were carried out at 20˚C ± 1˚C.
2.3. General Procedure for the Determination of Molybdenum
To an aliquot containing 50 µg of molybdenum, add 1.8 ml 0.01 M DP, and a 1.3 ml 0.01 M AP were placed in to calibrated test tubes with ground-glass stoppers (the volume of the organic phase was 5 ml). The required value of pH was adjusted by adding 0.1 M HCl. The volume of the aqueous phase was increased to 20 ml using distilled water. After the complete separation of the phases, the organic phase was separated from the aqueous phase in 10 minutes and the absorbance of the extracts was measured on KFK-2 photocolorimeter using 540 nm (l = 0.5 cm) and at room temperature.
2.4. Determination of Molybdenum in Soils
A 0.5 - 1.0 g weight was finely ground in an agate mortar and calcined in muffle furnace for 3 h. After cooling, the sample was treated and dissolved in a graphite cup in a mixture of 16 ml of HF (conc.), 5 ml of HNO3 (conc.), and 15 ml of HCl (conc.) at 50˚C - 60˚C to remove excess hydrogen fluoride. A further 8 ml portion of HNO3 (conc.) was added triply to the solution that was each time evaporated to 5 - 6 ml. After that, the solution was transferred into a 100 ml volumetric flask and its volume was brought to the mark with distilled water. Molybdenum was determined in aliquots of the solution using the procedure proposed by us.
2.5. Preparation of Environmental Water Samples
The water samples were filtered through Whatman No. 40 filter paper then 100 ml of each filtered water sample was accurately transferred into a 250 ml round bottom flask, and 10 ml of a mixture consisting of HNO3 and H2O2 (1:9, v/v) were added. These samples were digested by heating under reflux for 1.5 h. The cooled samples were transferred into 100 ml volumetric flask and made up to the mark. With deionized distilled water, mixed well, then subsequently analysed by the proposed spectrophotometric methods.
2.6. Preparation of Food Samples
A wet ash method was employed in the preparation of the sample solution. 0.5 g of the sample was dissolved in a 1:1 mixture of nitric acid and perchloric acid. The solution was evaporated to dryness, and the residue was ashed at 300˚C. The ash was dissolved in 2 ml of 1 M sulphuric acid and made up to the volume in a 25 ml standard flask with distilled water.
3. Results and Discussion
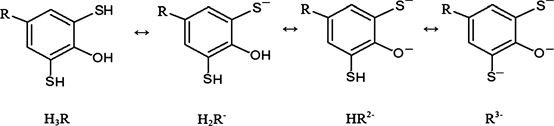
Mo(VI) reacts with DP gives a red colored complexes. These complexes are insoluble in non-polar solvents. When aminophenols (AP) were introduced into the system, the extraction of these compounds into the organic phase as a mixed-ligand complex (MLC) was observed. DP are weak tribasic acid (H3R) and depending on the pH of the medium may be in molecular and tree anionic forms.
DP were synthesized according to the procedure [37] . The reagent was characterized by taking the elemental analysis, NMR and IR spectra [38] [39] [40] . The research results of IR and NMR spectroscopy presented in Table 2.
3.1. Studies on the Oxidation State of Molybdenum
It is known that dithiophenols have reducing properties in acidic medium. To elucidate the oxidation state of Molybdenum in MLC, we conducted two series of experiments. In the first series we had used Mo (VI), while in the second series we had used Mo(V) obtained by addition of a supplementary reducing agent (SnCI2 or KI). It was found that the spectrophotometric characteristics of the MLC of Mo (VI) and Mo(V) were identical i.e. in the interaction with DP, Mo(VI) was reduced to Mo(V).
This fact was also confirmed by EPR spectrometry [41] . Molybdenum(VI) does not have unpaired electrons and is diamagnetic, while molybdenum(V) has one d electron and exhibits electron paramagnetic absorption. According to the value of the nuclear spin j = 7/2, the ESR spectra of molybdenum (VI) consisted of eight lines with the hyperfine structure associated with the interaction of the magnetic moment of an unpaired electron with the magnetic moment of the 95Мо and 97Мо nucleus. Hyperfine structure consisting of 6 lines (2J + 1 = + 1 = 6) was observed in the ESR spectra of chloroform extracts of MLC from aqueous solutions of Mo(VI) and Mo(V) salts.
Hence, in the complex formation with DTBP, molybdenum (VI) is reduced to molybdenum (V) by the reagent itself. The results of the studies are presented in Figure 1. The Mo spectra are anisotropic, and are similar to the V(IV) spectrum.
3.2. Choice of Solvent
As DP is insoluble in water, an organic solvent was used for the system. Of the various solvent (chloroform, 1,2-dichloroethane, tetrachloromethane, dichloromethane,
Table 2. The research results of IR and NMR spectroscopy.

Figure 1. Hyperfine splitting of the paramagnetic resonance line in solutions: Mo(V)-DTBP-AP1 and (2) Mo(VI)-DTBP-AP1.
benzene, chlorobenzene, toluene, xylol, isobutanol, isoamyl alcohol, cyclohexane, ethyl acetate, 1-butanol, isoamyl acetate and their mixes) studied, chloroform, 1,2-dichloroethane and carbon tetrachloride was found to be the best solvent for the system (Figure 2). No absorbance was observed in the organic phase with the exception of 1-butanol. In a 50% ethanol medium however, the maximum absorbance was used in the determination procedure. After a single extraction with chloroform, 98.4% - 98.7% of molybdenum was extracted as an ion associate (in a case the dichloroethane and carbonetrachloride was removed 96.5% - 97.8% of molybdenum). Further researches were conducted with chloroform. The concentration of molybdenum in the organic phase was determined using 8-mercaptoquinoline [3] by photometric measurements after reextraction, and in the aqueous phase by difference.
3.3. Effect of pH
To study the effect of pH on maximum color development and also on quantitative extraction of the colored complex into chloroform, the color reaction and the extraction were carried out at different pH values. Extraction of the complex into chloroform is quantitative and the complex shows maximum absorbance in the pH range 4.1 - 5.9 (Figure 3). The complete extraction of the complex into chloroform is confirmed by the fact that the aqueous phase does not show any absorbance. However, outside this pH range, it is observed that either the extraction of the complex into chloroform is incomplete or the solution does not attain the maximum color. For all subsequent studies, therefore, the pH is maintained at an optimum level of 5.0. Thus further extraction and determination carried

Figure 2. Effect of solvents on extraction of Mo(V) with DTMP and AP2.
out at pH 5.0. The presence of one maximum optical density within the indicated pH limits confirms the assumption that a single complex compound is formed. The analyzed solution should not contain oxidizing agents (for example, HNO3) due to the high tendency of DP to oxidation. At higher pH values, the complexation process is complicated by hydrolysis.
3.4. Electronic Absorption Spectra
Under the experimental conditions, the absorption spectrum of the Mo(V)-DTMP-AP complex was recorded against the blank solution. The absorption maxima (λmax) of the ternary Mo(V)-DP-AP complexes lie in the range of 516 - 534 nm (Figure 4, Table 3). All colour reactions were very contrast since the initial solutions are colourless (λmax (dithiolphenols) = 274 - 280 nm). Thus, bathochromic shift makes 242 - 260 nm. Close values of λmax of light absorption allow to draw a conclusion that the formed complexes were ionic associates. Contrast of reactions was high i.e. initial reagents are colourless while complexes are intensively painted. Molar coefficients of absorption make (4.16 - 5.34) × 104

Figure 3. Absorbance of mixed-ligand complexes as a function of the pH of the aqueous phase; CMo = 2.08 × 10⁻⁵ M. CDTMP = 7.2 × 10⁻⁴ M, CAP = 5.2 × 10⁻⁴ M, KFK-2, 540 nm, l = 0.5 cm.

Figure 4. Absorption spectra of the Mo(V)-DTMP-AP system in chloroform solutions. CMo=2.08 × 10⁻⁵ M, CDTMP = 7.2 × 10⁻⁴ M, CAP = 5.2 × 10⁻⁴ M, Ph = 5, Shimadzu UV 1240, l = 1 cm.
dm3 × mol−1 × cm−1. The color of both the mixed ligand complexes and the homogeneous ligand complex HLC is due to the same electronic transitions—the transfer of electrons from the dithiolphenolate ion to the metal ion, and these complexes are charge-transfer complexes.
The reagents have a minimum absorbance at the maximum absorbance of the complex, and hence do not interfere with the determination of molybdenum. All the spectral measurements of the complex were carried out at 540 nm.
3.5. Reagent Concentration and Incubation Time Influence
Studies of the effect of reagent concentration showed that an excess of reagent 2 - 3 times was optimal for the formation of complexes. The presence of a small excess of the reagent solution does not interfere with the color reaction. Temperature measurement in the range of 10˚C - 70˚C does not affect the color of the complexes. It was found that the optimal concentration of dithiophenols and AP for the formation of the complex is 7.2 × 10⁻⁴ and 5.2 × 10⁻⁴ M, respectively.
3.6. Composition of the Complex and Suggested Formula
The stoichiometric reaction coefficients of Mo(V) with DP and AP were determined by the equilibrium shift method and confirmed by straight-line method of Asmus and relative yield method [42] . Both methods showed that the ratio of the reacting components of Mo:DP:AP = 1:1:2 (Figure 5).
Using the Nazarenko’s method [43], we found that the molybdenum complexation form is MoO(OH)2+ [44] . Hence, the complexes can be regarded as ion associates between doubly charged anionic chelates [Mo(OH)(DP)2]2− and two protonated AP species: (APH+)2[MoO(OH)(DP)2].
In the IR spectra of the Mo-DTMP-An complex, in addition to a narrow band in the region of 950 - 930 cm−1, corresponding to the M = O bond, a somewhat intense absorption band appears at 1090 cm−1, which indicates the presence of the M − OH group (Figure 6). The disappearance of the pronounced absorption

Figure 5. Determination of the ratio of components by straight-line method of Asmus for Mo-DTEP-AP2, CMo = 2.08 × 10⁻⁵ M, CDTMP = 7.2 × 10⁻⁴ M, CAP2 = 5.2 × 10⁻⁴ M, pH = 5, Shimadzu UV 1240, l = 1 cm.

Figure 6. IR spectrums of DTMP (a) and the Mo(V)-DTMP-AP1 (b).
Table 3. Chem-analytical parameters of mixed-ligand complexes of molybdenum with DP and AP.
bands in the 3620 - 3250 cm−1 with a maximum at 3475 sm−1 observed in the spectrum of DTMP, says that the -OH group is involved in the formation of the complex. The observed decrease in the intensity, absorption bands in the area 2570 sm−1 shows that one of the -SH groups involved in the formation of coordination bond in the ionized state. Detection of the absorption bands at 2380 cm−1 indicates the presence of a coordinated aminophenole [39] [40] .
Thermogravimetric study of the complex Mo-DTMP-AP1 shown that thermal decomposition of the complex takes place in three stages: at 50˚С - 80˚С water evaporates (weight loss-4.95%), at 420˚С - 490˚С-decomposed AP (weight loss—30.56%), and at 490˚С - 530˚С-DTMP (weight loss—46.75%). The final product of the termolysis of the complex is MoO3.
Additional experiments by the Akhmedly’s method [45] showed that the complex exists in monomeric form in the organic phase (the obtained coefficient of polymerization γ was equal to 1.05).
Given the molar ratio of components in the complexes, the complexing form of central ions, monomeric complexes in the organic phase, IR spectroscopic data, thermogravimetric studies and chemical analysis, it can be assumed that the Mo(V) with DTMP and AP forms mixed ligand complexes (Figure 7).
3.7. Effect of Foreign Ions
To assess the expediency of the proposed method, the effect of several diverse ions was examined under already established optimum conditions. The interference of various ions was determined by measuring the absorbance of solutions containing a constant amount of Mo(VI) and varying amounts of diverse ions. The tolerance limit was considered to be the amount that caused a ±1% deviation in the absorbance value. The tolerance limits of various diverse ions are given in Table 4.
Ba(II), Mg(II), Ca(II), Sr(II), Cr(III), Zn(II), Cd(II), Hg(II), Al(III) and Bi(III)
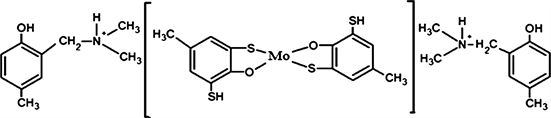
Figure 7. Structure of complexes Mo-DTMP-AP1.
Table 4. Tolerance limit of foreign ions in the determination of molybdenum with DTEP and AP2 (30.0 µg Mo added).
did not affect the absorbance of Mo(V)-DTMP-AP complex when present in 10 mL of the aqueous phase and were found to cause < 1% error. However, Hg(II), Pb(II), U(VI), Mn(II), V(IV), Fe(II), Fe(III), Cr(VI), Pd(II), Pt(IV), V(V), Zr(IV), Ti(IV), Ta(V), Co(II), Cu(II), Nb(V), Ni(II) and W(VI) required masking agents, as mentioned under the procedure.
The interference of Cu(II) can be eliminated by using 1.0 mL 0.2% EDTA as a masking agent. Fe(II) and Fe(III) are masked with 1.0 mL of 3% sodium fluoride. The interference of Zn(II), Cd(II) can be eliminated by using 1.0 mL of 0.5% thiosulphate solution. Anions like fluoride, thiocyanate, thiosulfate, and thiourea do not interfere when present up to 3.000 µg, with the determination in the method. Chloride, citrate, and borate are tolerated up to 1.500 µg. The interfering influence of Nb(V), Ta(V), Mn(II) and Hg(II) removed by controlling pH.
3.8. Characteristics of the Analytical Method
A series of solutions containing different amounts of the metal ion were prepared as per the general experimental procedure. The absorbance of the solutions was measured at 500 nm. A calibration graph drawn between absorbance and the metal ion concentration indicates that Mo(V) can be determined in the concentration range 0.3 to 22.0 µg mL−1 (Figure 8).
Detection limit estimated from the standard deviation (SD) of the blank and calibration sensitivity (slope of calibration line), (LOD = 3 SD/sensitivity amounted to 9 - 10 ng∙mL−1 of Mo(V) (Table 5). Limit of quantication (LOQ) is 28 - 34 ng∙mL−1 of Mo(V), and the LOD/LOQ ratio is 3.1 - 3.4.
4. Analytical Applications
The proposed method has been applied for the determination of molybdenum(V) in plants, water and soil samples. The data presented in the Tables 6-8 indicate the accuracy and precision of the proposed method.

Figure 8. Analytical determination of Mo(V).
Table 5. Analytical parameters of mixed-ligand complexes of molybdenum with DP and AP.
Table 6. Determination of molybdenum in plants, n = 5, P = 0.95.
Table 7. Correctness and reproducibility of determination of molybdenum levels in surface soil samples. n = 5, P = 0.95.
Table 8. Determination of molybdenum levels in environmental water samples with DTBP and AP1.
5. Conclusions
The proposed method has been applied to determine molybdenum in natural waters, soil and food samples with good results. The proposed method is simple and more sensitive than other methods commonly used at microgram level, in addition to lower tolerance limits. The results obtained show that the newly developed method in which the reagent 2,6-dithiol-4-methylphenol (DTMP), 2,6-dithiol-4-ethylphenol (DTEP), 2,6-dithiol-4-tert-butylphenol (DTBP) was used, can be effectively used for quantitative extraction and estimation of Mo(V) from aqueous media. Mixed-ligand complexes of molybdenum(V) with DP in the presence of AP have been investigated by spectrophotometric method. The interaction of Mo (V) with DP and aminophenols and their extraction (output of the MLC) into the organic phase is maximum at pH 4.8 - 5.8. The proposed method is quick and requires less volume of organic solvent. During one extraction, Mo(V) was extracted by 98.4% - 98.7% chloroform in the form of an MLC. The maximum analytical signal when complexing Mo(V) is observed at 516 - 534 nm.
The optimal conditions for the formation and extraction of mixed-ligand compounds have been found and the ratios of components in the complexes have been determined.
The Beer’s law was applicable in the range of 0.3 - 22 µg/ml.
The results of studies on the formation and extraction of Mo(V) MLC with DP and aminophenols, the physico-chemical and analytical characteristics of these compounds served as the basis for the development of new methods extraction-photometric determination of molybdenum in various environmental and industrial materials.
Conflicts of Interest
The authors declare no conflicts of interest regarding the publication of this paper.
Cite this paper
Kuliev, K.A., Verdizade, N.A., Aliev, S.G., Abasquliyeva, U.B. and Efendieva, N.N. (2019) Analytical Application of Ion Associates of Molybdenum with Dithiolphenols and Aminophenols. Journal of Materials Science and Chemical Engineering, 7, 1-18. https://doi.org/10.4236/msce.2019.74001
References
- 1. Underwood, E.J. (1997) Trace Elements in Human and Animal Nutrition. 4th Edition, Academic Press, New York.
- 2. Orozbaeva, Zh.M. (2009) Bioneorganic Chemistry. 144. (In Russian)
- 3. Marczenko, Z. and Balcerzak, M. (2007) Metod’y spektrofotometrii v UF I vidimoj oblast-yakh v neorganicheskom analize. Binom. Laboratoriya znanij, Moscow.
- 4. Busev, A.I., Tiptsova, V.G. and Ivanov, V.M. (1978) Practical Guidance in Analytical Chemistry of Rare Elements. Chemistry, M.
- 5. Umland, F., Janssen, A., Thierig, D. and Wünsch, G. (1971) Theorie und praktische an-wendung von complexbildnern. Frankfurt am Main, Akademische Verlagsgesellschaft.
- 6. Reddy, M., Kumar, P., Shyamasundar, J. and Anjaneylu, A. (1990) Extractive Spectrophotometric Determination of Molybdenum in Steels and Nickel Base High Temperature Alloys with Hydroxylamine Hydrochloride and 4-(2-Pyridylazo) Resorcinol. Proceedings of the Indian National Science Academy, 56, 255.
- 7. Barrera, B., Gonzalez, F. and Martinez, B. (1987) Spectrophotometric Determination of Mo-lybdenum with Thiocyanate and Pyrogallol. Microchemical Journal, 35, 1-6. https://doi.org/10.1016/0026-265X(87)90192-5
- 8. Ramappa, P. and Ramachandra, K. (1986) Lignocaine hy drochloride as a highly selective extractant for spectrophotometric determination of molybdenum with thiocyanate. Current Science, 55, 34.
- 9. Chandrima, R., Ywapan, M. and Jyotirmay, D. (1988) Extractive Spectrophotometric Determination of Molybdenum (VI) with Anilides of Mercaptoacids. Chemia Analityczna, 33, 917-928.
- 10. Kroik, A., Storoshko, S. and Mamontov, A. (1989) A Method of Extraction-Photometric Determination of Molybdenum.
- 11. Kavlentls, E. (1988) Salicylaldehyde Isonicotinoylhydrazone (SAIH) as a Specific Analytical Reagent for the Selective Extractive Spectrophotometric Determination of Molybdenum (VI) in Presence of Several Cations. Analytical Letters, 21, 107. https://doi.org/10.1080/00032718808082027
- 12. Sato, S., Iwamoto, M. and Vchikawa, S. (1987) Extraction and Spectrophotometric Determination of Molybdenum (VI) with Malachite Green and p-chloromandelic Acid. Talanta, 34, 419. https://doi.org/10.1016/0039-9140(87)80063-2
- 13. Papadopoulos, G. and Zoton, C. (1992) Kinetic-Spectrophotometric Determination of Molybdenum (VI) and Tungsten (VI) in Mixtures. Microchimica Acta, 106, 203-210. https://doi.org/10.1007/BF01242091
- 14. Rao, C., Reddy, V. and Reddy, T. (1993) Selective Spectrophotometric Determination of Molybdenum(VI) and Vanadium(V) with Resacetophenone Benzoic Hydrazone in Steels and Alloys. Proceedings of the Indian National Science Academy, Part A, Physical Sciences, 59, 449-454.
- 15. Burns, D., Harriott, M. and Pornsinlapatip, P. (1993) Flow-Injection Spectrophotometric Determination of Molybdenum (VI) by Extraction with Quinolin-8-ol. Analytica Chimica Acta, 281, 607-610. https://doi.org/10.1016/0003-2670(93)85021-B
- 16. Shah, I., Menon, S., Desai, W. and Agrawal, Y. (1989) Extraction-Spectrophotometric and Atomic Absorption Spectrophotometric Determination of Molybdenum with Caffeic Acid and Application in High Purity Grade Steel and Environmental Samples. Analytical Letters, 22, 1807. https://doi.org/10.1080/00032718908051214
- 17. Pilipenko, A., Samchuk, A. and Zulfigarov, O. (1985) Extraction-Spectrophotometric Determination of Molybdenum as a Different-Ligand Complex with N-benzoil-phenylhydroxylamine and O-nitrophenyl Fluorone. Journal of Analytical Chemistry, 40, 1262-1266.
- 18. Ivanov, V. and Kochelaeva, G. (2003) Pyrocatechol Violet in New Optical Methods for Determining Molybdenum (VI). Journal of Analytical Chemistry, 58, 38. https://doi.org/10.1023/A:1021882030811
- 19. Dass, R., Kumar, A. and Sharma, R.G. (2004) Extractive Spectrophotometric Determination of Molybdenum (VI) Using 3-hydroxy-2-(4-methoxyphenyl)-6 propionyl-4H-chromen-4-one as a New Reagent. Indian Journal of Chemistry, 43A, 576-578.
- 20. Kara, P. and Karadas, C. (2015) Spectrophotometric Determination of Molybdenum Using N,N1-bis(2-hydroxy-5-bromo-benzyl)1,2diaminopropane. Spectrochimica Acta Part A: Molecular and Biomolecular Spectroscopy, 147, 158-162. https://doi.org/10.1016/j.saa.2015.03.081
- 21. Swetha, M. (2016) Non-Extractive Spectrophotometric Determination of Mo (VI) Using 5-Bromo-Salicylaldehyde Isonicotinoyl Hydrazone (5-BrSAINH). International Journal of Advances in Pharmacy, Biology and Chemistry, 5, 137-142.
- 22. Dass, R., Kapoor, J.K. and Gambhir, S. (2012) Extractive Spectrophotometric Method for Determination of Molybdenum in Steels and Environmental Samples. Journal of Chemistry, 2013, Article ID: 420768.
- 23. Pelit, L., Koçak, S., Pelit, F.O., Türkmen, H. and Ertaş, F.N. (2013) A Spectrophotometric Method for Determination of Molybdenum in Water Samples by Using Pyrogallol Red and a Water Soluble Ionic Liquid. Analytical Methods, 5, 5792-5798. https://doi.org/10.1039/c3ay40772a
- 24. Ravichandran, C., Benzil, D., Munikumari, G., Ramachandraiah, C. and Chandrasekhar, K.B. (2016) Extractive Spectrophotometric Method for the Determination of Molybdenum(VI) in Environmental Samples. International Journal of Research in Pharmaceutical Sciences, 7, 164-171.
- 25. Srilalitha, V., Prasad, R.G.A., Kumar, R.K., Seshagiri, V. and Ravindranath, L.K. (2010) Spectrophotometric Determination of Trace Amounts of Molybdenum (VI) Using Salicylaldehyde Acetoacetic Acid Hydrazone. Chemical Bulletin of Politehnica University of Timisoara, 55, 110.
- 26. Naik, B.R. and Desai, K.K. (2006) 2-Hydroxy-4-Ethoxy Valerophenone Oxime as an Analytical Reagent for Molybdenum(VI) Asian. Journal of Chemistry, 18, 3176.
- 27. Li, Z., Pan, J. and Jan, T. (2001) Spectrophotometric Determination of Trace Molybdenum in Plants and Seeds with 3,5-Dibromo-4-Hydroxyphenylflurone. Analyst, 126, 1154-1159. https://doi.org/10.1039/b101698i
- 28. Kumar, A., Dass, R. and Sharma, R.G. (2004) A Study on the Colour Reaction of Molybdenum(V) with 6-Chloro-3-hydroxy-2-(2’-theinyl)-4H-chromen-4-one and Its Applications. Journal of the Indian Chemical Society, 81, 177-179.
- 29. Babaiah, O., Reddy, P.R., Reddy, V.K. and Reddy, T.S. (1999) Simultaneous Spectrophotometric Determination of Molybdenum (VI) and Titanium (IV) Using 2,4-dihydroxybenzaldehyde Isonicotinoyl Hydrazone. Indian Journal of Chemistry, 38, 1035-1038.
- 30. Kethani Devi, C.H., Gopala Krishna, D., Devanna, N. and Chandrasekhar, K.B. (2010) Direct and Derivative Spectrophotometric Determination of Molybdenum(VI) in Presence of Micellar Medium in Food Stuffs, Pharmaceutical Samples and in Alloys Using Cinnamaldehyde-4-hydroxy Benzoylhydrazone (CHBH). Research Journal of Pharmaceutical, Biological and Chemical Sciences, 1, 808-825.
- 31. Satheesh, K.P., Ravichandran, S., Rao, V.S., Devanna, N. and Chandrasekhar, K.B. (2011) Spectrophotometric Determination of Trace Amounts of Molybdenum(VI) Using 4-hydroxybenzaldehyde Thiosemicarbazone. International Journal of ChemTech Research, 3, 1740-1746.
- 32. Narayanan, B.V., Sreenivas, J. and Rao, V.S. (2006) Spectrophotometric Determination of Trace Amounts of Molybdenum(VI) Using 3.4-Dihydroxybenzaldehyde Thiosemicarbazone. Research Journal of Chemistry and Environment, 10, 67-70.
- 33. Ahmed, M.J., Uddin, M.N., Zannat, T. and Sultana, S. (2014) A Simple Spectrophotometric Method for the Determination of Trace Levels of Molybdenum in Industrial, Environmental, Biological and Soil Samples Using Benzoylacetone Benzoylhydrazone. Analytical Methods, 6, 2282-2293. https://doi.org/10.1039/C3AY42113A
- 34. Huang, X., Zhang, W., Xu, G., Han, Sh., Li, Y. and Li, C. (1998) Mixed Micellar Medium for the Spectrophotometric Determination of Molybdenum in Molybdenum/Tungsten Mixtures. Talanta, 47, 869-875. https://doi.org/10.1016/S0039-9140(98)00175-1
- 35. Ahmed, M.J. and Haque, M.E. (2002) A Rapid Spectrophotometric Method for the Determination of Molybdenum in Industrial, Environmental, Biological and Soil Samples Using 5, 7-Dibromo-8-hydroxylquinoline. Analytical Sciences, 18, 433-439. https://doi.org/10.2116/analsci.18.433
- 36. Korostelev, P.P. (1964) Preparation of Solutions for Chemical Analysis Works. Publishing House of Academy of Sciences of the USSR.
- 37. Kuliev, A.M., Aliev, S.R., Mamedov, F.N. and Movsumzade, M. (1976) Synthesis of Aminomethyl Derivatives of 2-Hydroxy-5-tert-alkylthiophenols and Their Cleavage by Thiols. Zhurnal Organicheskoi Khimii, 12, 426-431. https://doi.org/10.1002/chin.197624210
- 38. Shrayner, R., F’yuzon, R., Kortin, D. and Morrill, T. (1983) Identifikatsiya Organicheskikh Soyedineniy. Mir, M. (In Russian)
- 39. Bellami, L. (1991) Infrakrasnie spectri slojnikh molecul (The Infra-Red Spectra of Complex Molecules). Mir, Moscow, 592. (In Russian)
- 40. Nakamoto, K. (1991) IK-spectr KR neorqaniceskikh i koordinatsionnikh soedineniy (Infrared and Raman Spectra of Inorganic and Coordination Compounds). Mir, Moscow, 536 p. (In Russian)
- 41. Al’tshuler, S.A. and Kozyrev, B.M. (1972) Elektronnyi paramagnitnyi rezonans soedinenii promezhutochnykh grupp (Electron Paramagnetic Resonance of the Compounds of Intermediate Groups). Nauka, Moscow. (In Russian)
- 42. Bulatov, M.I. and Kalinkin, I.P. (1972) Prakticheskoe rukovodstvo po fotokolorimetricheskim i spektrofotometricheskim metodam analiza (Practical Guide on Photocolorimetric and Spectro-Photometric Methods of Analysis. (In Russian)
- 43. Nazarenko, V.A. (1969) Tr. Komis. po analit. khimii Akad. Nauk SSSR. In: Commission on Analytical Chemistry of the USSR’s Academy of Sciences, Nauka, Moscow, Vol. 17, 22-27. (In Russian)
- 44. Nazarenko, V.A. and Biryuk, E.A. (1967) A Study of the Chemistry of Reactions of Multivalent Element Ions with Organic Reagents. Zhurnal Analiticheskoi Khimii, 22, 57-64. (In Russian)
- 45. Akhmedly, M.K., Kly’gin, A.E., Ivanova, L.I. and Bashirov, E.A. (1974) On the Chemistry of Interaction of Gallium Ions with a Number of Sulphophtaleins. Zhurnal Neorganicheskoi Khimii, 19, 2007-2012.