Journal of Computer and Communications
Vol.1 No.4(2013), Article ID:37754,5 pages DOI:10.4236/jcc.2013.14001
Effect of Thermal Discharge of Cool Water Outfall from Liquefied Natural Gas (LNG) Plant into Sea Using CORMIX
![]()
1National Environmental Engineering Research Institute (NEERI), Nagpur, India; 2National Environmental Engineering Research Institute (NEERI), Mumbai Zonal Lab, Mumbai, India.
Email: *s_nigam@neeri.res.in
Copyright © 2013 Shivangi Nigam et al. This is an open access article distributed under the Creative Commons Attribution License, which permits unrestricted use, distribution, and reproduction in any medium, provided the original work is properly cited.
Received June 10th, 2013; revised July 9th, 2013; accepted July 17th, 2013
Keywords: CORMIX; Mixing Zone; Outfall; LNG Plant; Hydrodynamic Model
ABSTRACT
The numerical modeling for the cool water outfall discharge from the LNG Plant is undertaken using CORMIX to evaluate the design of diffuser for discharge. The hydrodynamic data tide and currents are used inputs to the model. It is then calibrated using monitored data. The software has been run to calculate the mixing zone and dilution patterns for various flow conditions. Model result shows that ambient condition is achieved within 64 m from the proposed outfall locations. From the results of the modeling studies it can be concluded that the proposed diffuser design and outfall locations are suitable for all tide conditions. It also shows that there is no significant impact on the marine life due to the proposed cool water discharge, beyond the small area around the discharge location, as the parameters are attaining near ambient water quality within the acceptable space and time.
1. Introduction
The Gulf region in the earth contains the largest manmade islands in the world. The Gulf is one of the most highly impacted regions in the world and the greatest threats facing are the Gulf’s marine communities [1]. The development which has occurred at unprecedented rate and scales, poses numerous environmental challenges. In India the Gulf of Kutch is characterised by high tidal ranges. Tidal range increases from mouth to head [2]. The Government of Gujarat has declared part of the Gulf of Kutch as the marine national park of India to protect the marine biota of the area and create long range interest of conservation [3]. Rapid economic development and population growth have brought widespread prosperity to this region. Coastal development and associated pollution can potentially alter or damage important shore habitats nearby, disrupt vital ecological pathways and cause permanent loss of nursery grounds for commercial shellfish and fish species. Nowadays they are facing lots of environmental issues like loss of productive natural coastal habitat and associated marine life. Without good planning and careful consideration for existing coastal features, hydrodynamics and offshore bathymetric conditions, the consequences of such development can be severe and long lasting. Gulf countries need to take urgent action to prepare for the potential impacts of climate change on coastal areas and resources [4].
In this work, modeling of cool water outfall from LNG plant into sea port in Gulf of Kutch of India has been studied. In this LNG plant once through sea water is used for heating the LNG which turns cool by 3˚C - 5˚C. The cool sea water is discharged as outfall in to the sea which further gets dispersed by the tidal current. The CORMIX (Cornell Mixing Zone Expert System) system has been used for designing of diffuser as per the mixing zone. It is a comprehensive software system for the analysis, prediction of outfall mixing zones resulting from discharge and designing of diffuser. It contains mathematical models of point source discharge mixing within an intelligent computer-aided-design (CAD) interface [5, 6]. It mainly focuses on environmental impact assessment and regulatory management. The basic aspects for consideration of discharge in flowing surface waters are:
1) Defining mixing zone following the guidelines or regulations present in the current scenario [7].
2) The physical components of hydrodynamic mixing processes determining cool water outfall fate and distribution.
1.1. Software Availability
Name of software: CORMIX.
Developer and contact address: USEPA, Centre for Exposure Assessment Modelling Year first available: 1991.
Hardware required: Microcomputer (MS-DOS).
Software required: MS-DOS or equivalent.
Program language: FORTRAN and VP-Expert.
Program size: 1.63 MB (downloadable distribution file).
Availability and cost: free at (http://www.mixzon.com.)
1.2. Study Area
The study area coordinates as longitudes of 71˚06' E and 72˚54'E and the latitudes of 19˚57'N and 22˚3'N is selected for carrying out analysis and predicting the impacts due to discharge (Figure 1).
2. Hydrodynamic Data
The hydrodynamic data at the site of the discharge (water level and currents) has been taken from literature [8]. The discharge dispersion in coastal and marine waters depends on turbulence and currents. The coastal currents originate due to geophysical and meteorological conditions, responsible for mixing of pollutants. The input parameters have been tabled in Table 1 for simulation to software.
2.1. Currents & Waves
Design current velocity of 0.5 m/s has been considered for the design of the berths. Direction of currents away from the coast also favours greater dispersion of pollutants from wastewater (Figure 2). Tide current velocity is 1.4 m/s and current direction in the port is counterclockwise.
2.2. Winds
During the month of June, mean annual wind speed and maximum mean wind speed was observed 8.9 km/h and of 13.5 km/h respectively. During the month of January, lowest wind speed was observed to be 6.9 km/h. During the month of May to August Very high mean wind speed was observed in the range of 11.0 to 13.5 km/h.
2.3. Bathymetry
Bathymetry of study area has been presented in Figure 3. A maximum water depth of 6.0 m CD was recorded in the northwest 15 quadrant of the surveyed area at 252648.1E, 2332561.1N [9].
2.4. Discharge Data
The cool water is discharged into port with a flow rate of 6.17 m3/sec at temperature of 20˚C. The seawater temperature varies between 23˚C and 30˚C. Density data is taken as per the temperature values of the fresh water body.The salinity is variable depending on the freshwater discharge into the area. This means that the density of ambient discharged water will vary by a few kg/m3 but the density contrast between ambient water and discharge will remain at about 1.5 kg/m3.
2.5. Thermal Characteristics of Discharge and Sea
Temperature near intake pipe in sea is 30˚C and is assumed as the ambient temperature. Delta T across the Vaporizer is 5˚C.
2.6. Criteria for Discharge
1) Limit of −5˚C temperature between discharge and ambient sea at point of discharge.
2) Limit of −0.5˚C temperature contrast between the discharges at 50 m from the point of discharge.
3. Output Parameters
The NFR is the zone of strong initial mixing. However, this information may be useful for the discharge designer because the mixing in the NFR is usually sensitive to the discharge design conditions (Figure 4). The model output parameters have been shown in Table 2.
4. Results & Discussion
The design of diffuser in Case I appears to be satisfactory for initial dilution of the cool water discharge because deeper water offers a greater opportunity for dilution of the cool water. Case II design leads to a significant increase in head loss of the discharge system. As a consequence there is a risk of flooding at the upstream end of the discharge system. Recirculation is expected to be low because of tidal mixing and gravity-driven flows. The study also evaluates that case I discharging at the inside edge is expected to give dilution up to 0.5˚C above ambient within about 100 - 150 m of the discharge point and below 0.5˚C at the exit from the harbour into the outside environment. The second case discharging at the outside
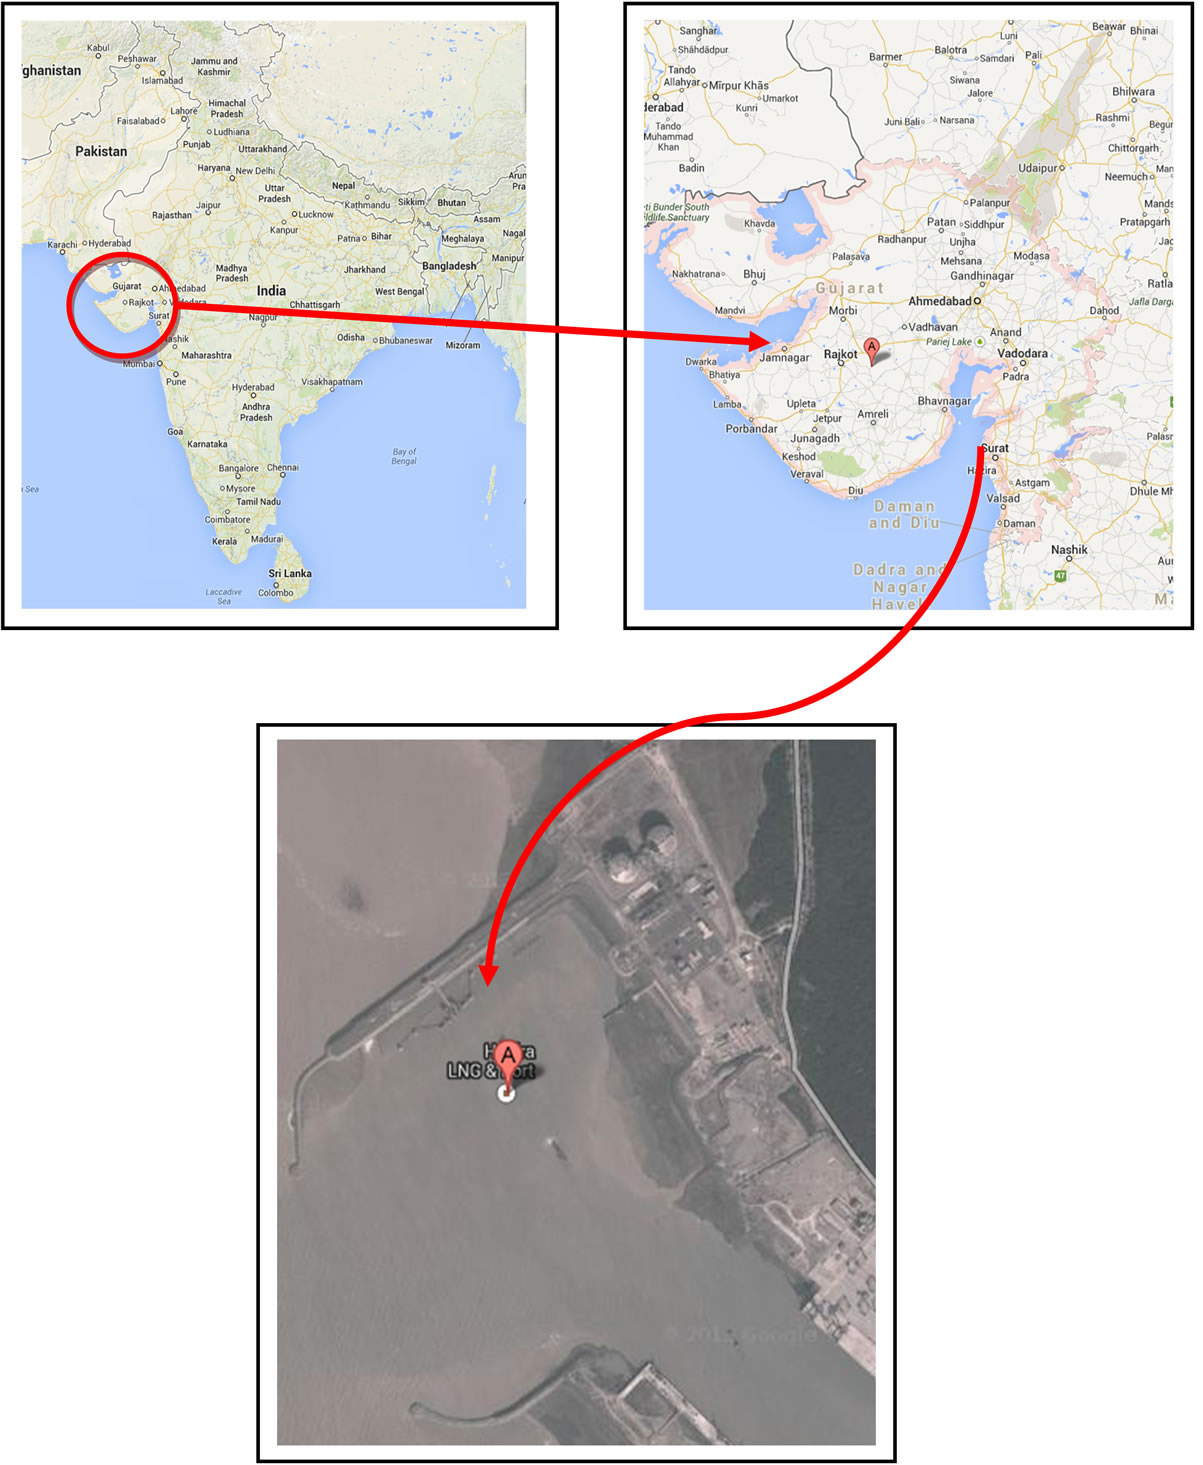
Figure 1. Location of Outfall Discharge of LNG Plant.
edge is expected to give adequate dilution of the discharge within 50 m, but would lead to losses in excess of the available head at high outside water levels. Hence Case I with 4 nozzles is selected for designing which will give dilution within NFR region (64 m) with a travel time of 16 seconds and also protects the marine life via
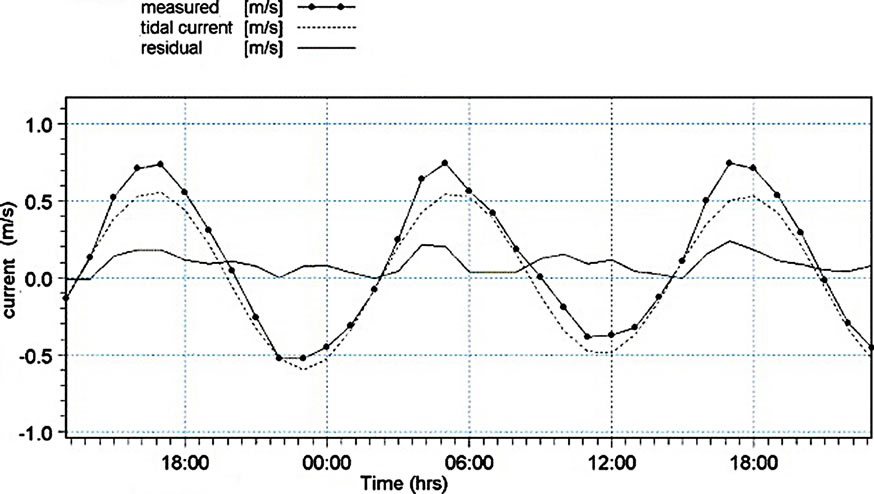
Figure 2. Current Variation with Time.
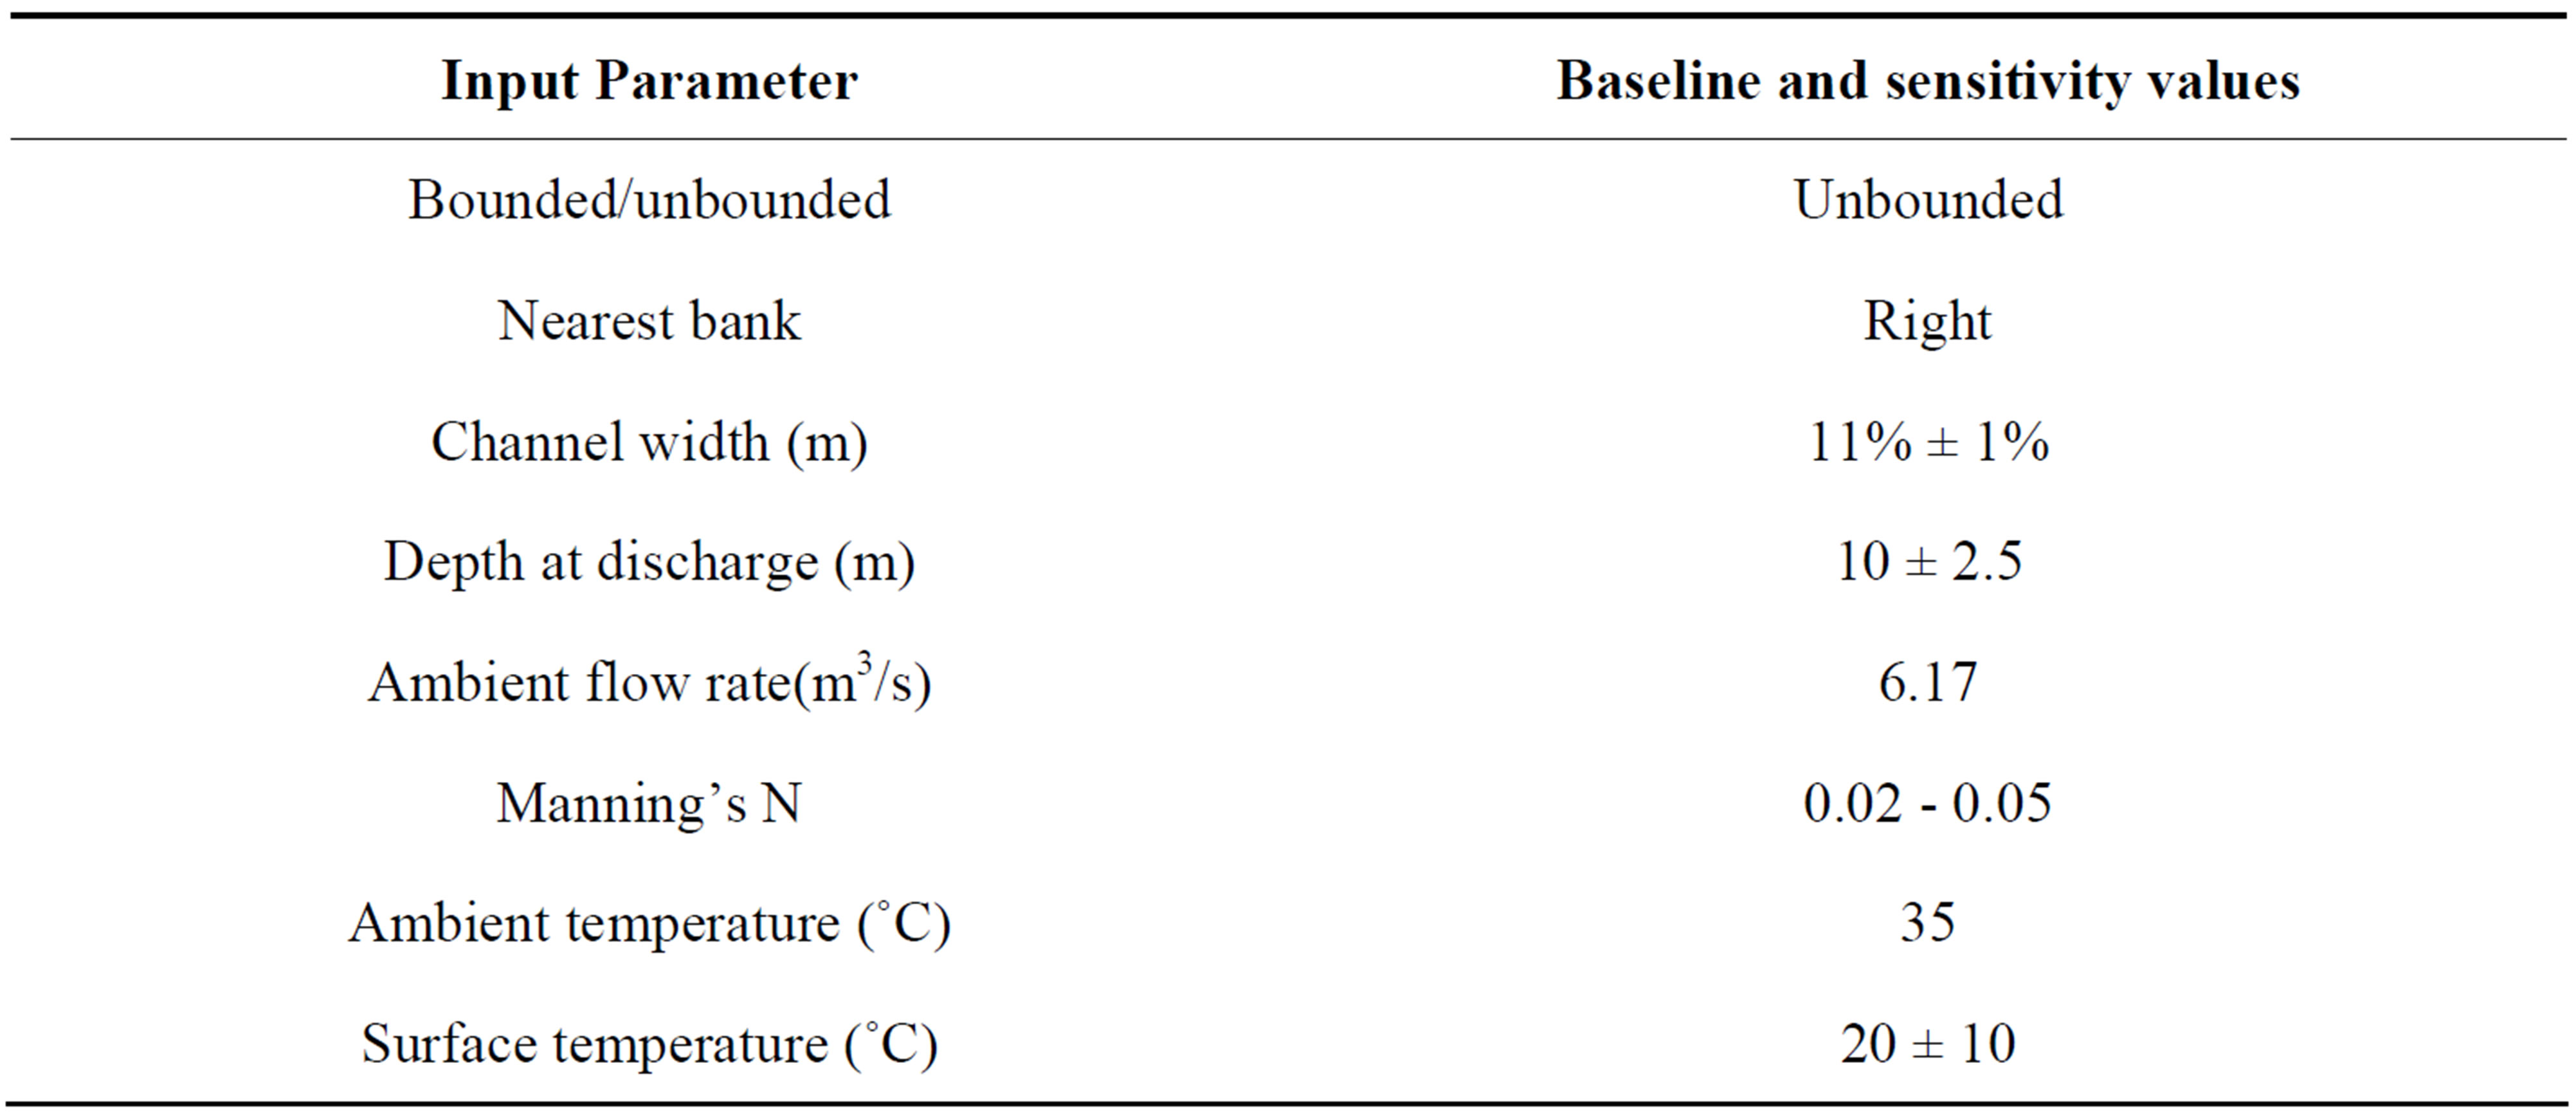
Table 1. Input Parameters for CORMIX Simulations.
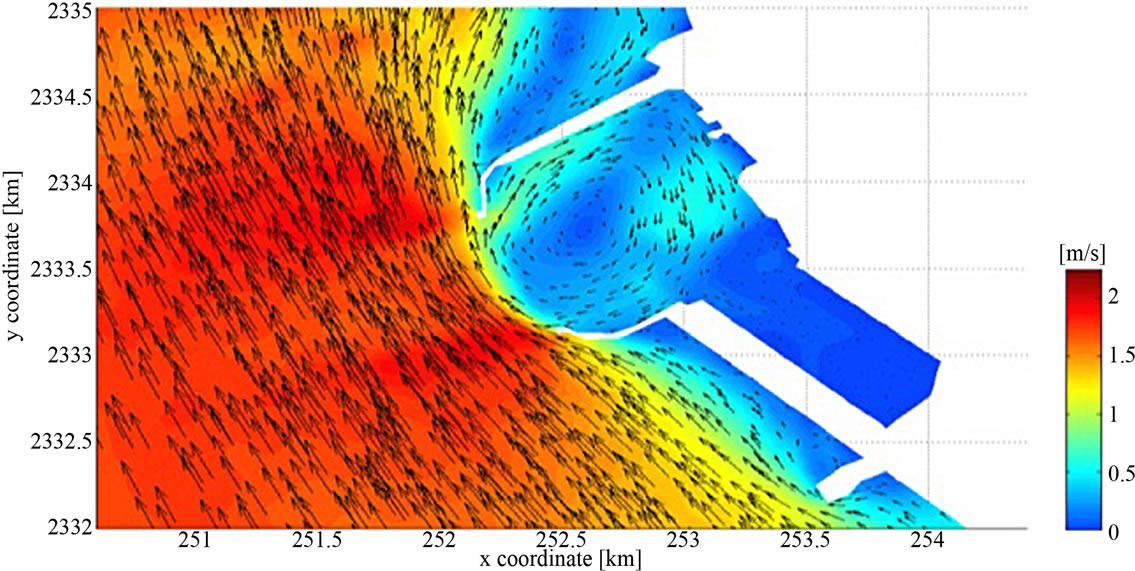
Figure 3. Bathymetry of the study area.
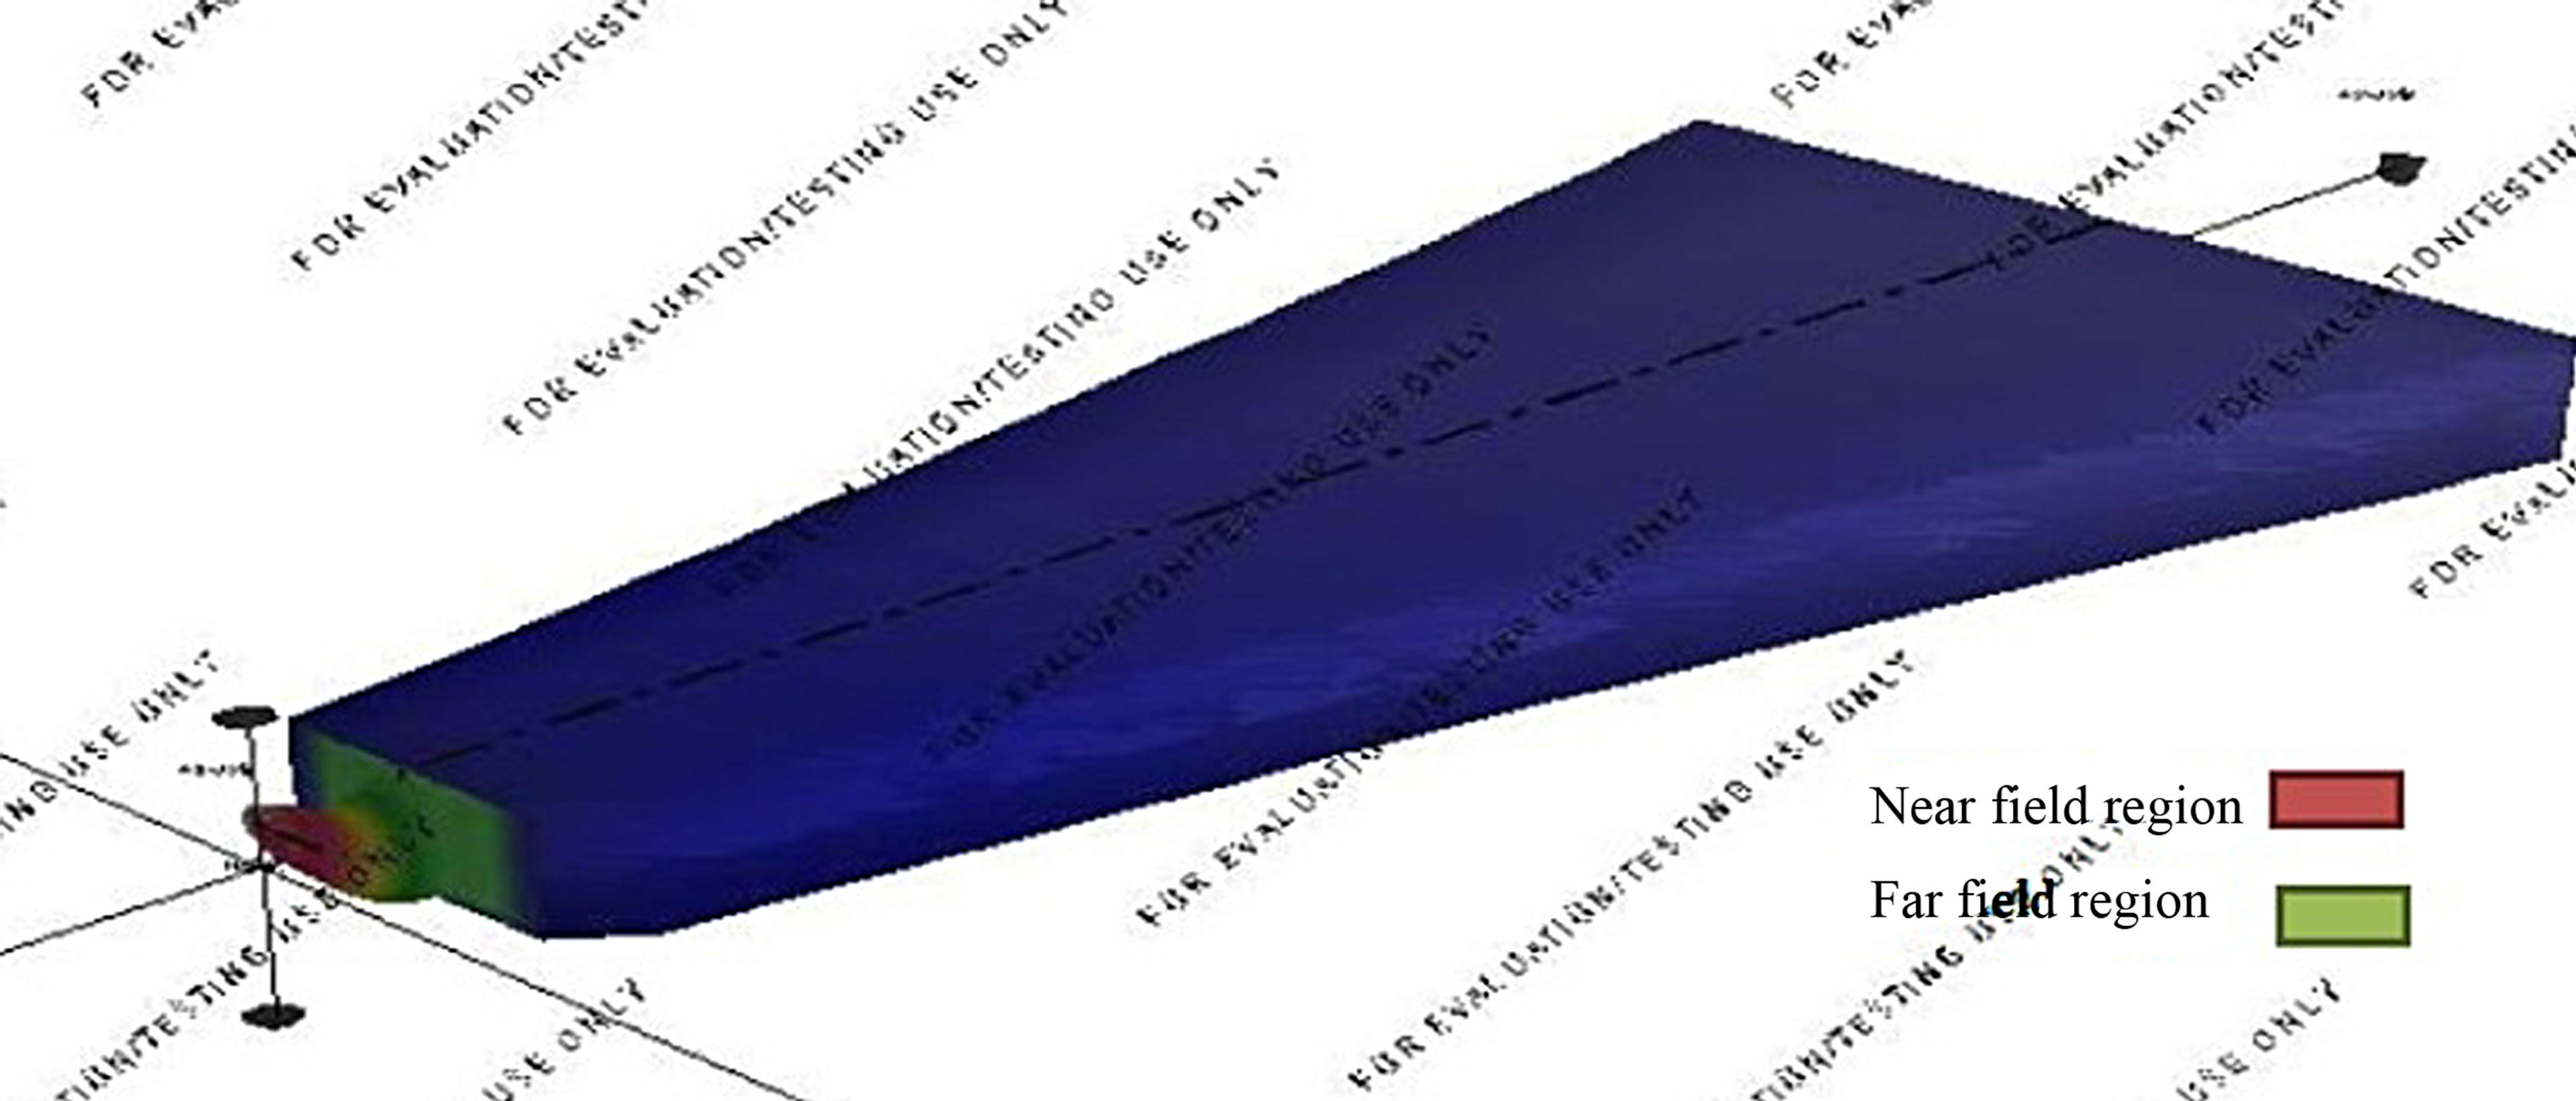
Figure 4. Generated 3-D View of Hydrodynamic Model Simulation Result for Multi-Port Diffuser.
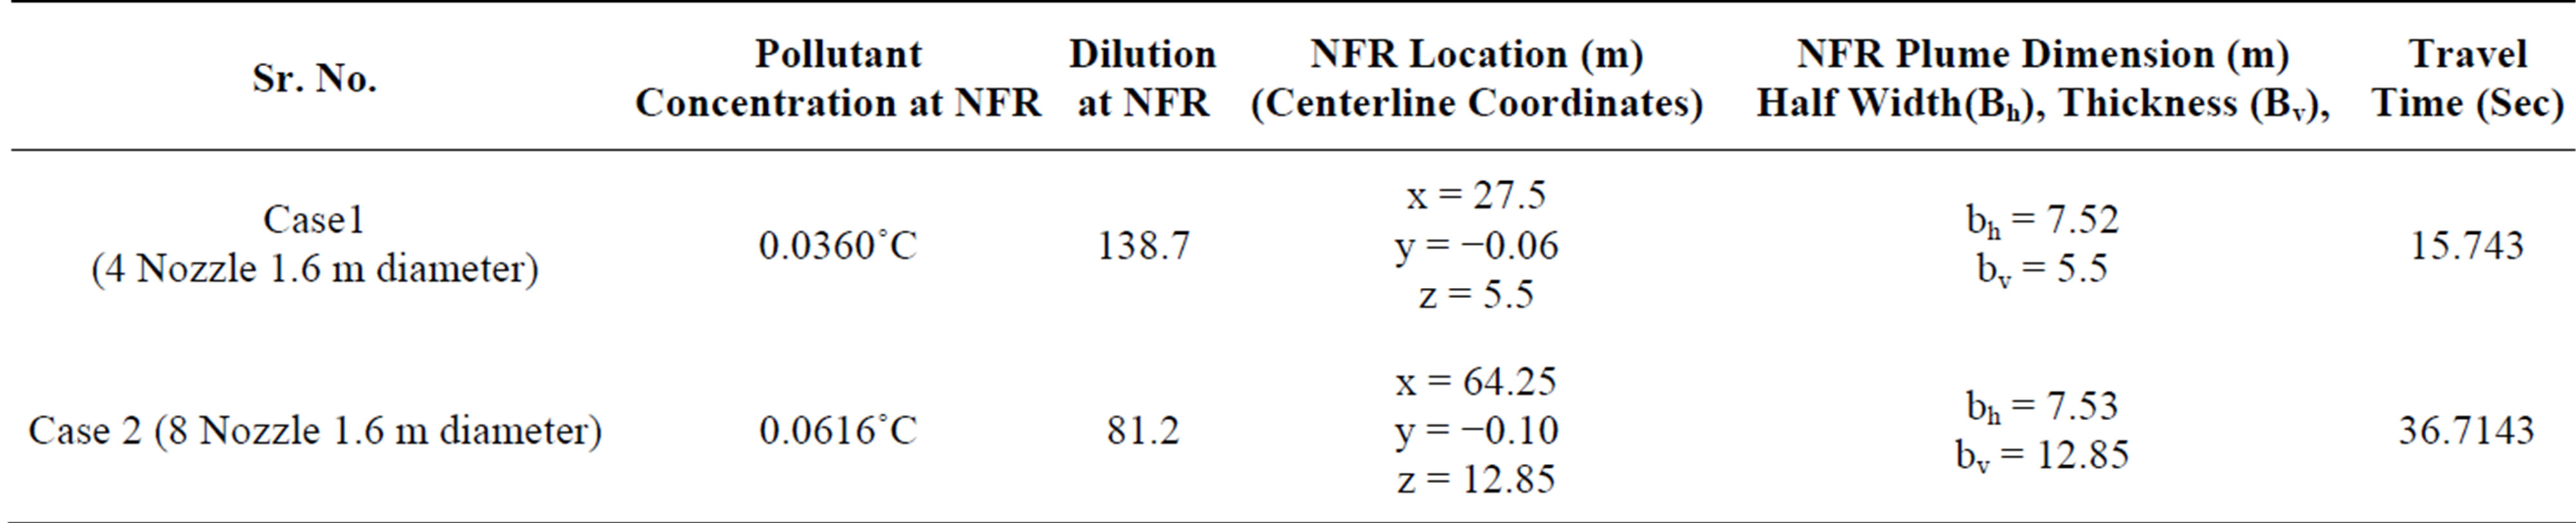
Table 2. Model Output Parameters.
phytoplankton and zooplankton of the port.
5. Acknowledgements
The authors would like to thank to Director, National Environmental Engineering Research Institute for providing encouragement and facilities to carry out this work.
REFERENCES
- B. S. Halpern, K. L. McLeod, A. A. Rosenberg and L.B. Crowder, “Managing for Cumulative Impacts in Ecosystem-Based Management through Ocean Zoning,” Ocean & Coastal Management, Vol. 51, 2008, pp. 203-211. http://dx.doi.org/10.1016/j.ocecoaman.2007.08.002
- A. S. Unikrishnan, “Numerical Modelling of Tides And Tidal Currents in The Gulf of Kutch,” Proceedings of the 2nd Indian National Conference on Harbour and Ocean Engineering, Thiruvananthapuram, 7-10 December 1997. pp. 126-131.
- Mukhtasor, Master of Engineering Thesis, Faculty of Engineering and Applied Science Memorial University of Newfoundland, 1998.
- World Bank Group, “Environmental, Health, and Safety (EHS) Guidelines,” 2007.
- United States Environmental Protection Agency, “Technical Support Document for Water Quality-Based Toxics Control,” 1991.
- United States Environmental Protection Agency (1991b). Assessment & Control of Bio-concentratable Contaminants in Surface Waters.
- P. J. Akar and G. H. Jirka, “CORMIX2: An Expert System for Hydrodynamic Mixing Zone Analysis of Conventional and Toxic Multiport Diffuser Discharges,” 1991.
- National hydrographic office (NHO), Nautical Chart 2101, 2034.
- Report On Mathematical Modelling of Hydrodynamic And Dispersion Studies, January 2012.
NOTES
*Corresponding author.