Journal of Applied Mathematics and Physics
Vol.2 No.3(2014), Article ID:42740,10 pages DOI:10.4236/jamp.2014.23001
Probabilistic Distributions for Acacia Mearnsii De Wild Total Height and the Influence of Environmental Factors
Department of Forest Science, University Federal of Paraná, Curitiba, Brazil
Email: *carlos_sanquetta@hotmail.com, alexandre.behling@yahoo.com.br, allanpelissari@gmail.com, anapaulacorte@gmail.com, sylviopelliconetto@gmail.com, aasimon@tanac.com.br
Received December 12, 2013; revised January 12, 2014; accepted January 18, 2014
ABSTRACT
This paper discusses the hypothesis of height distribution on a forest stand of Acacia mearnsii De Wild, known as black wattle. It remains constant at varied growing environments and, in addition, they are not influenced by age factor. The Wakeby equation was applied. The research was carried out in a black wattle stand at varied age levels and over two different agroecological regions where plantations are found: Serra do Sudeste and Encosta do Sudeste, Rio Grande do Sul State, Brazil. It was observed that as the age rises there is an increase in the stand total height; while the number of trees decreases for the lower classes, it increases for the upper ones. This resulted in lengthening of the curve tail to the left and mode shift to the right, generating negative asymmetrical curves. Two types of height distribution were found: the sharp increase of probability in a specific class and some similar probabilities in successive classes. The distribution curves between the cultivation areas were statistically different and therefore the height distribution was dependent of environment.
Keywords:Wakeby Distribution; Forest Stand Age; Cultivation Area; Forest Structure
1. Introduction
The forestry production forecast, especially by wood volume, is an important problem in the Forestry Science and the lack of comprehensive studies, as the stem diameter and tree height are related to the volume, so these variables become the main elements to the forest structure assess.
The stem diameter and tree height distribution are particularly valuable to the estimation of the forest stand volume and necessary for the production planning. Even for those non-properly planned forest stands, the class distribution modeling for those variables promotes useful information as a comparison standard among various stands.
The probabilistic model may express the empirical distribution of various stand variables, since their parameters are properly estimated. Among the parameter estimation methods are highlighted the moments [1], maximum likehood [2] and percentile [3]. A great number of probability density functions (henceforth called PDF) have been applied in the Forest Science, and the studies in the most part are related to stem diameter.
The Weibull PDF is one of the functions of the best performing for modeling the diameter distribution. For this reason, it is used in many situations, mainly in the forest sector, such as [4-13]. Besides, it is also easy and correlated to the stand characteristics [4].
The authors [14,15] observed that other functions demonstrated superiority related to the Weibull. According to these researches, the Burr and Dagum were more flexible than Weibull as they covered an area of greater asymmetry and kurtosis. Others have also been widely used as: Beta [16-21], Gamma [22], Johnson’s SB [23-25] and Log-normal [26].
It is known that the growing and production levels of a certain species are considerably varied to the detriment of environment. The tree height, particularly the dominant one, is a variable strongly related to environmental factors and has little influence of silvicultural treatments and tree competition. For this reason, it is considerably applied to the growing and production models.
However, understanding the height behavior of the trees is relevant and allows the forester to have the knowledge of many factors related to the cultural treatments for decision making. However, there are few works that modeled the height distribution, even when related to the stem diameter. As examples: [27-33].
The height probabilistic distribution is a practical tool for the prediction of the section number in the stem wood with pre-established dimensions on the basis of mechanized harvest. The height growing assess is integrated to the cultivation environment, or the last soil use, as the cultural treatments and planting model. There is also the possibility to evaluate the pest, disease and others. Thus, the study hypothesis is based on the presupposition that tree height distribution and growth keep constant in varied environment conditions and stand age.
The black wattle species, which is used in this study, is one of the most important forest species in Brazil not only economically but also environmentally and socially. Besides, being the most cultivated genera in the country by small farmers, its cultivation generates thousands of direct or indirect jobs. The cultivation is performed in South of Rio Grande do Sul State especially in two agroecological regions: Serra do Sudeste e Encosta do Sudeste, so over different environmental conditions.
In this way, for the present research, it was aimed to verify whether the different cultivation environments influence in the stand height distribution of black wattle. Additionally, we studied the age effects on the height distribution.
2. Methodology
The data of 24 temporary plot were used for the present work. The plots were performed in commercial planting of black wattle in the agroecological regions of Serra do Sudeste and Encosta do Sudeste in the Rio Grande do Sul State. For each location it was performed studies for different stand age: one; three, five and seven years, in order to cover the crop cycle.
In the Encosta do Sudeste, the evaluated areas are located between 30˚54’ South and 50˚40’ West coordinates and in the Serra do Sudeste, are between 31˚25’ South and 52˚58’ West, all in the altitude of 320 to 370 meters above sea level.
For both regions, the plantings were made even for new areas (first rotation) and for areas under reformation (second rotation), according to Framework 1. For all cases, the soil preparation was performed on the crop row (minimal cultivation), the plots were subsoiled with three chisel plows in a 40 cm depth and harrowed twice. The crop spacing was of 3 × 1.75 m (1904 plant/ ha) for the first year treatment and 3 × 1.5 m (2222 plants/ ha) for the other ages and added 50 g of NPK (5-30-15) by plant.
For each stand was selected a northern exposure slope, where three plots were designated in the superior, medium and inferior one-third. The plot sizes were delimited in 9 × 16 m for the one year stands and 9 × 14 m for the others, in a total of 4 crop rows with 10 plants each.
The stem diameter was measured for the plots, in a height of 1.3 m from soil, using a dendrometrical tape measure and the height with an electronic clinometer (Haglöf), together with a digital tape measure (Sonin Multimeasure Combro-pró, 10300) in order to identify the distance to the tree.
Framework 1. List of the areas where stands were performed.
In which: First rotation refers to the first planting on the area, while the Second rotation refers to the second planting on the area.
The following PDFs were tested to describe the height frequency: Beta, Burr (3p and 4p), Dagum (3p and 4p), Gamma (2p and 3p), Generalized Extreme Value, Generalized Logistic, Generalized Pareto, Log-logistic (3p), Normal, Pert, Wakeby and Weibull (2p and 3p).
All functions were adjusted using the Maximum Likehood Method by stand age (1, 3, 5 and 7) and cultivation area (Encosta do Sudeste e Serra do Sudeste). The class amplitude was 1 meter for 1 year stand and 2 meters for the others. The number of classes has varied due to the amplitude obtained from each stand.
The best probabilistic function was selected after the Kolmogorov-Smirnov test at 5% probability. The statistical scores were used joint to the Kolmogorov-Smirnov test. And then put in order according to efficiency, where the most efficient got 1 and higher values for the other functions establishing a ranking. So, the selected function was the one that presented the lowest value.
The cultivation environment and age level effect over the development of the diameter distribution curves was evaluated on the asymmetry and kurtosis measurements and mean and maximum and minimum.
The asymmetry was evaluated according to the following aspects:
• Symmetric: mode = median = arithmetic mean.
• Negative asymmetry: mode < median < arithmetic mean.
• Positive asymmetry: mode > median > arithmetic mean.
If the module correlation coefficient is between 0.15 and 1, the asymmetry is considered moderate, and if it is higher than 1, that is considered strong.
While kurtosis is the relative flatness or peakedness degree of a distribution, usually considered in a normal distribution. [34,35] defined three kurtosis curve types:
• Leptokurtic: highly peaked distribution, negative, kurtosis coefficient < 0.263.
• Platykurtic: the curve is flatter topped, positive, so the kurtosis coefficient is > 0.263.
• Mesokurtic: intermediate curve, the kurtosis coefficient is 0.263.
• After choosing the best-fit function, and compering the curves, i.e., checking the significant difference, the chi-square test was applied (χ²). The χ² was obtained through:
 (2.1)
(2.1)
where:
fi = i class probability;
Fi = class i calculated probability and n = total frequency.
Firstly, the test was performed for each stand age, which allows verifying the environmental effects of each region over height distribution. Secondly, applied to each area to verify the age effect reaching all age combinations: 1 to 3; 1 to 5; 1 to 7; 3 to 5; 3 to 7; and 5 to 7 years. The significance was verified at 5% probability.
3. Results
3.1. Exploratory Analysis of the Variables: Total Height, Diameter at Breast Height and Survival
The statistics for total height and stem diameter regardless cultivation area are presented in Table1 The found means for the height variable were: 5.77 m; 10.50 m; 14.09 m; and 16.95 m for 1; 3; 5; and 7 years respectively. For the stem diameter the means were: 5.09 cm; 8.15 cm; 10.29 cm and 12.79 cm, also respectively to age level. And the survival was: 91%; 86%; 75%; and 65% at the same sequence. The longest intervals, due to the variable range, were observed to 5 and 7 stands. Consequently, the largest standard deviations were observed for the same stands.
3.2. Distribution Selection
The Kolmogorov-Smirnov test for goodness of fit for each stand age and cultivation area is presented in Table2 Among the tested functions, the test has shown that the Burr (4p); Dagum; Gen. Extreme Value; Gen. Logistic; Wakeby and Weibull (3p) were flexible enough to represent the height distribution for all ages and areas because the test values were not significant. This indicates that the predicted and observed frequencies do not differ statistically in such essential respects as the null hypothesis. On the other hand, significant values indicate inadequate estimates of the height frequency due to the test sensitivity to any difference from the main value and

Table 1 . Descriptive Statistics for: total height and diameter at breast height, measured in Acacia mearnsii De Wild stands at 1; 3; 5; and 7 years in Cristal and Piratini County, Rio Grande do Sul State, Brazil.
Table 2 . The Kolmogorov-Smirnov test of the 19 PDFs to describe the height frequency in black wattle stands at 1; 3; 5; and 7 years, located in Serra do Sudeste and Encosta do Sudeste, Rio Grande do Sul State, Brazil.
Table 3 .Statistical scores due to the best-fit function order evaluated by Kolmogorov-Smirnov test.
Where: ns = non-significant at 5% probability; and *significant at 5% probability according to Kolmogorov-Smirnov distribution.
theoretical dispersion of a data set [8].
For the best-fit functions in the Kolmogorov-Smirnov test, there was an assignment of weights to these values so that best-fit equation got 1 and the others in a growing weight ranking. In this way, the best-fit function was the one with the lowest score value, in this case obtained from Wakeby function (Table 3).
The Wakeby function coefficients are presented in Table 4 and the frequencies and values observed in Figure 1. As shown in Figure 1, more clearly in stands 7 years old, the smaller height classes are somehow atypical for the adjustment of probability functions such as Weibull, Gamma and Beta, and because of that the Wakeby function was selected.
3.3. Age and Cultivation Environment Effects Height Distribution
As time passed, there was an increasing trend in height total amplitude, the number of trees has decreased for the lowest classes and increased for the highest ones and as a result the curve sharpness changed to the right. The asymmetry indexes and kurtosis indicated an enhance of asymmetry over time, generating negative asym
Table 4. Adjusted coefficient to Wakeby function to describe the probability of tree occurrence in height class function in black wattle stand at 1; 3; 5; and 7 years in Serra do Sudeste (left) and Encosta do Sudeste (right), in Rio Grande do Sul State, Brazil.
metries, i.e., a distribution with a longer right tail. The distribution was symmetric in the initial age (1 year), and a moderate symmetry in the other ones. In accordance with kurtosis, they are considered leptokurtic for all ages (Table 5).
In order to evaluate the height distribution in the black wattle stand over time and its effects on the Wakeby predicted curves, it was plotted for each age and in each cultivation area curves based on the best-fit function (Figure 2).
When comparing the areas in each age, it was found specific height distribution because all the chi-square values were significant (P < 0.05), except for 5 and 7 year stands in the Encosta do Sudeste. For the first ages the individual frequency was higher in the lowest height classes, although decreasing as the age goes up. At the same time, due to the forest growing, the major height frequency became higher as the age increases changing the curve to the right side (Figure 2).
Curves were plotted for each stand age, allowing the verification of local effect. Thus, all the chi-square tests were significant, being an indicative of the difference between the agroecological regions. The stands at 1; 3 and 5 years in the Encosta do Sudeste tended to present major frequency of tree height in the higher classes, what has changed when comparing with 7 years. Furthermore, the distribution curve shape has also changed between those cultivation areas (Figure 2).
4. Discussions
The Wakeby function was the most flexible among the tested ones, to accurately describe the probability of individual occurrence on the basis of height class for all stand ages and in both agroecological regions. The Wakeby properties might be found with details in [36]. The adjustment by the Maximum Likehood Estimation (MLE) method for this function is presented by [37,38]. The Wakeby distribution is defined by its quantile function or by the inverse function of cumulative distribution, x(F), being:
 (4.1)
(4.1)
where: α, β, γ, δ, ξ are distribution parameters.
In the distribution are conferred the following restrictions:
α ≠ 0 ou γ ≠ 0, β + δ > 0 ou β = γ = 0, Se α = 0, então β = 0, Se γ = 0, então δ = 0, γ ≥ 0 e α + γ ≥ 0.


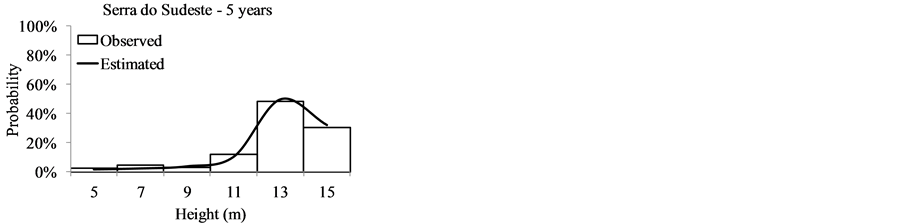


Figure 1. Observed and Predicted values by Wakeby function on the probability of tree occurrence in height class function in black wattle stand at 1; 3; 5; and 7 years in Serra do Sudeste (left) and Encosta do Sudeste (right), in Rio Grande do Sul State, Brazil.
Table 5. Average, minimum, maximum height values and median, mode, asymmetry and kurtosis for a black wattle stand at 1; 3; 5; and 7 years in Serra do Sudeste and Encosta do Sudeste, Rio Grande do Sul State, Brazil.
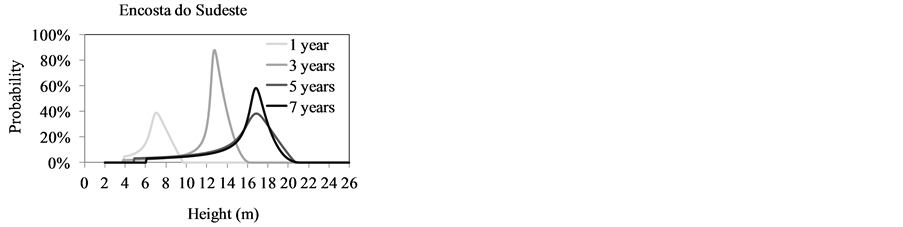


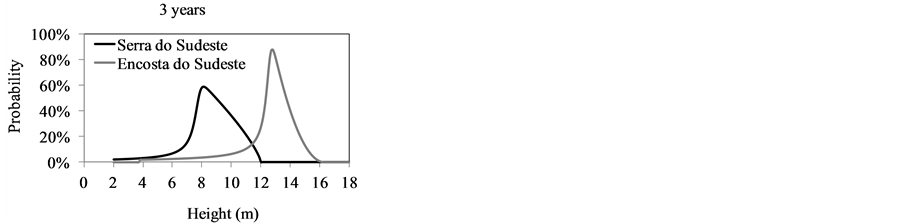


Figure 2. Tree occurrence probability for each height class related to the age and cultivation area of black wattle stand in Rio Grande do Sul, Brazil.
The tree height frequencies presented different distribution for all stands, however, having as a common characteristic the sharp increase in probability for a certain class and similar probabilities for the successive ones. The Wakeby distribution presented by [39] was flexible enough for this. So that was possible by the use of a more flexible function with more parameters than those traditionally used. For the height distribution of Pinus sylvestris L., [33] observed that Dagum and Burr functions were more flexible to represent the height frequencies, while [30] used the Weibull.
The Wakeby distribution has been mainly used for modeling extreme events and in the most cases for hydrology studies, for example researches developed by [40-45]. The distribution has five parameters, more than the most used ones. Nevertheless, it allows more flexibility and variety in shape and curve and can be expected to have a good function performance on the basis of variability of sample frequencies. In fact, that was more flexible when compared to the traditional ones applied in the Forestry Sciences as Weibull, Beta and Gamma.
As the stand age grows older, the tails tend to lengthen to the left. At the same time, the better probability peaks, revealed by the modal class moved to the right with different intensity for each cultivation area, resulting in distinct heights. [46] cited many factors that may influence in the forest structure being as inherent – ageing and genetics; as physical—the local properties; natural—fire, wind and insects and also those related to the management—as thinning. [47] added that in same age stands; the light, water and nutrient competition depends on the number of individuals in a certain area and by the canopy enclosure some trees become dominant while others are suppressed. Thus, these factors act in the forest height distribution.
In younger stands, one year old, the distribution was symmetric and, as the ageing progress they tended to present asymmetrical distribution. It was resulted by the forest growth effect in disproportionate way along the height classes that is a competition effect, in which some of them stand out from the others. The negative asymmetry or to the right happens by the frequency increase of height in the highest classes.
Even though the Encosta do Sudeste soils are less fertile, the stand until five years tend to present higher frequencies of height in the higher classes. Only the seven year stands in Serra do Sudeste present the highest height frequencies in the higher classes and, for both areas at this age, the mode remained in the same class, however differed in the median and maximum values.
In the Encosta do Sudeste, the curve shift to the right was bigger until the five year stand, when stabilization started. The five and seven year stands revealed average, maximum, minimum height values as median and mode at the same frequency class, being observed instability only for asymmetry and kurtosis, probably because of the few changes based on the intraspecific competition.
Moreover, in the Serra do Sudeste there was no stabilization of these values, which is possibly due to the fact that the 7 year stand present better soil characteristics to the black wattle cultivation, specially to the phosphorus content that favor the species growth as observed by [48,49].
[48,49] in South Africa and [50] in Rio Grande do Sul State-Brazil, have researched the influence of chemical and physical soil attributes in the growth of dendrometric variables of black wattle. These authors observed a direct relation between physical and chemical soil properties and the species growth, however impaired, because the correlations were not high.
The major distribution differences between the two cultivation areas seem to be reflection of the soil characteristics, once there was no great contrast in the weather element values. It was proved that the cultivation environment influences in the height distribution, despite the difficulty of a direct relation establishment with the weather and soil elements and their effects over the height distribution. According to [50], the black wattle species has aptitudes to grow well in soils with non-favorable physical characteristics since the chemical ones are favorable or vice versa.
In this way, it is true that researches treating of the relation between cultivation environment and height distribution must be performed, as the final result brings information for culture management. Furthermore, it became obvious that the probabilistic function is utilized to assess cultivated stands at varied situations.
5. Conclusions
The Burr (4p), Dagum, Gen. Extreme Value, Gen. Logistic, Wakeby and Weibull (3p) functions are flexible to represent the height distribution of black wattle along all stand ages.
The Wakeby function describes adequately the occurrence probability of individuals on the basis of height class, what allows identifying that:
• As the stands get older there is a tendency of increase in total height amplitude, the number of trees decreases for the lower classes and increases for the higher ones. This causes a tail lengthening to the left and mode shift to the right, resulting in negative asymmetric curves. The curve shift is different and obtains varied height distributions between the two cultivation areas.
• The distribution is symmetric in the younger stands (1 year); and, as the age advances, the distributions become asymmetric due to the forest growth effect in a disproportional way along height classes. All curves are leptokurtic.
• The curve shift to the right for the Encosta do Sudeste is higher until the 5 year stand. When a stabilization start, that is not observed in Serra do Sudeste.
• Two characteristics are common to the height distribution: the sharp increase of the probability for a certain class and similar probability occurrence for successive classes.
• The distribution curves between cultivation areas are statistically different, so the height distribution depends on the cultivation environment.
• The differences between the two cultivation areas are a reflection of soil characteristics. Once there are no bigger differences for the weather elements, it is difficult to establish a direct relation among them.
In this way, it is true that researches on the treating of the relation between cultivation environment and height distribution must be performed, as the final result brings information for culture management.
It is obvious that the probabilistic function is utilized to assess cultivated stands at varied situations.
Acknowledgements
The authors thank TANAGRO S.A. Company, to the Agroclimatology Laboratory of Santa Maria’s Federal University and the Research Excellency Center for Carbon Sink in Biomass for the collaboration in this research and also to CNPq to grant a scholarship at master’s degree level for Alexandre Behling.
REFERENCES
- K. Pearson, “On the Systematic Fitting of Curves to Observations and Measurements, Parts I and II,” Biometrika, Vol. 1, No. 3, 1902, pp. 265-303. http://dx.doi.org/10.1093/biomet/1.3.265
- R. A. Fisher, “On the Mathematical Foundations of Theoretical Statistics,” Philosophical Transactions of the Royal Society of London, Vol. 222, No. 594-604, 1922, pp. 309-368. http://dx.doi.org/10.1098/rsta.1922.0009
- S. D. Dubey, “Some Percentile Estimators for Weibull Parameters,” Technometrics, Vol. 9, No. 1, 1967, pp. 119-129. http://dx.doi.org/10.1080/00401706.1967.10490445
- R. L. Bailey and T. R. Dell, “Quantifying Diameter Distributions with the Weibull Function,” Forest Science, Vol. 19, No. 2, 1973, pp. 97-104.
- G. W. Smalley and R. L. Bailey, “Yield Tables and Stand Structure for Loblolly Pine Plantations in Tennessee, Alabama, and Georgia Highlands,” Department of Agriculture, Forest Service, Southern Forest Experiment Station, New Orleans, 1974.
- J. L. Clutter and B. J. Allison, “A Growth and Yield Model for Pinus radiata in New Zealand for Tree and Stand Simulation,” Royal College of Forestry, Stockholm, 1974.
- J. L. Clutter, W. R. Harms, G. H. Brister and J. W. Rhenney, “Stand Structure and Yields of Site-Prepared Loblolly Pine Plantations in the Lower Coastal Plain of the Carolinas,” Gergia Forest Research Council, Atlanta, 1984.
- Q. V. Cao, “Predicting Parameters of a Weibull Function for Modeling Diameter Distribution,” Forest Science, Vol. 50, 2004, pp. 682-685.
- M. Palahi, T. Pukkala and A. Trasobares, “Modelling the Diameter Distribution of Pinus sylvestris, Pinus nigra and Pinus halepensis Forest Stands in Catalonia Using the Truncated Weibull Function,” Forestry, Vol. 79, No. 5, 2006, pp. 553-562. http://dx.doi.org/10.1093/forestry/cpl037
- L. C. Jiang and J. R. Brooks, “Predicting Diameter Distributions for Young Longleaf Pine Plantations in Southwest Georgia,” Southern Journal of Applied Forestry, Vol. 33, 2009, pp. 25-28.
- S. Andrasev, M. Bobinac and S. Orlovic, “Diameter Structure Models of Black Poplar Selected Clones in the Section Aigeiros (Duby) Obtained by the Weibull Distribution,” Sumarski List, Vol. 133, No. 11-12, 2009, pp. 589-603.
- R. Petráš, J. Mecko and V. Nociar, “Diameter Structure of the Stands of Piplar Clones,” Journal of Forest Science, Vol. 56, No. 4, 2010, pp. 165-170.
- A. C. Carretero and E. T. Alvarez, “Modelling Diameter Distributions of L. Stands in ‘Los Alcornocales’ Natural Park (Cádiz-Málaga, Spain) by Using the Two Parameter Weibull Functions,” Forest Systems, Vol. 22, No. 1, 2013, pp. 15-24. http://dx.doi.org/10.5424/fs/2013221-02142
- S. R. Lindsay, G. R. Wood and R. C. Woollons, “Modelling the Diameter Distribution of Forest Stands Using the Burr Distribution,” Journal of Applied Statistics, Vol. 23, No. 6, 1996, pp. 609-619. http://dx.doi.org/10.1080/02664769623973
- J. H. Gove, M. J. Ducey, W. B. Leak and L. Zhang, “Rotated Sigmoid Structures in Managed Uneven-Aged Northern Hardwood Stands: A Look at the Burr type III Distribution,” Forestry, Vol. 81, No. 2, 2008, pp. 161-176. http://dx.doi.org/10.1093/forestry/cpm025
- J. L. Clutter and F. A. Bennett, “Diameter Distributions in Old-Field Slash Pine Plantations,” Georgia Forest Research Council, 1965, pp. 1-9.
- F. A. Bennett and J. L. Clutter, “Multiple-Product Yield Estimates for Unthinned Slash Pine Plantations—Pulpwood, Saw Timber, Gum,” Gergia Forest Research Council, Atlanta, 1968.
- J. D. Lenhart and J. L. Clutter, “Cubic-Foot Yield Tables for Old-Field Loblolly Pine Plantations in the Georgia Piedmont,” Gergia Forest Research Council, Atlanta, 1971.
- H. E. Burkhart and M. R. Strub, “A Model for Simulation of Planted Loblolly Pine Stands,” In: J. Fries, Ed., Growth Models for Tree and Stand Simulation, Royal College of Forestry, Stockholm, 1974, pp. 128-135.
- F. A. Bennett, F. T. Lloyd, B. F. Swindel and E. W. Whitehorne, “Yields of Veneer and Associated Products from Unthinned, Old-Field Plantations of Slash Pine in the North Florida and South Georgia Flatwoods,” Gergia Forest Research Council, Atlanta, 1978.
- J. J. Gorgoso-Varela, A. Rojo-Alboreca, E. Afif-Khouri and M. Barrio-Anta, “Modeling Diameter Distributions of Birch (Betula alba L.) and Pedunculate Oak (Quercus robur L.) Stands in Northwest Spain with the Beta Distribution,” Investigación Agraria, Sistemas y Recursos Forestales, Vol. 17, 2008, pp. 271-281.
- T. C. Nelson, “Diameter Distribution and Growth of Loblolly Pine,” Forest Science, Vol. 10, No. 1, 1964, pp. 105-114.
- W. L. Hafley, W. D. Smith and M. A. Buford, “A New Yield Prediction Model for Unthinned Loblolly Pine Plantations,” North Carolina State University, Raleigh, 1982.
- K. Rennolls and M. Wang, “A New Parameterization of Johnson’s SB Distribution with Application to Fitting Forest Tree Diameter data,” Canadian Journal of Forest Research, Vol. 35, No. 3, 2005, pp. 575-579. http://dx.doi.org/10.1139/x05-006
- T. F. Fonseca, C. P. Marques and B. R. Parresol, “Describing Maritime Pine Diameter Distributions with Johnson’s SB Distribution Using a New All-Parameter Recovery Approach,” Forest Science, Vol. 55, No. 4, 2009, pp. 367-373.
- C. I. Bliss and K. A. Reinker, “A Log-Normal Approach to Diameter Distribution in Even-Aged Stands,” Forest Science, Vol. 10, 1964, pp. 350-360.
- H. T. Schreuder and W. L. Hafley, “A Useful Bivariate Distribution for Describing Stand Structure Os Tree Heights and Diameters,” Biometrics, Vol. 33, No. 3, 1977, pp. 471-478. http://dx.doi.org/10.2307/2529361
- C. M. Chen and D. V. Rose, “Direct and Indirect Estimation of Height Distributions in Even-Aged Stands,” Minnesota Forestry Research Notes, No. 267, 1978.
- V. P. Tewari and K. V. Gadow, “Modelling the Relationship between Tree Diameters and Heights Using SBB Distribution,” Forest Ecology and Management, Vol. 119, No. 1-3, 1999, pp. 171-176. http://dx.doi.org/10.1016/S0378-1127(98)00520-9
- J. Siipilehto, “Height Distributions of Scots Pine Sapling Stands Affected by Retained Tree and Edge Stand Competition,” Silva Fennica, Vol. 40, No. 3, 2006, pp. 473-486.
- S. A. Machado, R. G. M. Nascimento, E. P. Miguel, S. J. Téo and A. L. D. Augustynczik, “Distribution of Total Height, Transvrese Área and Individual Volume for Araucaria angustifolia (Bert.) O. Kuntze,” Cerne, Vol. 16, No. 1, 2010, pp. 12-21.
- M. Wang, A. Upadhyay and L. J. Zhang, “Trivariate Distribution Modeling of Tree Diameter, Height, and Volume,” Forest Science, Vol. 56, No. 3, 2010, pp. 290-300.
- K. Tsogt, T. Zandraabal and C. S. Lin, “Diameter and Height Distributions of Natural Even-Aged Pine Forests (Pinus sylvestris) in Western Khentey, Mongolia,” Journal of Forest Science, Vol. 28, No. 1, 2013, pp. 29-41.
- K. Pearson, “Contributions to the Mathematical Theory of Evolution, II: Skew Variation in Homogeneous Material,” Philosophical Transactions of the Royal Society of London, Vol. 186, 1985, pp. 343-414. http://dx.doi.org/10.1098/rsta.1895.0010
- K. R. Pearson, “Skew Variation, a Rejoinder,” Biometrika, Vol. 4, No. 1-2, 1905, pp. 169-212. http://dx.doi.org/10.2307/2331536
- N. L. Johnson, S. Kotz and N. Balakrishnan, “Continuous Univariate Distributions,” Applied Probability and Statistics, New York, 1995.
- J. S. Park and J. W. Jeon, “Maximum Likelihood Estimation of Wakeby Distribution,” Technical Report, Kwangju, 2000.
- A. Tarsitano, “Fitting Wakeby Model Using Maximum Likelihood,” Statistica e Ambiente, Messina, 21-23 September 2005, pp. 253-256.
- J. C. Houghton, “Birth of a Parent: The Wakeby Distribution for Modeling Flood Flow,” Water Resources Research, Vol. 14, No. 6, 1978, pp. 1105-1109.
- G. A. Griffiths, “A Theoretically Based Wakeby Distribution for Annual Flood Series,” Hydrological Sciences, Vol. 34, No. 3, 1989, pp. 231-248. http://dx.doi.org/10.1080/02626668909491332
- D. S. Wilks and M. McKay, “Extreme-Value Statistics for Snowpack Water Equivalent in the Northeastern United States Using the Cooperative Observer Network,” Journal of Applied Meteorology, Vo. 35, No. 5, 1996, pp. 706-713. http://dx.doi.org/10.1175/1520-0450(1996)035<0706:EVSFSW>2.0.CO;2
- J. S. Park, H. S. Jung, R. S. Kim and J. H. Oh, “Modelling Summer Extreme Rainfall Over the Korean Peninsula Using Wakeby Distributions,” International Journal of Climatology, Vol. 21, No. 11, 2001, pp. 1371-1384. http://dx.doi.org/10.1002/joc.701
- T. Öztekin, “Wakeby Distribution for Representing Anual Extreme and Partial Duration Rainfall Series,” Meteorological Applications, Vol. 14, No. 4, 2007, pp. 381-387. http://dx.doi.org/10.1002/met.37
- B. Su, X. W. Kundzewiez and T. Jiang, “Simulation of Extreme Precipitation over the Yangtze River Basin Using Wakeby Distribution,” Theoretical and Applied Climatology, Vol. 96, No. 3-4, 2009, pp. 209-219.
- T. Fischer, B. Su, Y. Luo and T. Scholten, “Probability Distribution of Precipitation Extremes for Weather Index-Based Insurance in the Zhujiang River Basin, South China,” Journal of Hydrometeorology, Vol. 13, No. 3, 2012, pp. 1023-1037. http://dx.doi.org/10.1175/JHM-D-11-041.1
- C. Oliver and B. Larson, “Forest Stand Dynamics: Update Edition,” John Wiley, New York, 1996
- B. V. Barnes, D. R. Zak, S. R. Denton and S. H. Spurr, “Forest Ecology,” 4th Edition, John Wiley & Sons, New York, 1998.
- M. A. Herbert, “Fertilisation of Trees at Planting,” In: L. MacLennam, Ed., Annual Research Report, Institute for Commercial Forestry Research, Pietermaritzburg, 1991, pp. 81-91.
- A. P. G. Schöunau and W. J. K. Aldworth, “Site Evaluation in Back Watle with Special Reference to Soil Factors,” South African Forestry Journal, No. 156, 1991, pp. 1-6.
NOTES

*Corresponding author.