Detection
Vol.03 No.04(2015), Article ID:58941,7 pages
10.4236/detection.2015.34004
Radium and Uranium Concentrations Measurements in Vegetables Samples of Iraq
Abdalsattar Kareem Hashim1*, Laith Ahmed Najam2
1Department of Physics, College of Science, Kerbala University, Kerbala, Iraq
2Department of Physics, College of Science, Mosul University, Mosul, Iraq
Email: *abdalsattarkareem@yahoo.com
Copyright © 2015 by authors and Scientific Research Publishing Inc.
This work is licensed under the Creative Commons Attribution International License (CC BY).
http://creativecommons.org/licenses/by/4.0/


Received 6 July 2015; accepted 18 August 2015; published 21 August 2015
ABSTRACT
In the present study twenty-two vegetable samples were collected from Iraqi market. Sealed can technique using CR-39 plastic track detector strippable has been used in order to measure radium and uranium concentrations. Etching was done with 6.25 N NaOH and optical microscope was used with the purpose of counting of alpha particle tracks. The values of effective radium content are found to range from 0.074 Bq/ kg to 0.566 Bq/ kg with the mean value of 0.317 Bq/kg. The values of uranium concentrations are found to range from 0.081 ppm to 0.615 ppm with the mean value of 0.345 ppm. Positive correlation has been observed between radium concentration and uranium concentrations in vegetable samples. Measurements of radium and uranium concentrations in vegetables are important from the health protection point of view, so simple and reliable analytical methods must be available.
Keywords:
Radium, Uranium, Can Technique, CR-39 Detectors, Vegetables, Iraqi Markets

1. Introduction
Studies on radiation levels and radionuclide distribution in the environment provide vital radiological baseline information. Such information is essential in understanding human exposure from natural and man-made sources of radiation and necessary in establishing rules and regulations relating to radiation protection [1] .
Uranium and radium belong to the group of primordial radionuclides, as they have always been present in the earth. The radionuclides 238U, 235U and 232Th, which decay through three distinct series of radionuclides, are of great importance in the nuclear fuel cycle. Not only are they present in the human body and foodstuffs but some gaseous radionuclides may also be inhaled. 226Ra (half-life 1600 years), 224Ra and 228Ra (half-lives 3.6 days and 5.8 years, respectively, and both usually mixed with uranium ore) are of radiological importance because radium behaves chemically like calcium, being deposited on bone surfaces and areas of mineral metabolism [2] .
226Ra in the environment is widely distributed, being present in various concentrations in waters, soils, sediments and rocks [3] . When radium is ingested, the majority of material is rapidly excreted. However, since the chemical behavior of radium is similar to that of calcium, radium absorbed to blood from the GI-tract or lungs follows the behavior of calcium and is primarily deposited in bone [4] . Radium is a common radionuclide in the environment and it is the parent of radon. Its form is the most deadly radionuclide’s because it produces alpha radiation and has a very long half-life [5] . The immediate radon precursor is radium (226Ra) that spreads widely, particularly in materials which are made from mineral products. The forerunner of radium is Uranium (238U); which has a half-life of 4.47 × 10⁹ years [6] . During the last decade, there has been an increasing interest in the study of radium activity in various vegetables and food. Since radium is a highly radioactive chemical element and it is the most important source of radioactivity in a variety of foodstuffs. Radium is a solid radioactive element under ordinary conditions of temperature and pressure [7] . Microscopic quantities of radium in the environment can lead to some accumulation of radium in bone tissue whereby it degrades bone marrow and can mutate bone cells. Ingestion or body exposure to radium causes serious health effects which included sores, anemia, bone cancer and other disorders [8] .
Radium present in the soil is taken by the plants and enters into the body with vegetarian/non-vegetarian food and tends to follow calcium metabolic process to become concentrated in bones [9] .
Uranium has been detected in a variety of foodstuffs. The highest concentrations are found in shellfish, and lower levels have been measured in fresh vegetables, cereals and fish. The average per capita intake of uranium in food has been reported to be 1.3 μg/day [10] and 2 - 3 μg/day [11] in the USA and 1.5 μg/day in Japan [12] .
In a review of naturally occurring sources of radioactive contamination in food, dietary intakes of 238U were found to range from 12 to 45 mBq/day in several European countries, from 11 to 60 mBq/day in Japan (the higher values were found in uranium mining areas) and from 15 to 17 mBq/day in the USA. The average daily dietary intake was in the order of 20 mBq, or about 4 μg. It was often difficult to determine whether these dietary intakes included intake from drinking-water, and it was emphasized that intake from drinking-water has some- times been found to be equal to intake from the diet [13] .
Following ingestion, uranium rapidly appears in the bloodstream [14] , where it is associated primarily with the red cells [15] ; a non-diffusible uranyl-albumin complex also forms in equilibrium with a diffusible ionic uranyl hydrogen carbonate complex ( ) in the plasma [16] .
Because of their high affinity for phosphate, carboxyl and hydroxyl groups, uranyl compounds readily combine with proteins and nucleotides to form stable complexes [16] . Clearance from the bloodstream is also rapid, and the uranium subsequently accumulates in the kidneys and the skeleton, whereas little is found in the liver [14] . The skeleton is the major site of uranium accumulation [17] . Based on the results of studies in experimental animals, it appears that the amount of soluble uranium accumulated internally is proportional to the intake from ingestion or inhalation. It has been estimated that the total body burden of uranium in humans is 40 μg, with approximately 40% of this being present in the muscles, 20% in the skeleton and 10%, 4%, 1% and 0.3% in the blood, lungs, liver and kidneys, respectively [18] .
Uranium is the proximate source of radium and radon in the soil and rocks. Uranium prospection through the analysis of soil, rocks, plants and water has been reported by many workers [19] [20] . Uranium, present in the earth, is transferred to water, plants, food supplements and then to human beings. Uranium accumulated in humans may have a dual effect due to its chemical and radioactive properties. High intake of uranium and its decay products may lead to harmful effects in human beings. According to an estimate [21] , food contributes about 15% of ingested uranium, while drinking water contributes about 85%. An exposure of about 0.1 mg∙kg−1 of body weight of soluble natural uranium results in transient chemical damage to the kidneys [22] .
The aim of this research was to determine uranium and radium concentrations in twenty two types of vegetables. So, the measurement of uranium and radium concentrations in vegetables is necessary to investigate the role of radium and uranium concentration in causing various diseases, especially cancer.
2. Materials and Method
In the present study, 22 different samples from vegetables, were investigated. The samples were collected from Iraqi market. Vegetable samples were washed, peeled when necessary, and dried in air. After that, they were oven dried at 80˚C for approximately 16 h [23] .
The vegetable samples were dried in oven, minced, crushed, sieved by 1-mm mesh, weighted, and carefully sealed for 81 days in a cylindrical containers made of plastic with dimensions of 3.5 cm in diameter and 6.5 cm in depth. A piece of CR-39 detector of 500 μm thicknesses (American Technical Plastic, Inc.) with area of (1.5 × 1.5) cm was embedded in middle of samples (closed contact α-autoradiography) in each container. The detector records the tracks of alpha-particles emitted by radon gas produced through the alpha-decay of radium contents of the samples. After their radiation period, the bombarded detectors were collected and chemically etched in NaOH solution 6.25 M at 70˚C during 8 h [24] . After etching, the CR-39 detectors were washed in distilled water and then dipped for few minutes in a 3 % acetic acid solution and washed again with distilled water and dried in air. Can technique using CR-39 detectors have been used for measurements of uranium and radium concentration [25] as shown in Figure 1. The background of CR-39 track detectors were counted by optical microscope and subtracted from the count of all detectors. The tracks density in the nuclear track detector was counted using an optical microscopic (kruss-mbl2000) at a magnification of 400×.
3. Results and Discussion
The “can technique” proposed by Alter and Price [26] and then developed by Somogyi [27] was used to calculate the radium and uranium concentrations in vegetables samples. The radium concentration in vegetable has been calculated by using the relation:
 (1)
(1)
where  is the effective radium content of vegetables samples (Bq/kg), M is the mass of vegetables sample (0.0185 kg), A is the area of cross-section of the bottle (9.6211 × 10⁻⁴ m2), h is the distance between the detector and the top of the vegetable sample (0.049 m), K is the sensitivity factor, which is equal to 0.045987 tracks∙cm−2∙d−1 per Bq∙m−3 and Te is the effective exposure time, which is related to the actual exposure time T and decay constant
  for 222Rn by the relation [28] .
 (2)
(2)
uranium concentrations CU in units of part per million (ppm) of vegetable samples has been calculated using the following equation [29] :

Figure 1. Shows a test tube technique used in the study.
 (3)
(3)
where WS is the weight of sample (18.5 gm).
Uranium weight (WU) in sample can calculate from the following equation [Richard and Josef, 1995] [30] :
 (4)
(4)
where  : numbers of uranium atoms,
  : weight molecular uranium,
  : number of Avogadro 6.023 × 10²³ atom/mol.
The results of radium and uranium concentrations from the vegetables samples are presented in Table 1. Figure 2 shows the relation between uranium concentration with the radium concentrations i.e. positive correlation has been observed between uranium concentration and radium concentration in vegetable samples of this study.
The Eggplants were characterized by the highest value of radium concentration 0.566 Bq/kg, while the lowest value of radium concentration in vegetables was found in the Parsley 0.074 Bq/kg. In addition to that, the average value of radium concentration in vegetables was 0.317 Bq/kg. The uranium concentrations are found to vary from 0.081 to0.615 ppm with a mean value of 0.345ppm for the same samples.
From Table 1, it has seen observed that there are variations in the values of uranium and radium concentrations among the samples. This variation may be arisen due to the difference in the nature of the samples and nuclei content of this samples.

Table 1. Radium and uranium concentrations in vegetable samples.
The determination of radium and uranium concentrations in vegetable samples is very important in the exploration of the natural resources of these elements.
We found the uranium content in the vegetable samples was low and not significant from a health hazard point of view.
Figure 3 and Figure 4 have shown the distribution of radium and uranium concentration respectively, for different vegetable samples in Iraqi market.

Figure 2. Showing the correlation between radium and uranium concentrations.
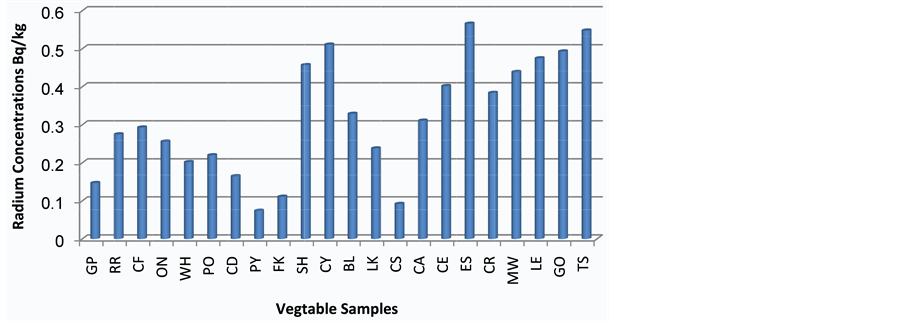
Figure 3. Radium concentrations in twenty two vegetable samples.
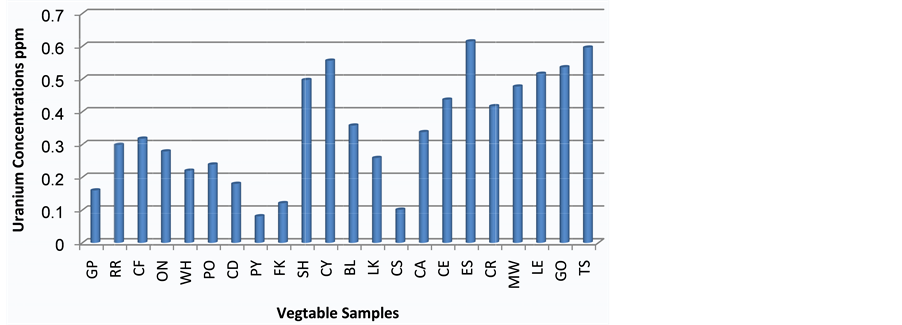
Figure 4. Uranium concentrations in twenty two vegetable samples.
The result of the uranium concentration of vegetable samples is quite low compared with the allowed limit (11.7 ppm) [31] .
In Egypt, Ibrahim et al. (2007) reported radium content in twelve types of fresh vegetables were investigated for 226Ra and the results are listed in Table 2. It was found that the maximum level of 226Ra was 2.11 ± 0.01 Bq/kg detected in garden rocket, while the minimum level of <0.32 Bq/kg was detected in carrot, cucumber, green haricot, green bean, and spinach [32] . The values of effective radium content presented in this paper for vegetables samples are lower than those reported by Ibrahim et al. (2007) for garden rocket and agree with the values for carrot, cucumber, green haricot, green bean, and spinach [32] .
In India, Shanthi et al. (2009) [33] shows that the activity concentration of 226Ra for vegetables varies between 0.064 ± 0.03 (tomato) and 1.227 ± 0.24 Bq/kg (drumstick).
The maximum values of effective radium content in the vegetables samples studied are below the maximum than those reported by Shanthi et al. 2009, while the minimum value in vegetables samples are higher than values for the same study.
Concentrations of radium in foods vary widely because of the differing background levels, climate, and agricultural conditions that prevail. There are also differences in the types of local foods that may be included in the categories such as vegetables and fruits. The database is summarized in Table 3 [31] . The values of radium content reported in Table 3 are less than the values presented in this study for vegetables samples except maximum values in Germany.
Table 2. The levels of 226Ra in fresh vegetables [32] .
Table 3. The levels of 226Ra in leafy vegetables and root vegetables and fruits [31] .
4. Conclusions
The concentrations of radium and uranium have been measured using can technique method. The results showed that radium and uranium concentration in vegetable samples were ranged between (0.074 - 0.566) Bq/kg and (0.081 - 0.615) ppm, respectively. In addition, the highest concentration was found in Eggplants sample, whereas the lower concentration was found in the Parsley sample.
The results also show that, the mean values of radium and uranium concentrations for all vegetable samples are equal, 0.317 Bq/kg and 0.345 ppm, respectively.
The result of the uranium concentration of vegetable samples is quite low compared with the allowed limit (11.7 ppm). The radium distribution is found to be heterogeneous as the radium content in the vegetables samples varies from sample to another.
The results have revealed that the samples were safe as far the health hazard effects are concerned. Positive correlation has been observed between radium content and uranium concentrations in vegetable samples.
Cite this paper
Abdalsattar KareemHashim,Laith AhmedNajam, (2015) Radium and Uranium Concentrations Measurements in Vegetables Samples of Iraq. Detection,03,21-28. doi: 10.4236/detection.2015.34004
References
- 1. Quindos, L.S., Fernandez, P.L., Soto, J., Rodenas, C. and Comez, J. (1994) Natural Radioactivity in Spanish Soils. Health Physics, 66, 194-200.
http://dx.doi.org/10.1097/00004032-199402000-00010 - 2. Evans, R.D. (1974) Radium in Man. Health Physics, 27, 497-510.
http://dx.doi.org/10.1097/00004032-197411000-00010 - 3. Binesh, A., Pourhabib, Z., Arabshahi, H. and Mohammadi, S. (2011) Determination of Radon and Radium in Springs, Wells, Rivers and Drinking Water Samples of Ramsar in Iran. International Journal of Science and Advanced Technology, 2, 32-36.
- 4. Office of Environmental Health Hazard Assessment-California Environmental Protection Agency, Pesticide and Environmental Toxicology Branch (2006) Public Health Goals for Chemicals in Drinking Water RADIUM-226 and -228.
- 5. Bruland, O.S., Jonasdottir, T.J., Fisher, D.R. and Larsen, R.H. (2008) Radium-223: From Radiochemical Development to Clinical Applications in Targeted Cancer Therapy. Current Radiopharmaceuticals, 1, 203-208.
http://dx.doi.org/10.2174/1874471010801030203 - 6. Abumurad, K.M. and Al-Tamimi, M. (2001) Emanation Power of Radon and Its Concentration in Soil and Rocks. Radiation Measurements, 34, 423-426.
http://dx.doi.org/10.1016/S1350-4487(01)00199-8 - 7. Singh, J., Singh. H., Singh, S. and Bajwa, B.S. (2009) Uranium, Radium and Radon Exhalation Studies in Some Soil Samples Using Plastic Track Detectors. Indian Journal of Physics, 83, 1147-1153.
http://dx.doi.org/10.1007/s12648-009-0094-z - 8. Mahur, A.K., Khan, M.S. Naqvi, A.H., Prasad, R. and Azam, A. (2008) Measurement of Effective Radium Content of Sand Samples Collected from Chhatrapur Beach, Orissa, India Using Track Etch Technique. Radiation Measurements. 43, S520-S522.
http://dx.doi.org/10.1016/j.radmeas.2008.04.051 - 9. Shakir, M., Azam, A., Naqvi, A.H., Deepak, V., Zubair, M. and Bhardwaj, M.K. (2010) Radium and Radon Exhalation Studies in Soil Samples. In: Rece Trends in Radiation Physics Research, 356-357.
- 10. Fisenne, I.M., Perry, P.M., Decker, K.M. and Keller, H.W. (1987) The Daily Intake of 234,235,238U, 228,230,232Th and 226,228Ra by New York City Residents. Health Physics, 53, 357-363.
http://dx.doi.org/10.1097/00004032-198710000-00002 - 11. Singh, N.P., Burleigh, D.P., Ruth, H.M., et al. (1990) Daily U Intake in Utah Residents from Food and Drinking Water. Health Physics, 59, 333-337.
- 12. Nozaki, T., Ichikawa, M., Sasuga, T. and Inarida, M. (1970) Neutron Activation Analysis of Uranium in Human Bone, Drinking Water and Daily Diet. Journal of Radioanalytical Chemistry, 6, 33-40.
http://dx.doi.org/10.1007/BF02513897 - 13. Harley, J.H. (1988) Naturally Occurring Sources of Radioactive Contamination. In: Harley, J.H., Schmidt, G.D. and Silini, G., Eds., Radionuclides in the Food Chain, Springer-Verlag, Berlin, 55-71.
http://dx.doi.org/10.1007/978-1-4471-1610-3_6 - 14. La Touche, Y.D., Willis, D.L. and Dawydiak, O.I. (1987) Absorption and Biokinetics of U in Rats Following an Oral Administration of Uranyl Nitrate Solution. Health Physics, 53, 147-162.
http://dx.doi.org/10.1097/00004032-198708000-00005 - 15. Fisenne, I.M. and Perry, P.M. (1985) Isotopic U Concentration in Human Blood from New York City Donors. Health Physics, 49, 1272-1275.
- 16. Moss, M.A. (1985) Chronic Low Level Uranium Exposure via Drinking Water—Clinical Investigations in Nova Scotia. Master’s Thesis, Dalhousie University, Studley.
- 17. Wrenn, M.E., Durbin, P.W., Howard, B., et al., (1985) Metabolism of Ingested U and Ra. Health Physics, 48, 601-633.
http://dx.doi.org/10.1097/00004032-198505000-00004 - 18. Igarashi, Y., Yamakawa, A. and Ikeda, N. (1987) Plutonium and Uranium in Japanese Human Tissues. Radioisotopes, 36, 433-439.
http://dx.doi.org/10.3769/radioisotopes.36.9_433 - 19. Dunn, C.E. (1981) The Bio-Geological Expression of Deeply Buried Uranium Mineralization in Saskachewan, Canada. Journal of Geochemical Exploration, 15, 437-452.
http://dx.doi.org/10.1016/0375-6742(81)90078-9 - 20. Dyck, W. (1979) Application of Hydro Geochemistry to the Search of Uranium. Economic Geology Reports, 31, 489-510.
- 21. Cothern, C.R. and Lappenbusch, W.L. (1983) Occurrence of Uranium in Drinking Water: US. Health Physics, 45, 89-99.
http://dx.doi.org/10.1097/00004032-198307000-00009 - 22. Tanner, A.B. (1980) Radon Migration in the Ground: A Supplementary Review. In: Gesell, T.F. and Lowder, W.M., Eds., The Natural Radiation Environment III, National Technical Information Services, National Technical Information Service, Springfield, 5-56.
- 23. Santos, E.E., Lauria, D.C., Amaral, E.C.S. and Rochedo, E.R. (2002) Daily Ingestion of 232Th, 238U, 226Ra, 228Ra and 210Pb in Vegetables by Inhabitants of Rio de Janeiro Cit. Journal of Environmental Radioactivity, 62, 75-86.
http://dx.doi.org/10.1016/S0265-931X(01)00152-7 - 24. Hashim, A.K. and Ali, R.H.A. (2015) Measurement of Annual Effective Doses of Radon in Plastic Bottled Mineral Water Samples in Iraq. Australian Journal of Basic and Applied Sciences, 9, 31-35.
- 25. Abu-Jarad, F. (1988) Application of Nuclear Track Detectors for Radon Related Measurements. Nuclear Tracks and Radiation Measurements, 15, 525-534.
http://dx.doi.org/10.1016/1359-0189(88)90195-1 - 26. Alter, H.W. and Price, P.B. (1972) Radon Detection Using Track Registration Material. US Patent No. 3-665-194, Terradex Corp.
- 27. Somogyi, G. (1990) The Environmental Behavior of Radium. Technical Reports Series 310. IAEA, Vienna, 229-256.
- 28. Azam, A., Naqvi, A.H. and Srivastava, D.S. (1985) Radium Content and Radon Exhalation Measurement Using LR-115 Type II Plastic Track Detectors. Nuclear Geophysics, 9, 653-657.
- 29. Al-Saadi, A.J., Hashim, A.S.K. and Hussein, F.M. (2013) Measurement of Radon and Uranium Concentrations in the Dates and Their Seeds of Different Regions in Karbala Governorate. Journal of Babylon University/Pure and Applied Sciences, 21, 2134-2147.
- 30. Tykva, R. and Sabol, J. (1995) Low-Level Environmental Radioactivity Sources and Evaluation. Washington State University, Pullman.
- 31. United Nations. Source and Effects of Ionizing Radiation (1993) United Nations Scientific Committee on the Effects of atomic Radiations, 1993 Report to the General Assembly, with Scientific Annexes. United Nations Sales Publication, New York, E.94.IX.2.
- 32. Saleh, I.H., Hafez, A.F. and Naim, M.A. (2007) Radiological Study on Soils, Foodstuff and Fertilizers in the Alexandria Region, Egypt. Turkish Journal of Engineering & Environmental Sciences, 31, 9-17.
- 33. Shanthi, G., Maniyan, C.G., Allan, G.R.G. and Thampi, T.K.J. (2009) Radioactivity in Food Crops from High-Background Radiation Area in Southwest, India. Current Science, 97, 1331-1335.
NOTES

*Corresponding author.